Upgrade to Pro — share decks privately, control downloads, hide ads and more …

Prediction of Infectious Disease Epidemics via Weighted Density Ensembles

Nicholas G Reich
May 24, 2017
400

Prediction of Infectious Disease Epidemics via Weighted Density Ensembles

Presentation at the MIDAS conference in May 2017.

Nicholas G Reich

May 24, 2017
Tweet

Transcript

  1. Prediction of Infectious Disease Epidemics via Weighted Density Ensembles Evan

    L. Ray & Nicholas G. Reich May 2017, MIDAS conference reichlab.io 1
  2. or, Interpretable Machine Learning for Infectious Disease Forecasting Evan L.

    Ray & Nicholas G. Reich May 2017, MIDAS conference reichlab.io 2
  3. Ensemble overview • An ensemble model fuses predictions from multiple

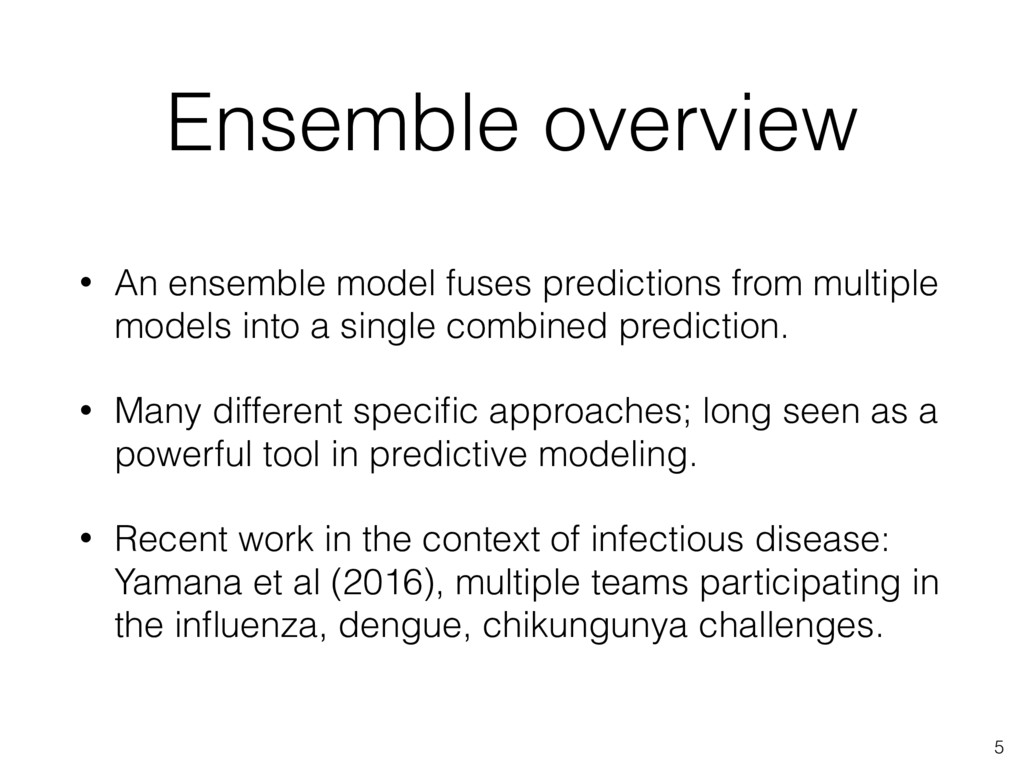
    models into a single combined prediction. • Many different specific approaches; long seen as a powerful tool in predictive modeling. • Recent work in the context of infectious disease: Yamana et al (2016), multiple teams participating in the influenza, dengue, chikungunya challenges. 5
  4. Model 1 Kernel Density Estimation (KDE) 6 Estimated distribution, based

    on historical observations, of season peak incidence, peak week and onset week.
 Distributions are not updated over the course of the season!
  5. Model 2 Kernel Conditional Density Estimation (KCDE) + copulas 7

    Ray et al. (under review) • • • • • • • • • • • • • • • • • • • • • • • • • • • • • • • • • • • • • • • • • • • • • • • • • • • • • • • • • • • • • • • • • • • •• • • • • • •• • • • • • • • • • • • • • • • • • • • • • • • • • • • • • • • • • • • •• • • • • • • • • • • • • • • • • • • • • • • • • • • • • • • • • • • • • • • • • • • • • •• • • • • • • • • • • • • • • • • • • • • • • • • • • • • • • • • • • • • • • • • • • • • • • • • • • • • • • • • • • • • • • • • • • • • • • • • • • • • • • • • • • • • • • • • • • • • • • • • • • • • • • • • • • • 2 3 4 5 6 2 3 4 5 6 Lag 1 Smoothed Log Cases Smoothed Log Cases 0.001 0.002 0.003 0.004 0.005 Time Point Weight Calculation of Time Point Weights by Computing Similarity of Lagged Observations 0.00 0.01 0.02 0.03 0.04 0.05 0 25 50 75 100 Y Estimated Density Curves Weighted Kernel Function Combined Density Estimate Points Observed Value of Y Weighted Kernel Density Estimation
  6. Model 3 Seasonal Auto-Regressive Integrated Moving Average (SARIMA) 8 Xt

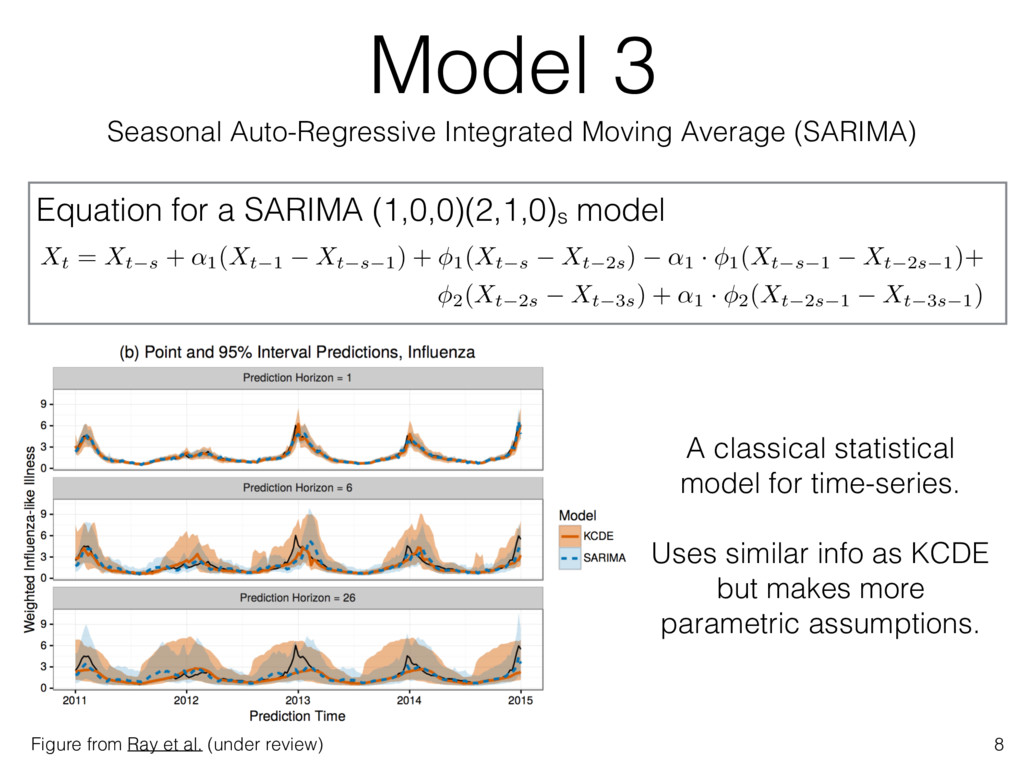
    = Xt s + ↵1(Xt 1 Xt s 1) + 1(Xt s Xt 2s) ↵1 · 1(Xt s 1 Xt 2s 1)+ 2(Xt 2s Xt 3s) + ↵1 · 2(Xt 2s 1 Xt 3s 1) Equation for a SARIMA (1,0,0)(2,1,0)s model A classical statistical model for time-series. Uses similar info as KCDE but makes more parametric assumptions. Figure from Ray et al. (under review)
  7. Model performance varies 9 Goal: To construct an ensemble that

    can capitalize on these changing patterns of performance. Training phase (1997-2010) model performance.
  8. Weighting schemes 11 equal weight constant weight feature weighted (by

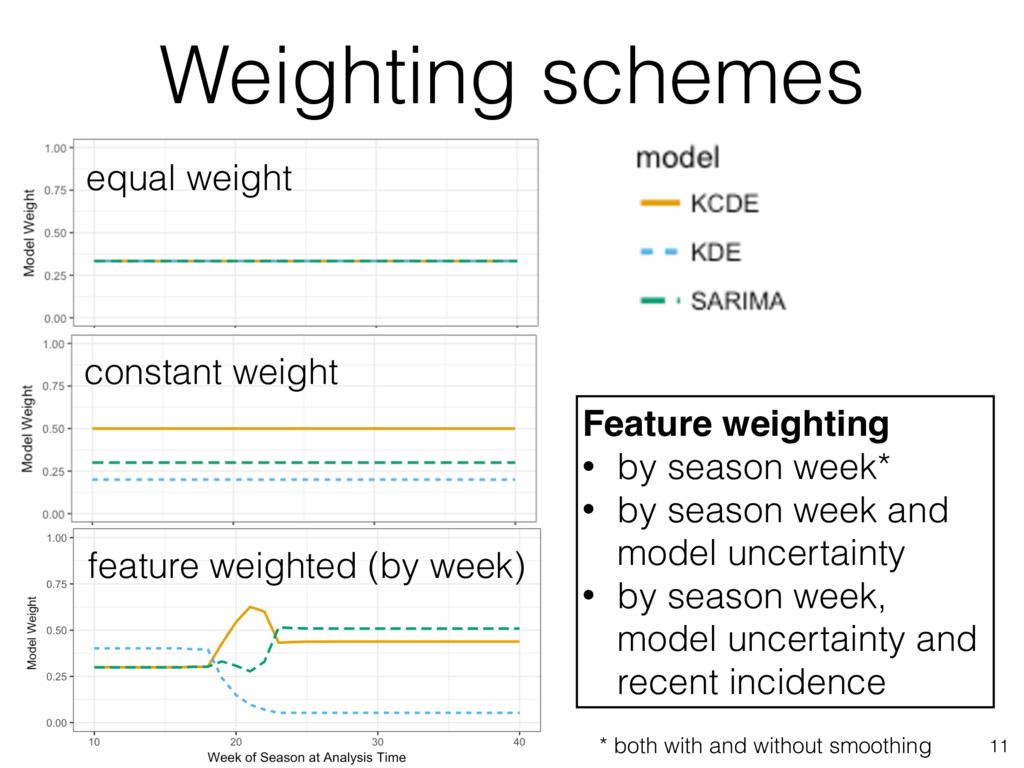
    week) Feature weighting • by season week* • by season week and 
 model uncertainty • by season week, 
 model uncertainty and 
 recent incidence * both with and without smoothing
  9. Model performance varies 12 Goal: To construct an ensemble that

    can capitalize on these changing patterns of performance.
  10. Quick Results Overview • 11 regions x 5 test seasons

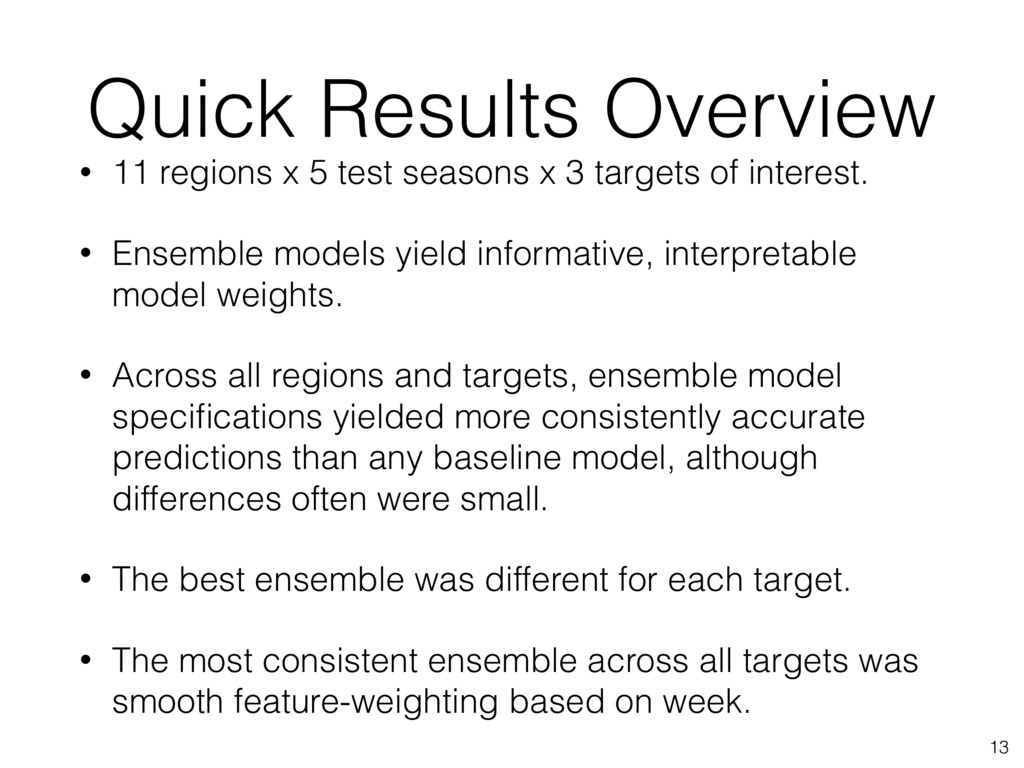
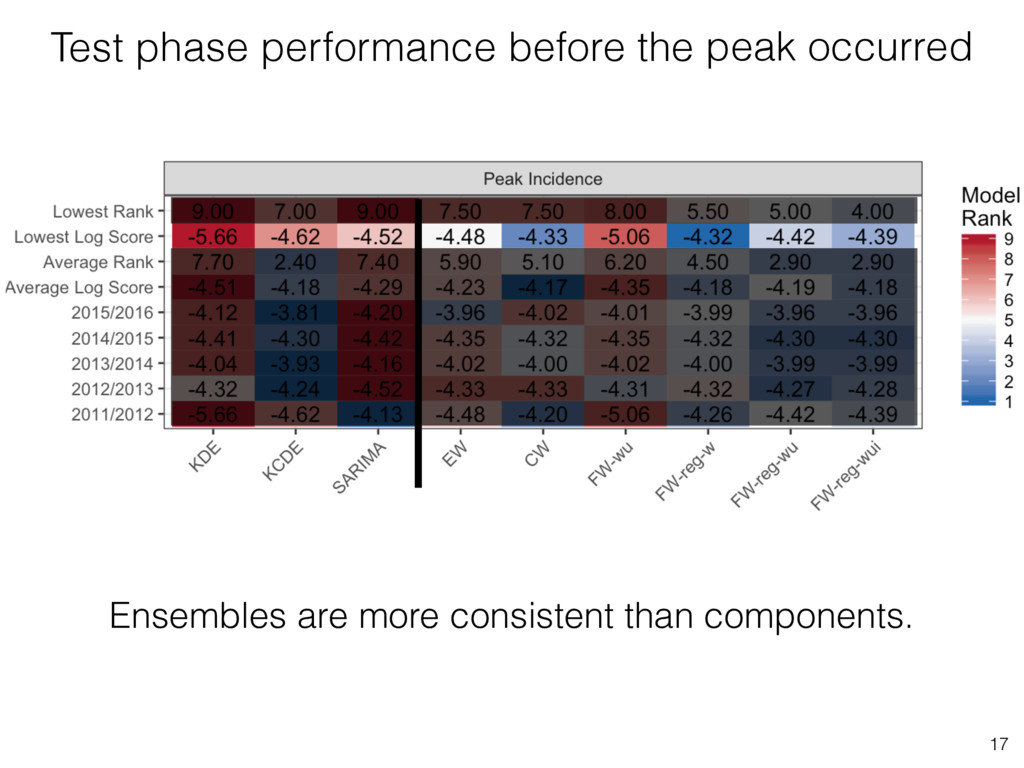
    x 3 targets of interest. • Ensemble models yield informative, interpretable model weights. • Across all regions and targets, ensemble model specifications yielded more consistently accurate predictions than any baseline model, although differences often were small. • The best ensemble was different for each target. • The most consistent ensemble across all targets was smooth feature-weighting based on week. 13
  11. A multi-group collaborative ensemble planned for 2017-2018. Guidelines: https://github.com/FluSightNetwork/cdc-flusight-ensemble/ Observed

    ILI values ILINet Baseline Model Average 90% Prediction Interval 0.0 0.5 1.0 1.5 2.0 2.5 3.0 3.5 4.0 4.5 5.0 5.5 6.0 40 42 44 46 48 50 52 2 4 6 8 10 12 14 16 18 MMWR Week Weighted ILI % Average Hist-Avg 4Sight CU1 CU2 CU3 CU4 Delphi-Epicast Delphi-Stat FORSEA GHRI Harvard HumNat HumNat2 ICS ISU KBSI KOT-Dev KOT-Stable LANL NEU PSI TeamA TeamB TeamC TeamD TeamE UoM-DSTG Yale1 Yale2 19 CDC FluSight 2016-2017
  12. Thank you! with acknowledgments to Evan Ray 20 The work

    presented in these slides has been supported by an NIGMS MIRA award (PI: Reich, R35GM119582), and a DARPA Young Faculty Award. W e are hiring!