Upgrade to Pro — share decks privately, control downloads, hide ads and more …

Estimating, evaluating, and visualizing uncertainty in the cost-effectiveness of active monitoring policies for Ebola

Nicholas G Reich
December 03, 2015

Estimating, evaluating, and visualizing uncertainty in the cost-effectiveness of active monitoring policies for Ebola

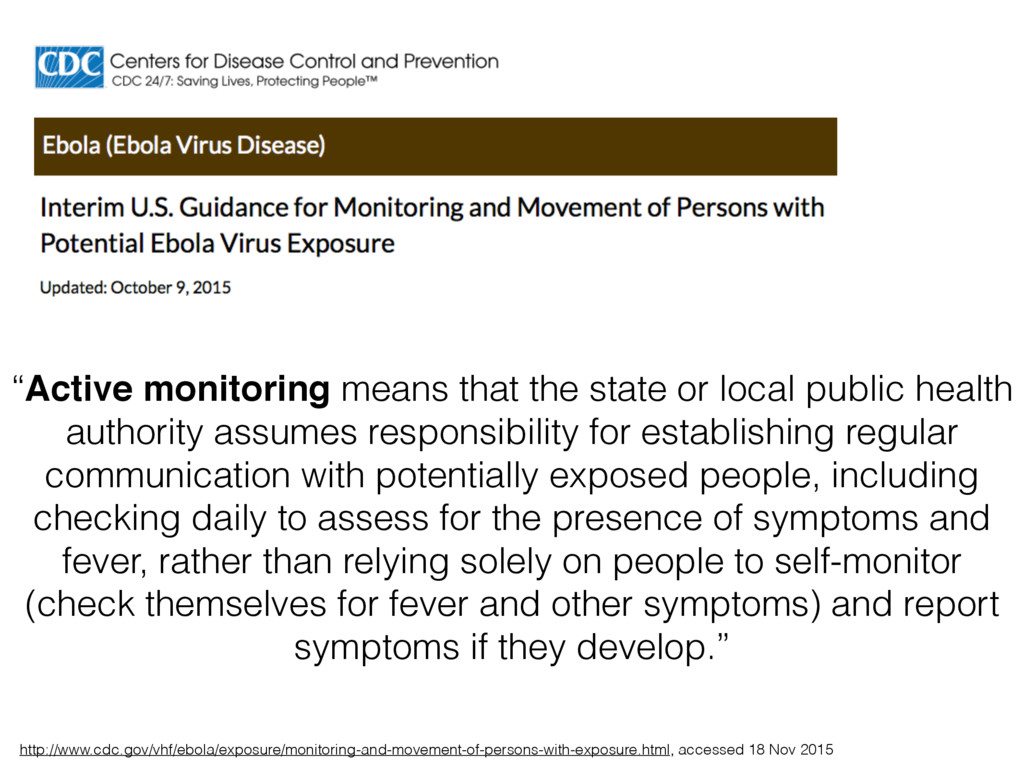
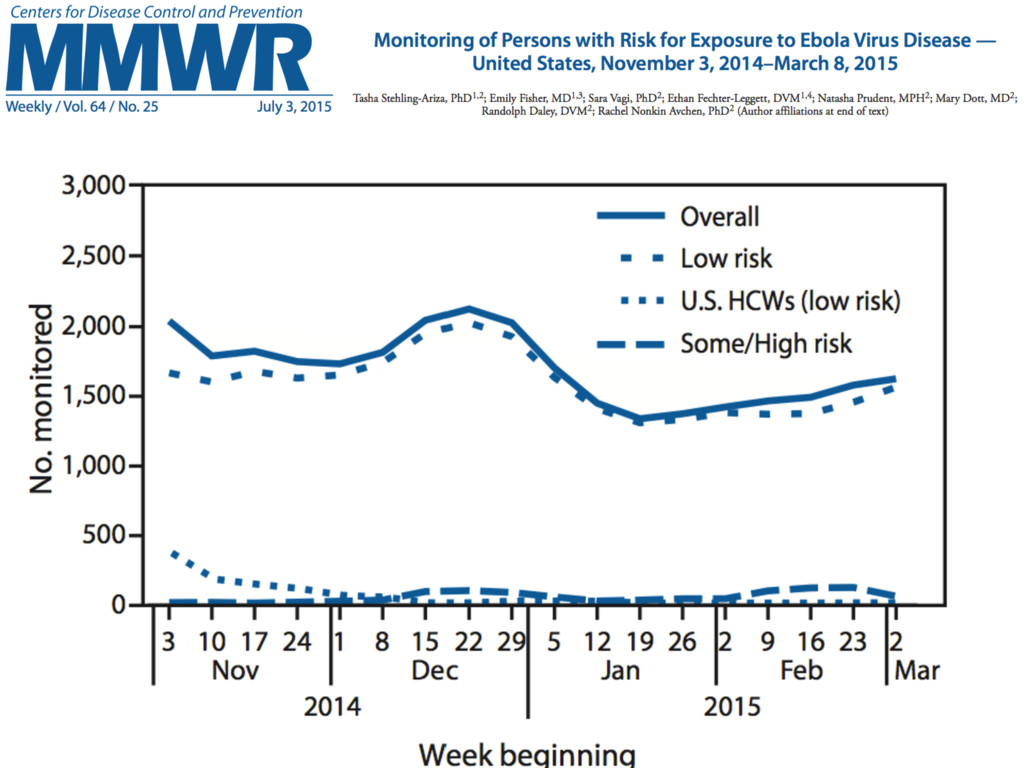
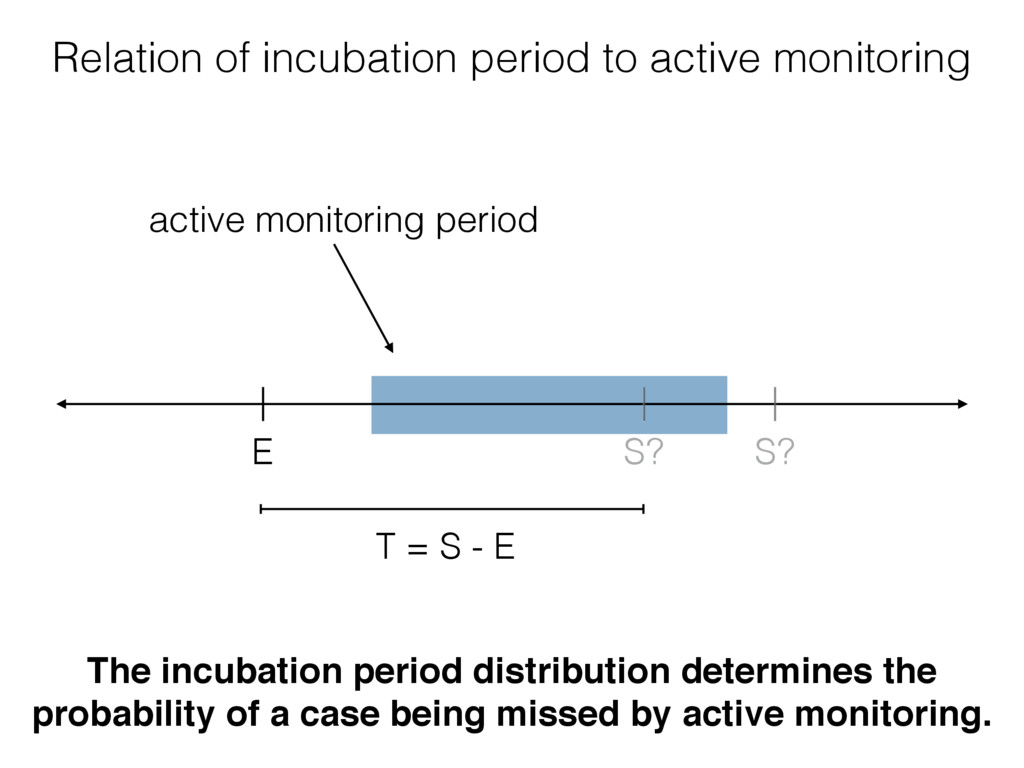
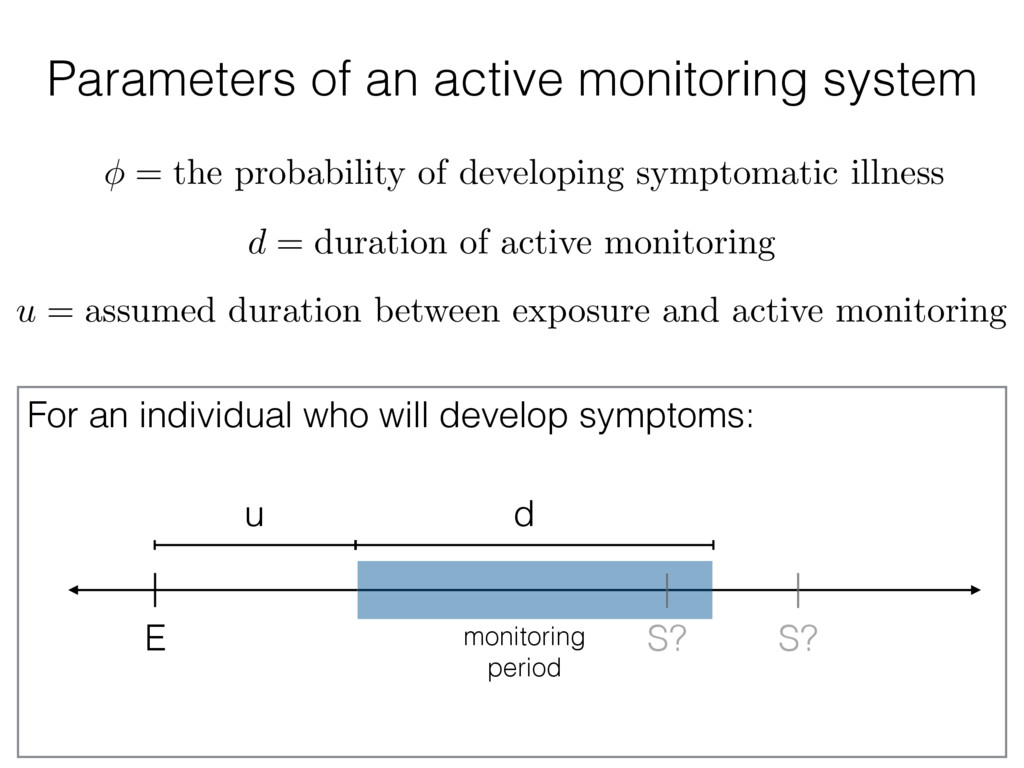
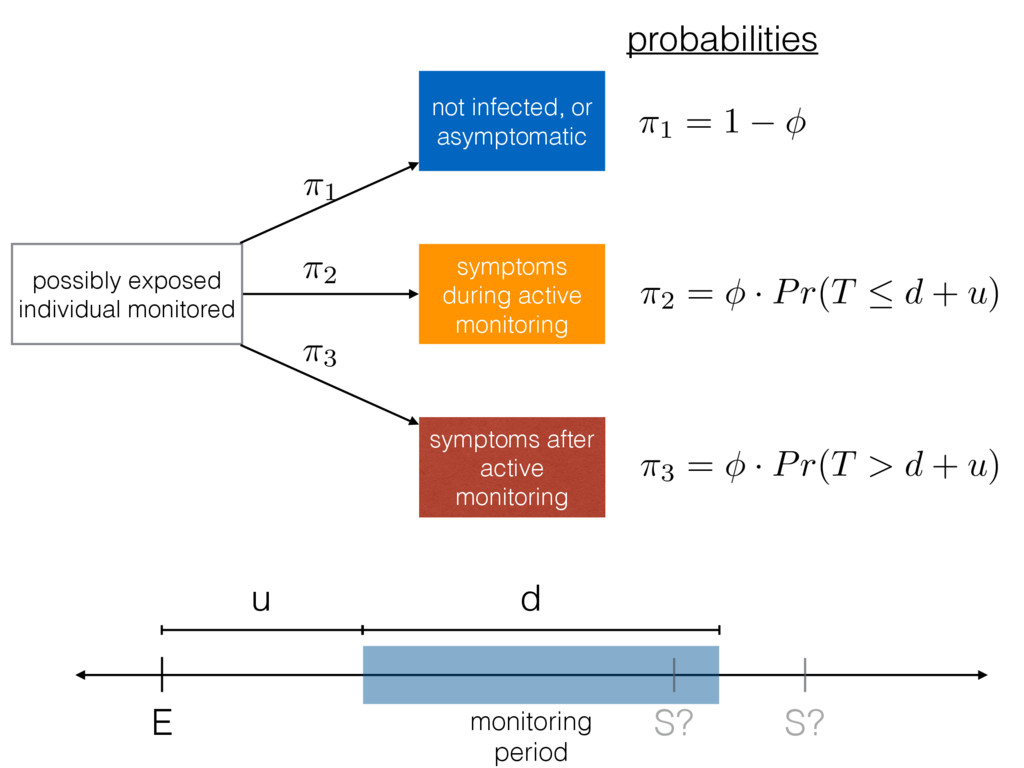
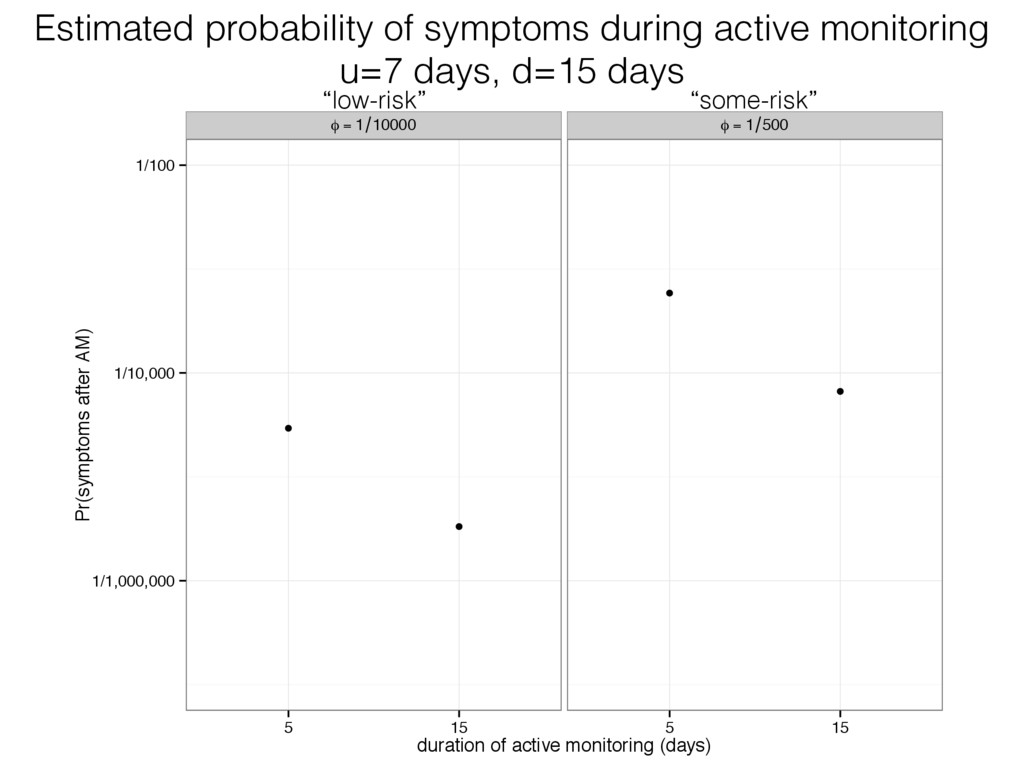
The CDC recommends active monitoring of individuals at high-, some-, and low-risk of Ebola infection. They encourage state and local public health authorities to monitor individuals for symptoms of Ebola until 21 days after the individual's last possible exposure. Since October 2014, thousands of individuals have undergone active monitoring in the US. Using a few simple assumptions about the baseline risk of developing symptoms and the duration of time between exposure to Ebola and the beginning of monitoring, we have estimated the probability that an individual develops symptoms after an active monitoring period ends.

Nicholas G Reich

December 03, 2015
Tweet

More Decks by Nicholas G Reich

Other Decks in Science

Transcript

  1. Estimating, evaluating, and visualizing uncertainty in the cost-effectiveness of active

    monitoring policies for Ebola Nicholas G Reich, Simon Cauchemez, Justin Lessler ! ! Epidemics 5 :: Clearwater Beach, FL :: Dec 2015 @reichlab
  2. Country Cumulative cases Cases in past 21 days Cumulative deaths

    Guinea 3,804 0 2,536 Liberia 10,675 3 4,808 Sierra Leone 14,122 0 3,955 Total 28,601 3 11,299 2014-15 West Africa Ebola outbreak (as of 25 Nov 2015) data source: http://apps.who.int/iris/bitstream/10665/197915/1/ebolasitrep_25Nov2015_eng.pdf?ua=1&ua=1
  3. Country Cumulative cases Cases in past 21 days Cumulative deaths

    USA 4 0 1 UK 1 0 0 Italy 1 0 0 Spain 1 0 0 Total 7 0 1 2014-15 West Africa Ebola outbreak (as of 25 Nov 2015) data source: http://www.cdc.gov/vhf/ebola/outbreaks/2014-west-africa/case-counts.html
  4. “Active monitoring means that the state or local public health

    authority assumes responsibility for establishing regular communication with potentially exposed people, including checking daily to assess for the presence of symptoms and fever, rather than relying solely on people to self-monitor (check themselves for fever and other symptoms) and report symptoms if they develop.” http://www.cdc.gov/vhf/ebola/exposure/monitoring-and-movement-of-persons-with-exposure.html, accessed 18 Nov 2015
  5. “[S]tates, which have the legal authority to impose quarantines, often

    exceeded [CDC] guidelines, restricting the movements of returning health workers and others. … In interviews and in the new report, legal experts questioned the legality and even the constitutionality of quarantines in these situations. “The state has to have clear and convincing evidence that the detention is necessary to prevent the spread of disease,” said Wendy Parmet, director of the program on health policy and law at Northeastern University. …”
  6. How long should active monitoring last? ! Can we use

    data to help guide this decision making?
  7. time of symptom onset T = S - E =

    incubation period E S time of exposure the incubation period
  8. T = S - E E S? Relation of incubation

    period to active monitoring The incubation period distribution determines the probability of a case being missed by active monitoring. active monitoring period S?
  9. “Similar to results of other investigators, we estimated the mean

    incubation period to be 9·9 (9·0–11·0 days [SD 5·5, 95% CI 4·7–6·5])…” We need a higher resolution estimate of ! the incubation period distribution.
  10. Samples of incubation periods from Faye et al. 1 50

    100 150 0 10 20 30 duration of incubation period (days) participant id (ordered by median incubation period) 5th-95th percentile range median
  11. Fitted Gamma distribution to data from Faye et al. 1

    50 100 150 0 10 20 30 duration of incubation period (days) participant id (ordered by median incubation period)
  12. Fitted Gamma distribution to data from Faye et al. 1

    50 100 150 0 10 20 30 duration of incubation period (days) participant id (ordered by median incubation period) median = 8.9d (95% CI: 8.0 - 9.8) 95th percentile = 20.3d (95%CI: 18.1 - 23.0)
  13. 2 3 4 5 2 3 4 5 shape scale

    a posterior sample of gamma distribution parameters
  14. 2 3 4 5 2 3 4 5 shape scale

    posterior median
  15. 2 3 4 5 2 3 4 5 shape scale

    approx. 90% and 95% credible intervals
  16. 2 3 4 5 2 3 4 5 shape scale

    distributions with 95th percentile of incubation period = 21 days
  17. d = duration of active monitoring u = assumed duration

    between exposure and active monitoring Parameters of an active monitoring system u E monitoring period d For an individual who will develop symptoms: S? S? = the probability of developing symptomatic illness
  18. possibly exposed individual monitored not infected, or asymptomatic symptoms during

    active monitoring symptoms after active monitoring ⇡1 ⇡2 ⇡3 probabilities ⇡1 = 1 ⇡3 = · Pr(T > d + u) ⇡2 = · Pr(T  d + u) u E monitoring period d S? S?
  19. Scenario A Scenario B CDC risk level “low-risk” “some-risk” monitored

    individual traveller visited country with widespread Ebola transmission volunteer clinician worked in Ebola treatment center, using appropriate PPE approx.! Pr(infection), ! 1/10,000 1/500 Example risk scenarios
  20. φ = 1 10000 φ = 1 500 1/1,000,000 1/10,000

    1/100 5 15 5 15 duration of active monitoring (days) Pr(symptoms after AM) Estimated probability of symptoms during active monitoring u=7 days, d=15 days “low-risk” “some-risk”
  21. φ = 1 10000 φ = 1 500 1/1,000,000 1/10,000

    1/100 5 15 5 15 duration of active monitoring (days) Pr(symptoms after AM) Estimated probability of symptoms during active monitoring with parameter uncertainty, fixed u=7 days “low-risk” “some-risk” 2 3 4 5 2 3 4 5 shape scale
  22. φ = 1 10000 φ = 1 500 1/1,000,000 1/10,000

    1/100 5 15 5 15 duration of active monitoring (days) Pr(symptoms after AM) Estimated probability of symptoms during active monitoring with time-of-exposure uncertainty, i.e. u~Unif(1d, 14d) “low-risk” “some-risk”
  23. φ = 1 10000 φ = 1 500 1/1,000,000 1/10,000

    1/100 5 15 5 15 duration of active monitoring (days) Pr(symptoms after AM) Estimated probability of symptoms during active monitoring with both uncertainties comparable risk “low-risk” “some-risk”
  24. $1,000,000 $5,000,000 $10,000,000 $20,000,000 est. per case cost (sqrt scale)

    1 0.5 0.1 0.01 0 no symptoms symptoms during AM symptoms after AM per case probability (sqrt scale) Cost and event probabilities, per case $100-$1,000 $3m-$5m* $3m-$25m = 1/500 d = 15 days u = 7 days *Yacisin, K. et al. Ebola virus disease in a humanitarian aid worker - New York City, October 2014. MMWR Morb. Mortal. Wkly. Rep. 64, 321–323 (2015).
  25. Conclusions • Based on Ebola data from Guinea, about 5

    in 100 cases will have incubation periods of over 20.3 days (95% CI 18.1 - 23.0). • More data is needed to characterize the full incubation period distribution and to reduce sensitivity to outlying observations. (WHO recommends at least 200 observations.) • Public health decision-making in the context of low-probability, high-risk events is challenging. • Decreasing the duration or frequency of active monitoring for low-risk individuals could create more balanced risk between “low-“ and “some-“risk individuals, while maintaining very low overall probabilities of a case developing symptoms after active monitoring ends.