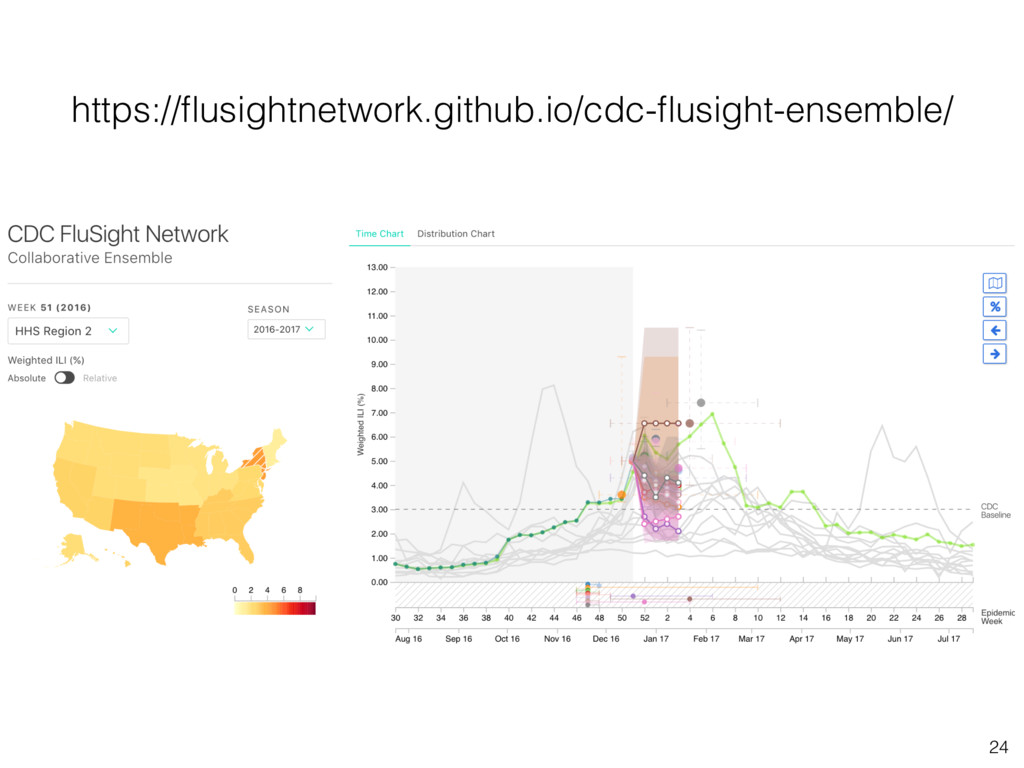
Nicholas G. Reich for the FluSight Network Collaborative Ensemble August 2017, CDC FluSight meeting https://flusightnetwork.github.io/cdc-flusight-ensemble/ 1
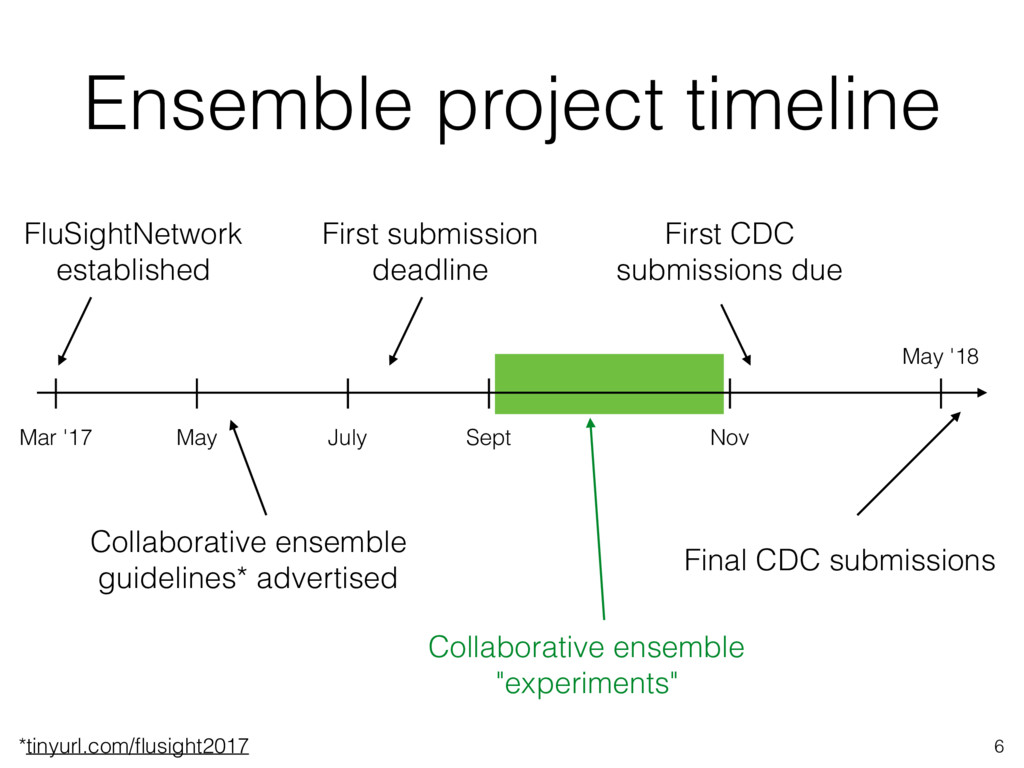
July Sept Nov May '18 Collaborative ensemble guidelines* advertised First submission deadline First CDC submissions due Final CDC submissions Collaborative ensemble "experiments" *tinyurl.com/flusight2017
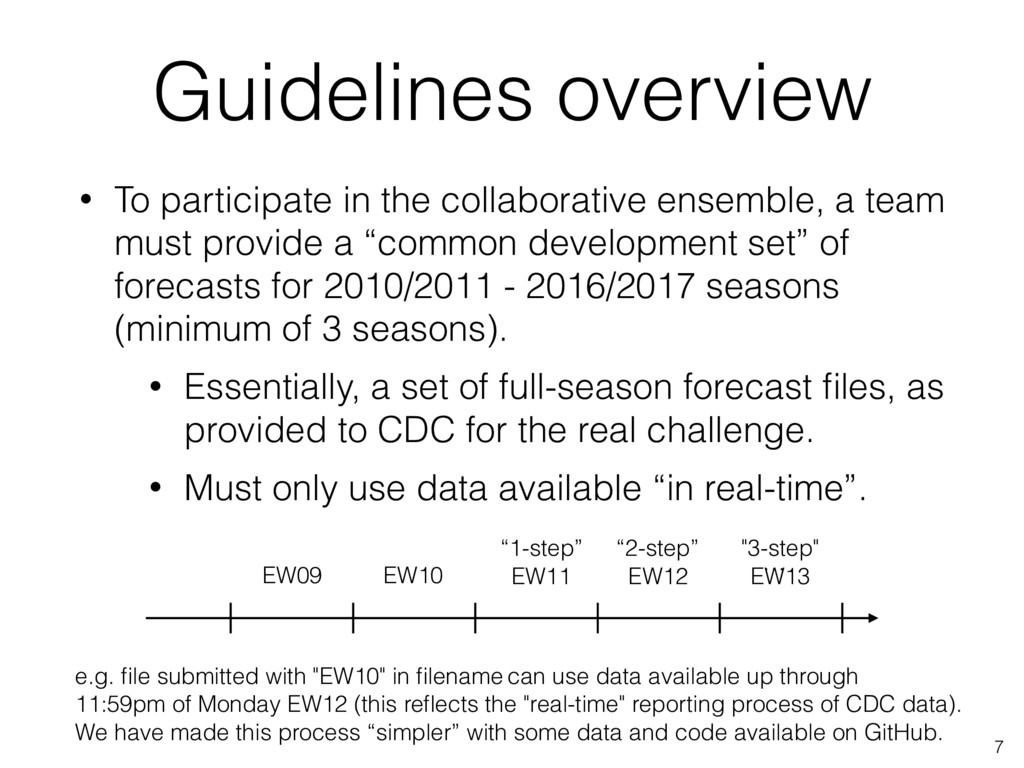
team must provide a “common development set” of forecasts for 2010/2011 - 2016/2017 seasons (minimum of 3 seasons). • Essentially, a set of full-season forecast files, as provided to CDC for the real challenge. • Must only use data available “in real-time”. 7 EW10 “1-step” EW11 “2-step” EW12 … e.g. file submitted with "EW10" in filename can use data available up through 11:59pm of Monday EW12 (this reflects the "real-time" reporting process of CDC data). We have made this process “simpler” with some data and code available on GitHub. EW09 "3-step" EW13
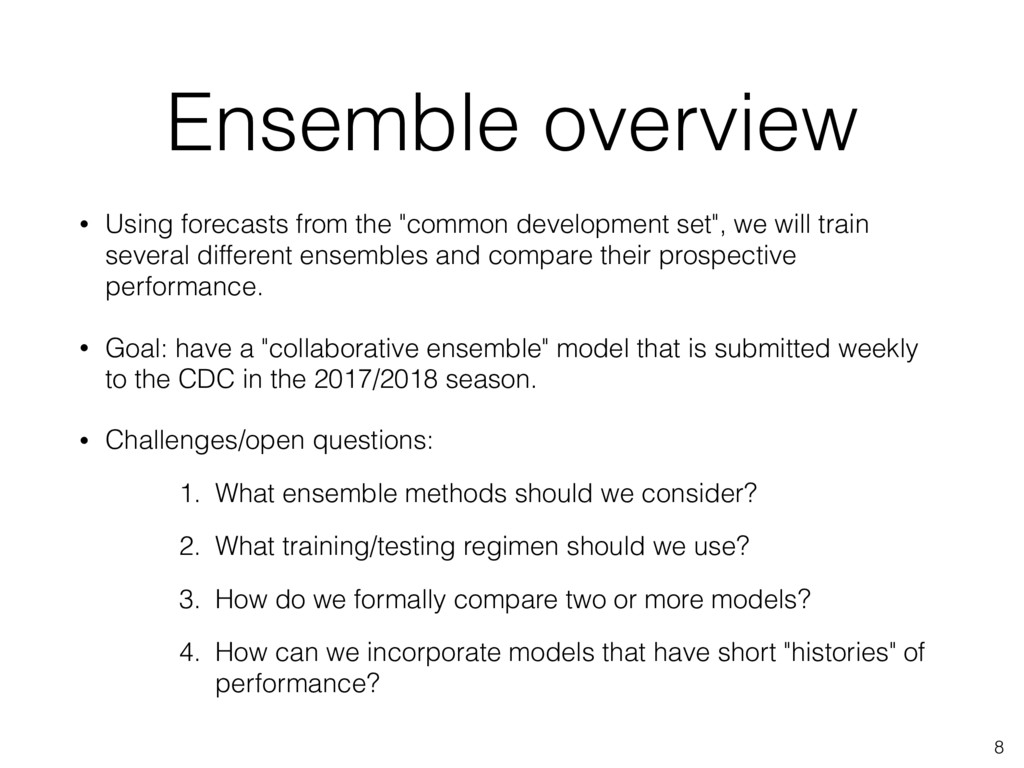
we will train several different ensembles and compare their prospective performance. • Goal: have a "collaborative ensemble" model that is submitted weekly to the CDC in the 2017/2018 season. • Challenges/open questions: 1. What ensemble methods should we consider? 2. What training/testing regimen should we use? 3. How do we formally compare two or more models? 4. How can we incorporate models that have short "histories" of performance? 8
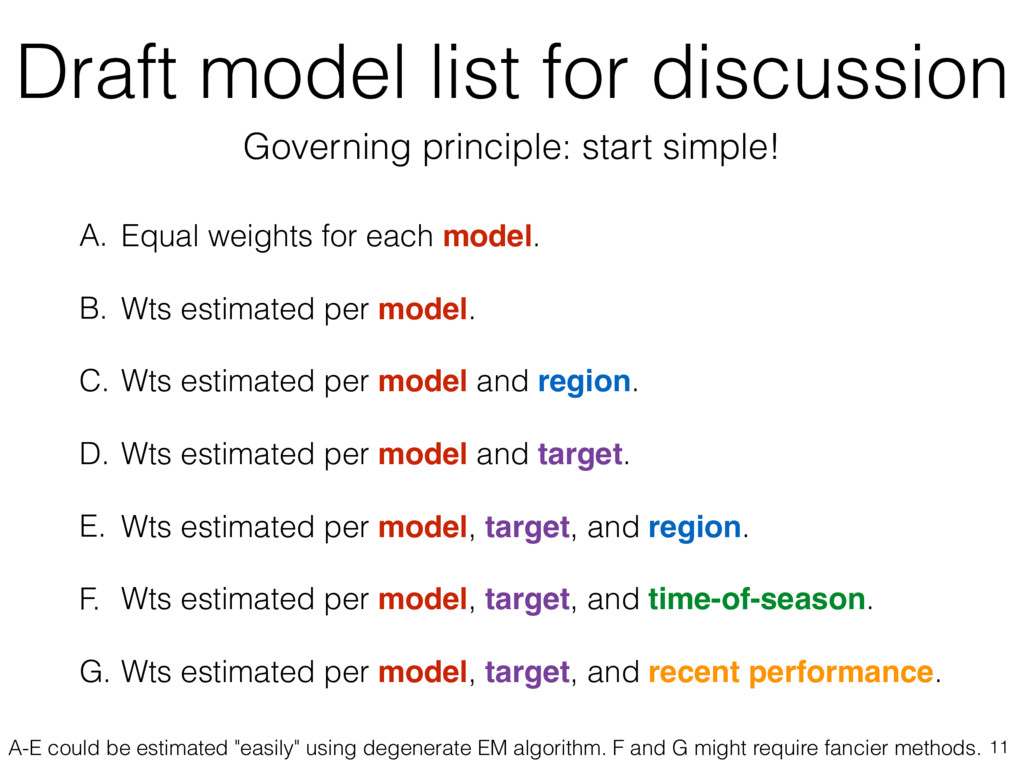
model. B. Wts estimated per model. C. Wts estimated per model and region. D. Wts estimated per model and target. E. Wts estimated per model, target, and region. F. Wts estimated per model, target, and time-of-season. G. Wts estimated per model, target, and recent performance. 11 Governing principle: start simple! A-E could be estimated "easily" using degenerate EM algorithm. F and G might require fancier methods.
2013/2014 2014/2015 2015/2016 2016/2017 Leave-one-season-out cross-validation. Two models advance to testing.* Training phase Testing phase Weights fit prospectively for each testing year. Compare two models. *Perhaps more than two models advance, if no significant difference detected between models?
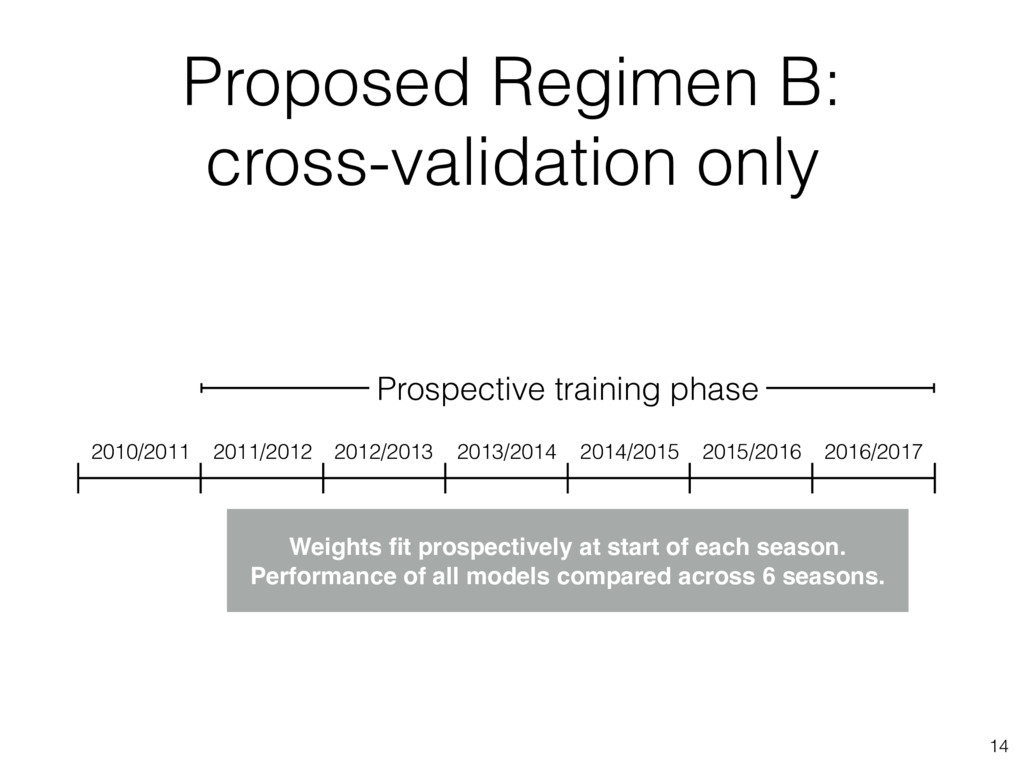
2014/2015 2015/2016 2016/2017 Weights fit prospectively at start of each season. Performance of all models compared across 6 seasons. Prospective training phase
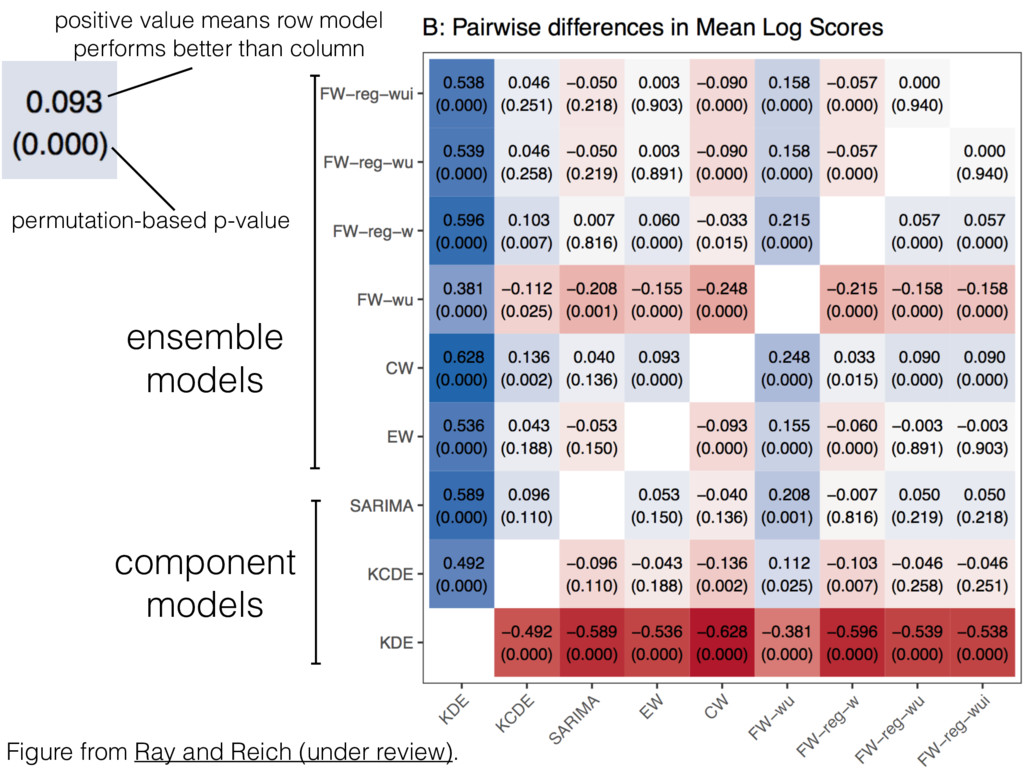
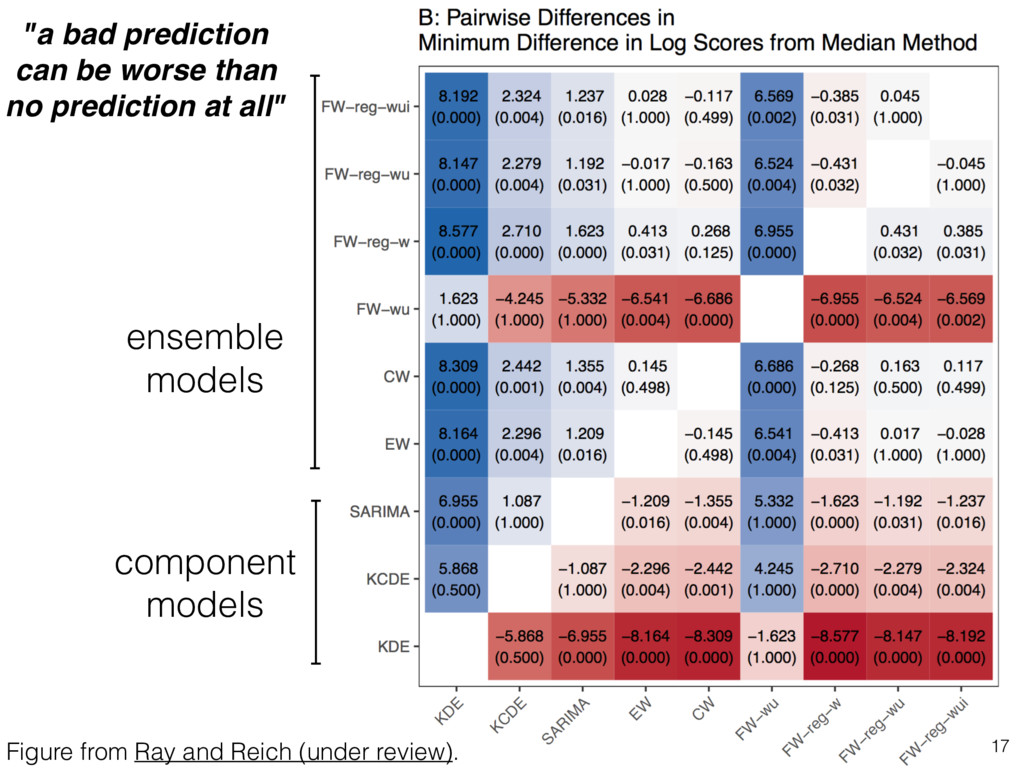
ensembles lies in improving the consistency of forecasts: i.e. there is value in comparing average performance AND a measure of consistency (i.e. worst-case performance). • Sample size and statistical power for comparisons is a major issue, especially between models with small differences. • Developing "valid" hypothesis tests is challenging because of non-normal distributions of log scores and presence of correlation in performance across weeks, seasons, and regions. 18
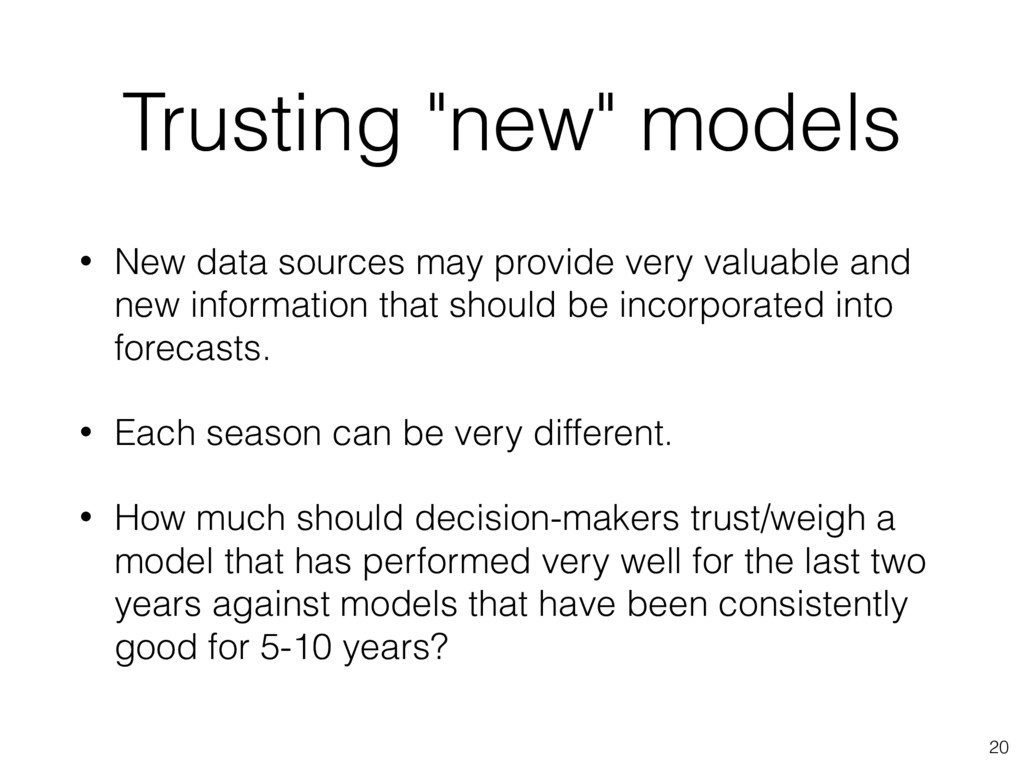
valuable and new information that should be incorporated into forecasts. • Each season can be very different. • How much should decision-makers trust/weigh a model that has performed very well for the last two years against models that have been consistently good for 5-10 years? 20
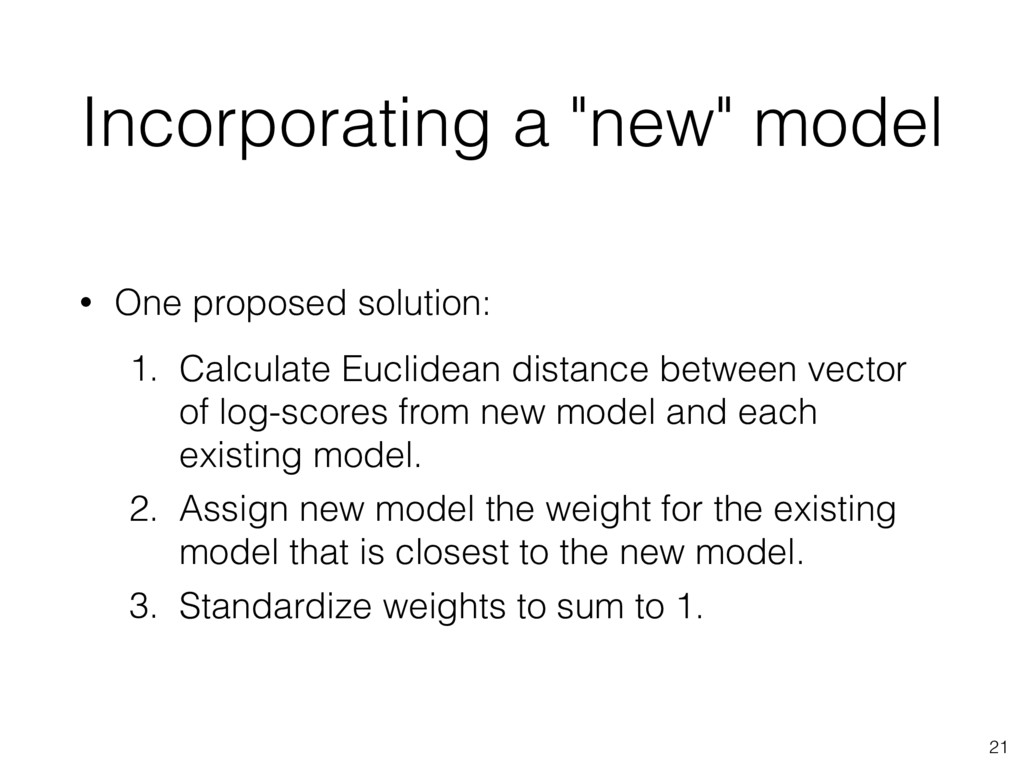
Euclidean distance between vector of log-scores from new model and each existing model. 2. Assign new model the weight for the existing model that is closest to the new model. 3. Standardize weights to sum to 1. 21
training forecasts? • How difficult to get more training seasons? • Do we use a single ensemble for all targets/regions? Or do we choose target- or region-specific ensembles? • What are the deliverables? - Collaborative submission to CDC - Report to CDC documenting ensemble comparison - Group publication at end of the 2017/2018 season • What is our plan for implementing all of this? 25 Request to join the group at https://groups.google.com/d/forum/flusightnetwork