Upgrade to Pro — share decks privately, control downloads, hide ads and more …

The economic (in)feasibility of on-premise dev/test

The economic (in)feasibility of on-premise dev/test

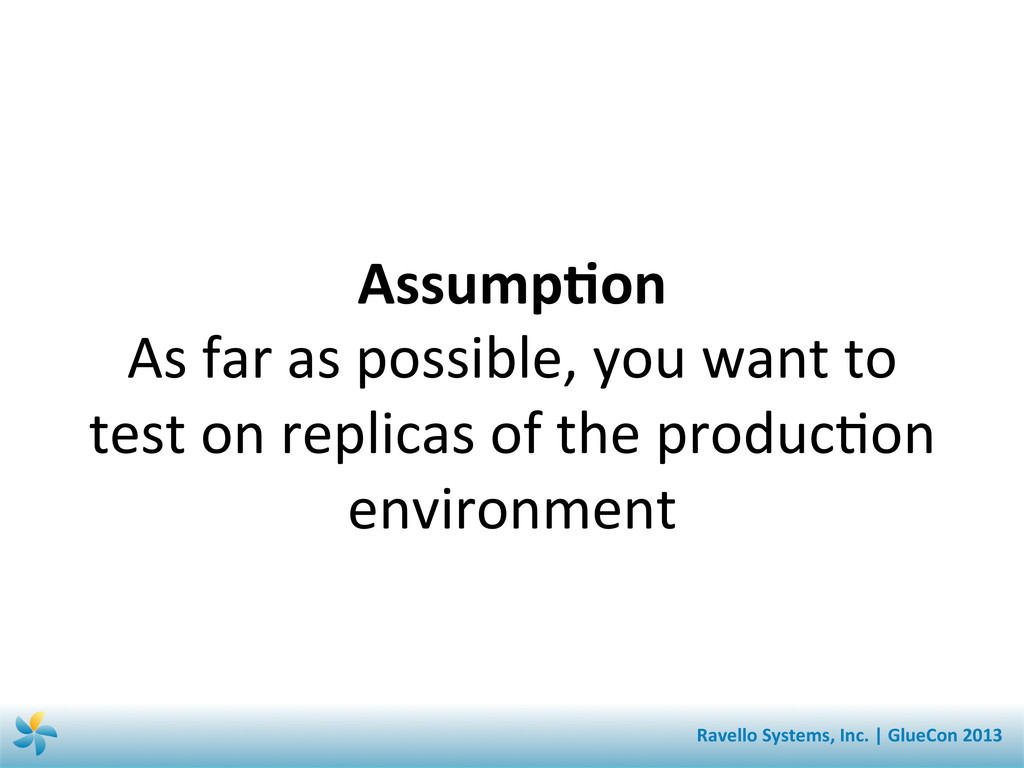
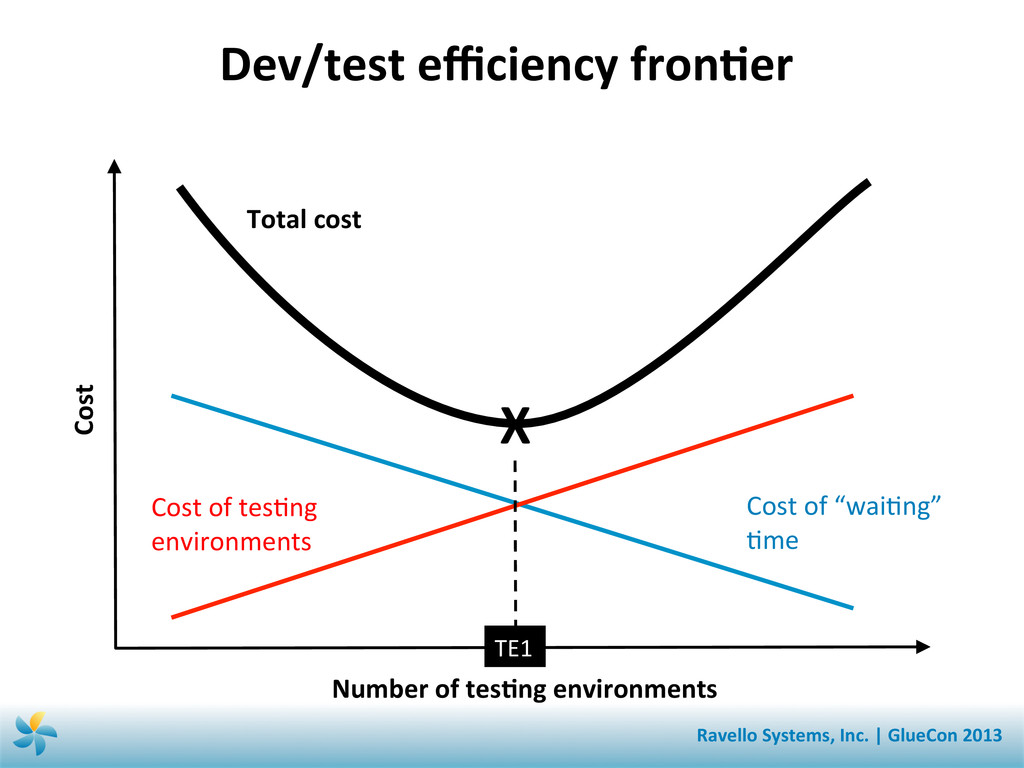
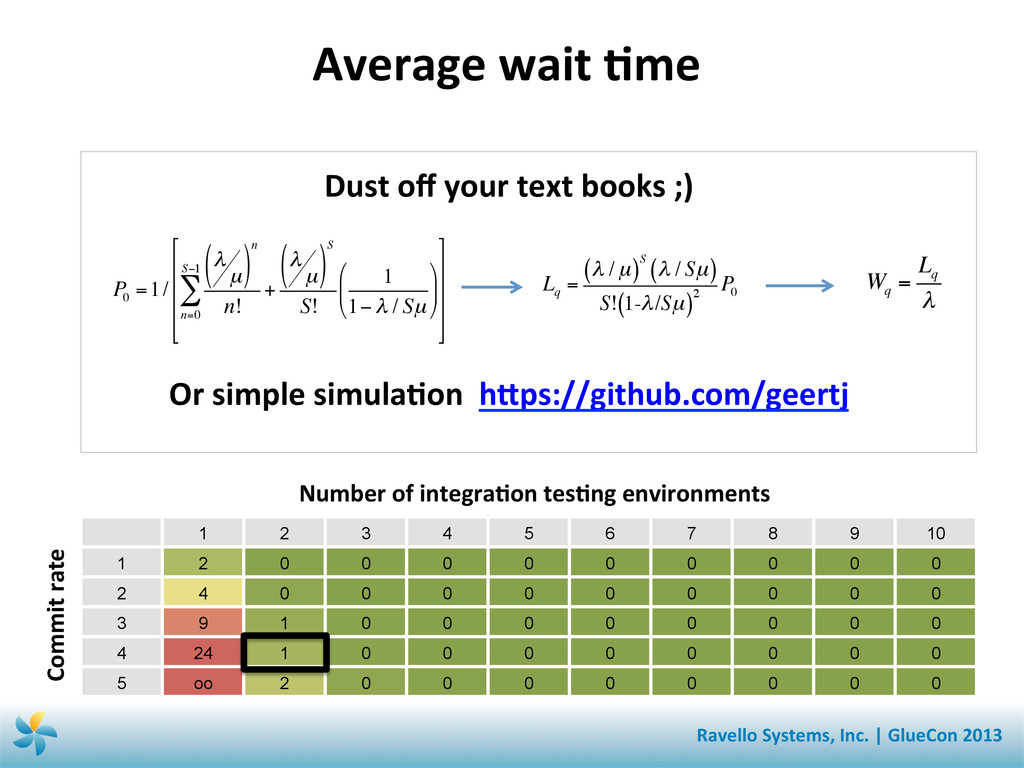
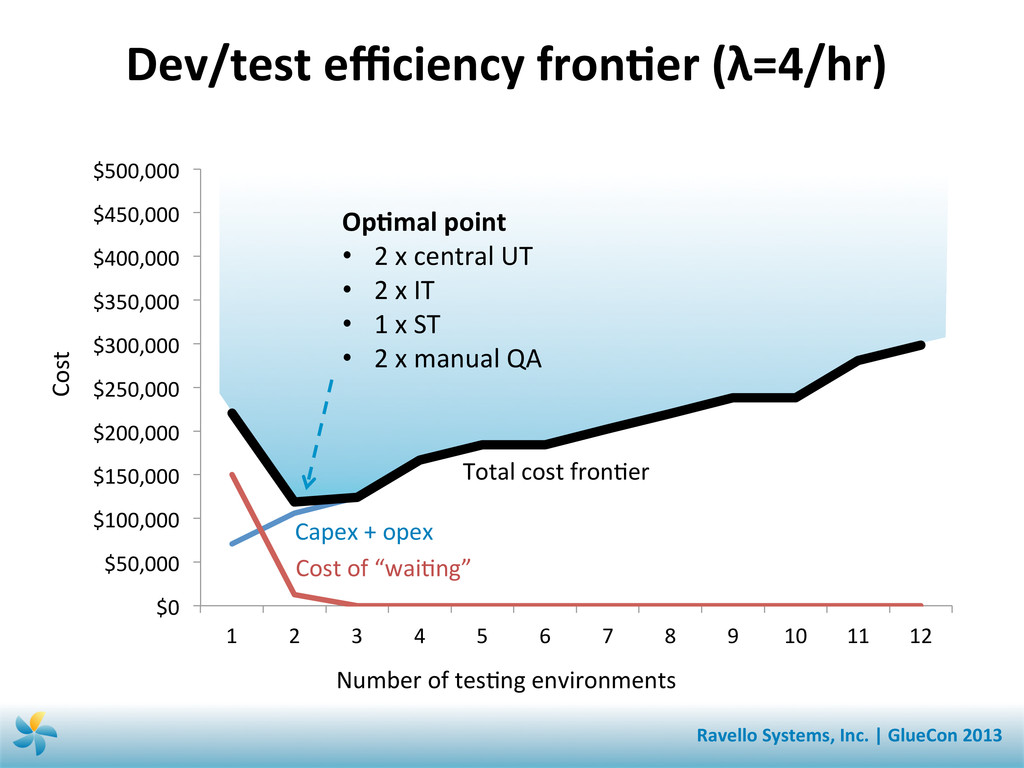
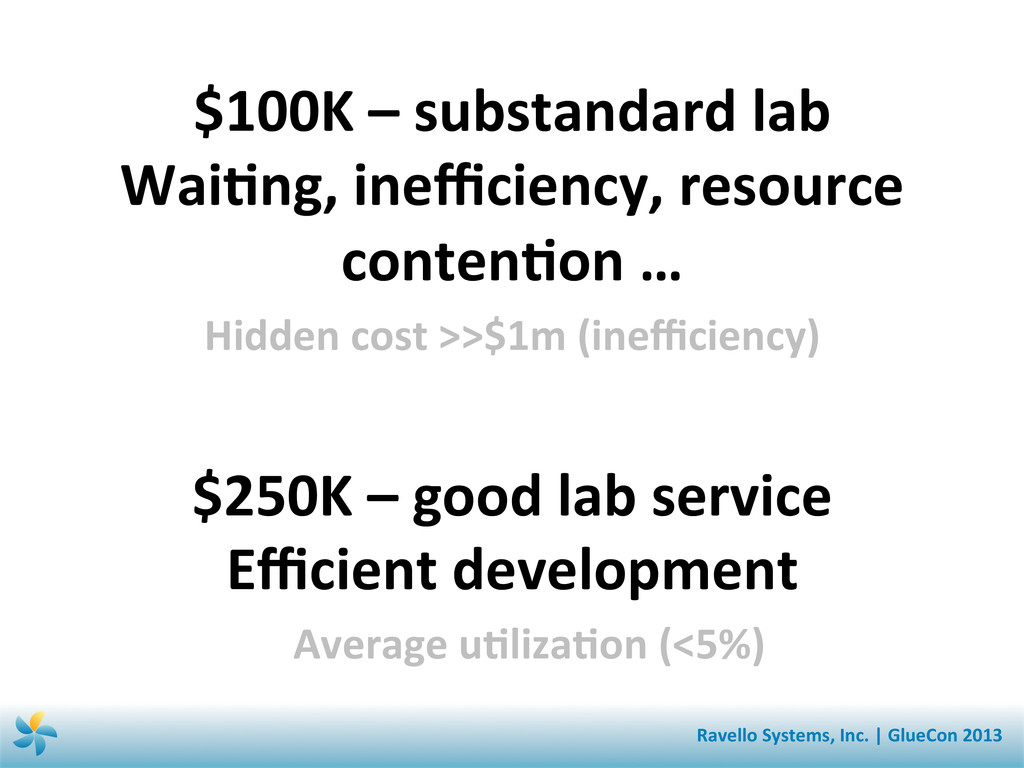
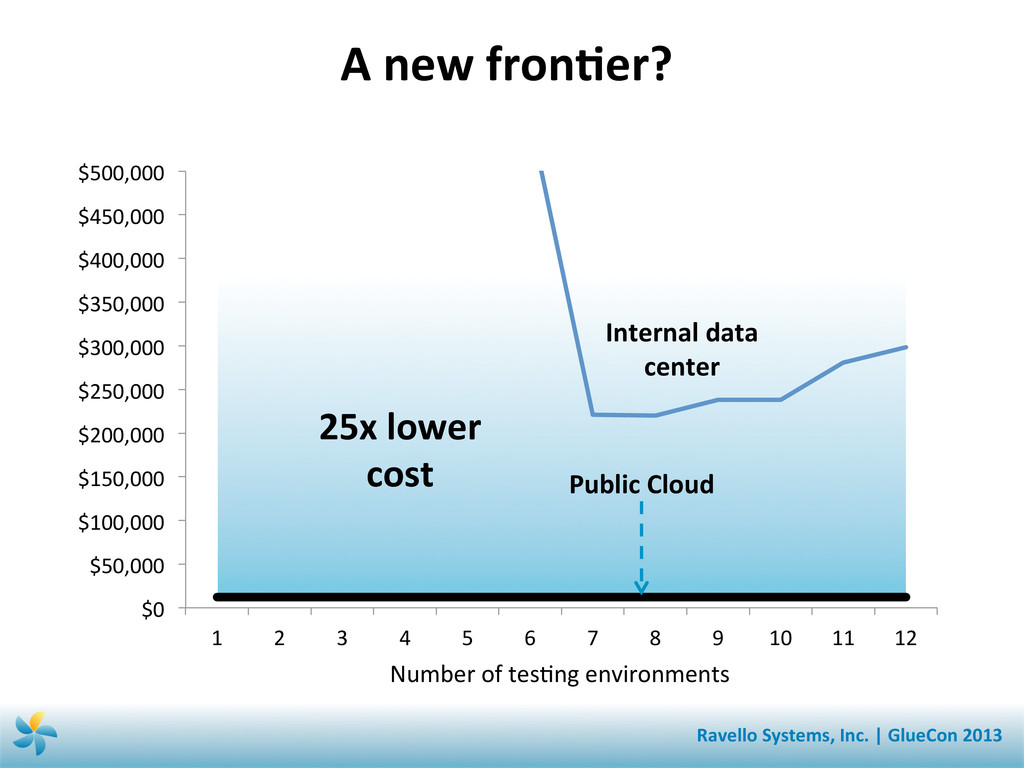
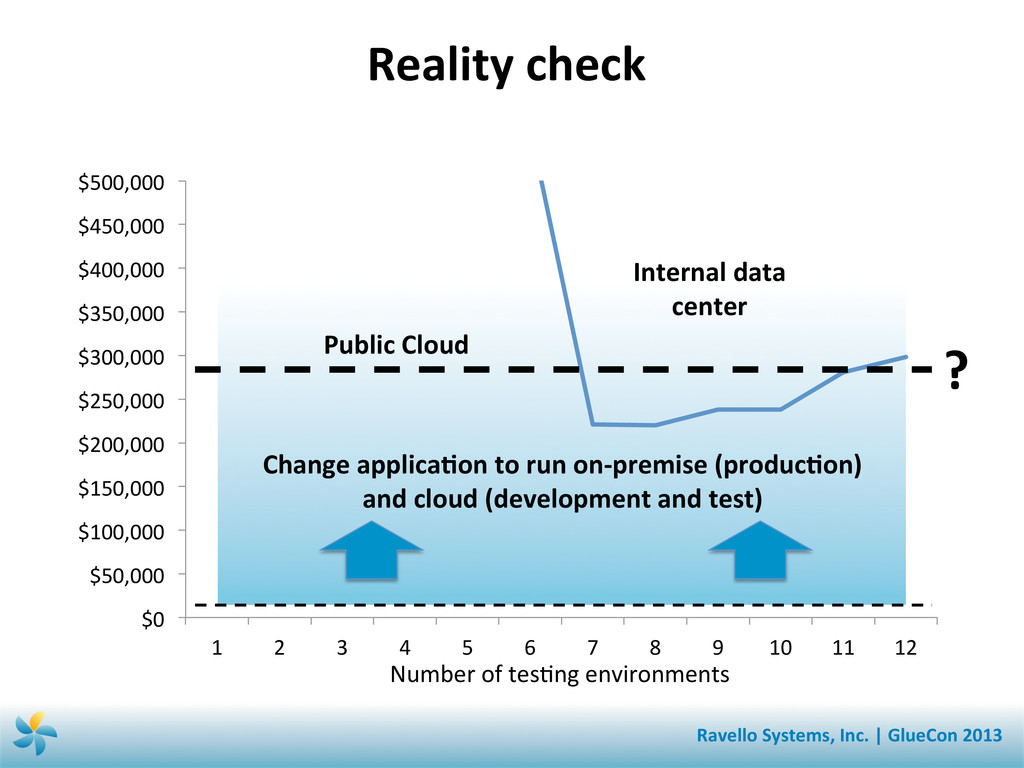
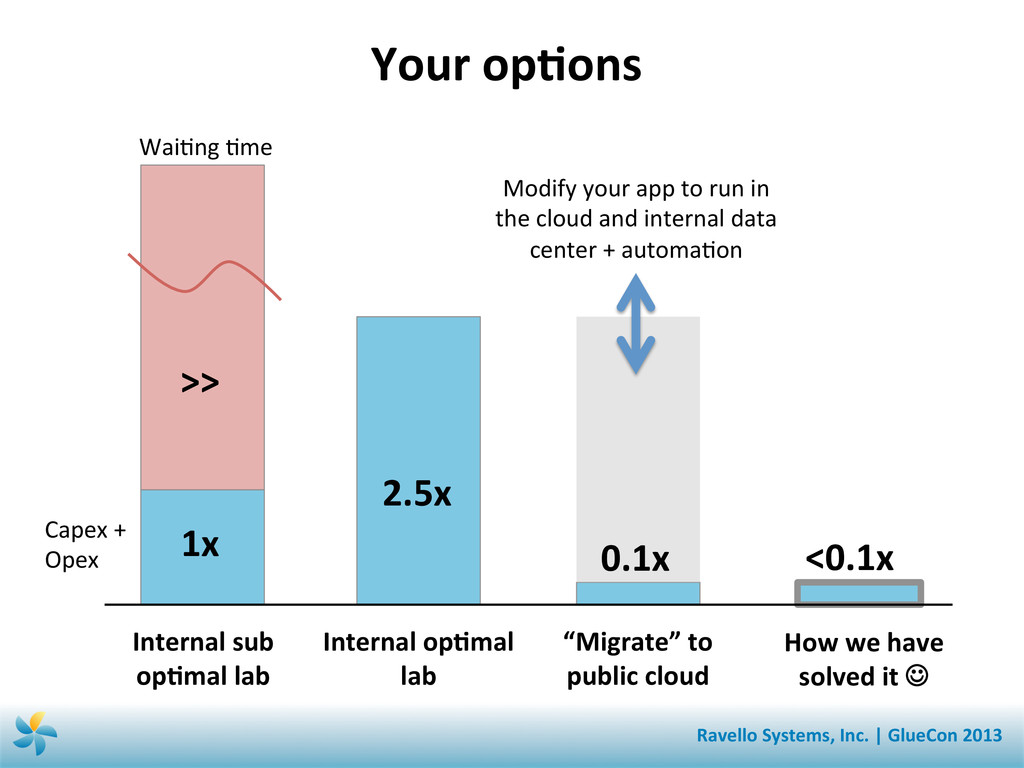
In this analysis, we establish an economic and mathematical (queueing theory) framework to calculate how much it would cost to build the dev/test lab of your dreams. One in which developers don't ever wait for testing resources, and every commit is tested on replicas of the production environment. We then contrast several different options to get there and evaluate all of them from an economic perspective.

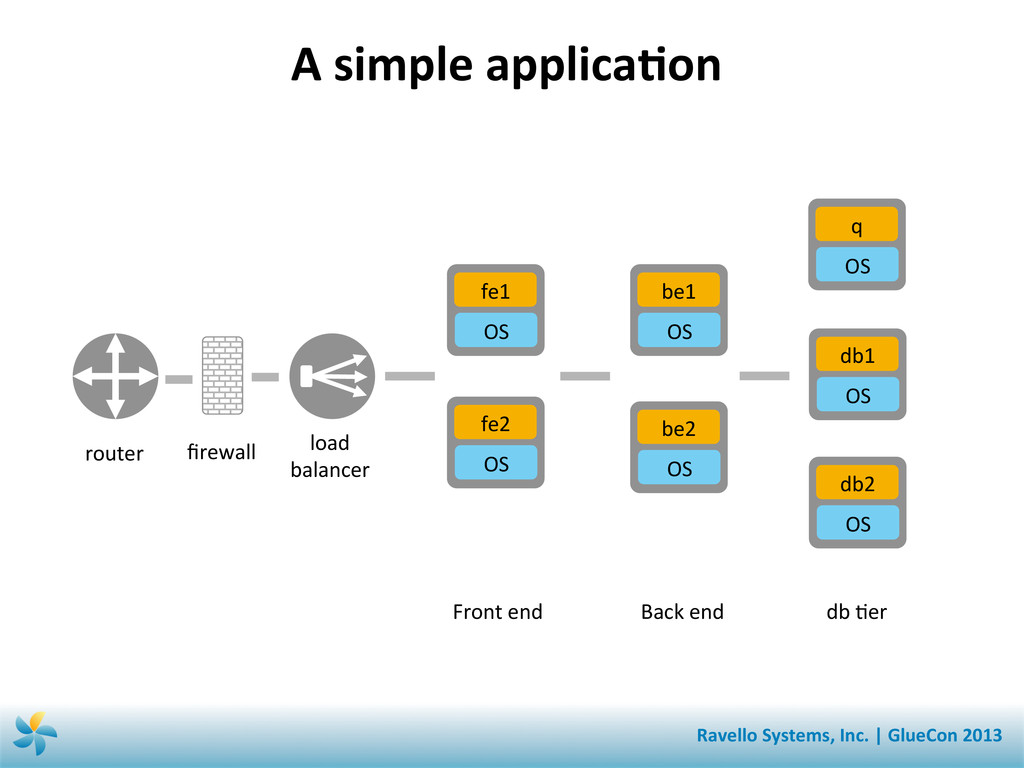
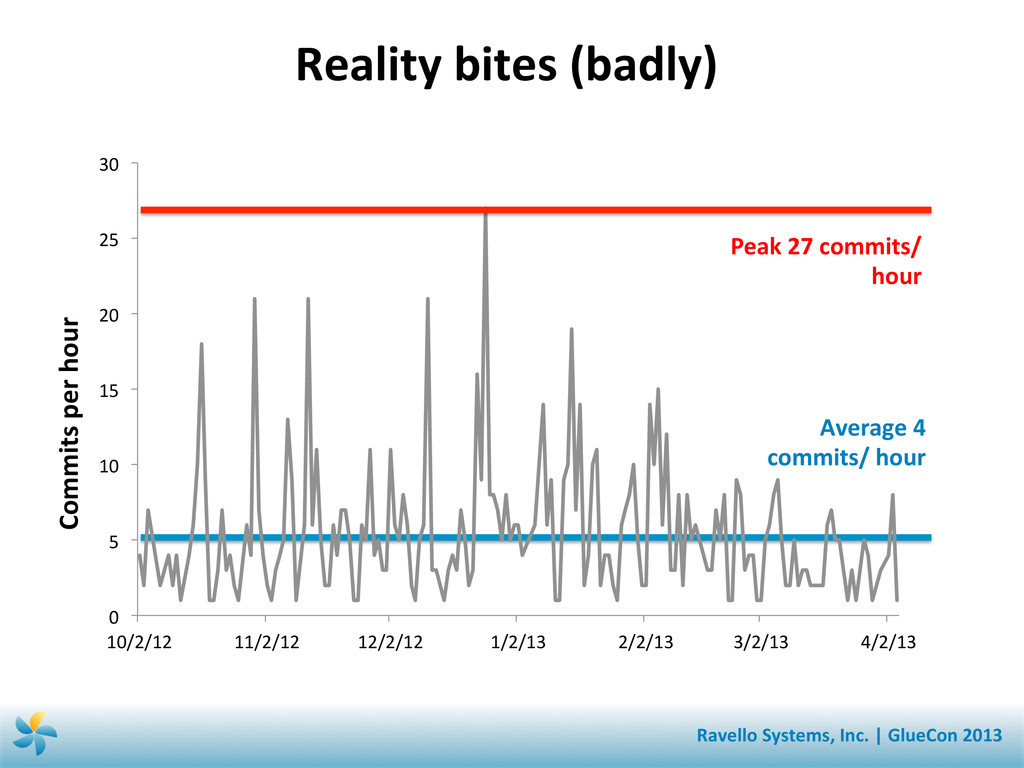
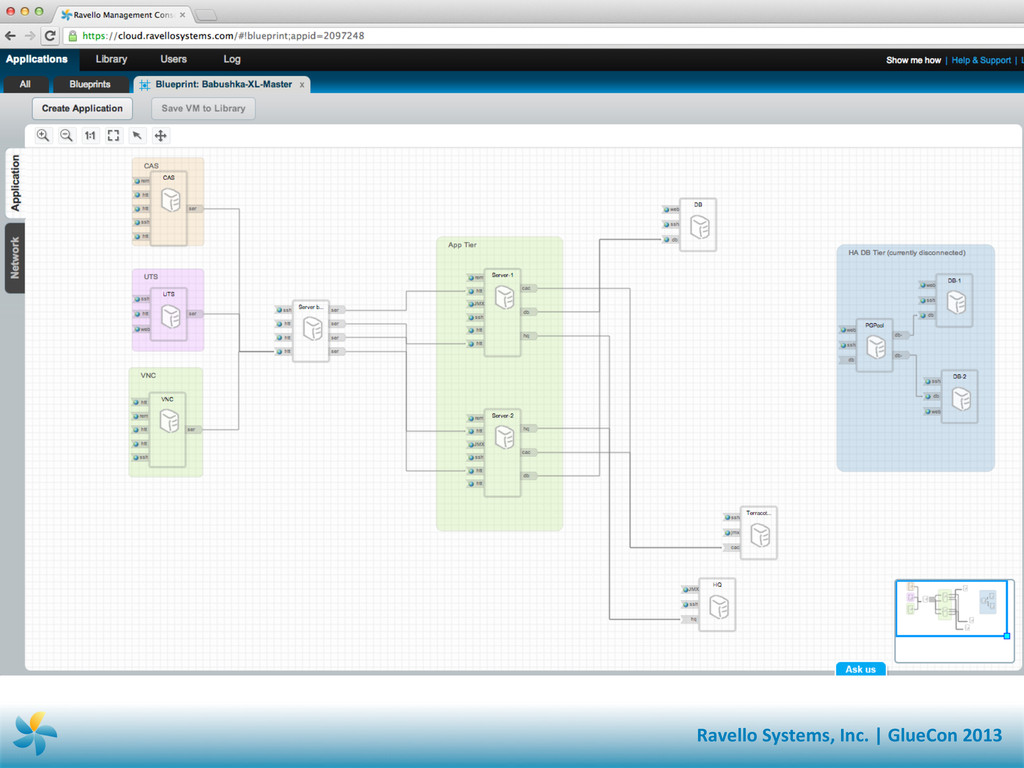
After the presentation, in order to illustrate that this is not only theory, I also gave a quick demonstration of how we at Ravello use our own technology to develop our own application. Each engineer can spin up as many instances of the production replica app as needed on demand for dev/test. We showed how we have integrated Ravello with Jenkins so that on every commit, we spin up the production replica application and run integration tests in parallel.

If you have any questions, feel free to reach out. We are more than happy to discuss how this may be relevant to your development process.

Navin R. Thadani

May 24, 2013
Tweet

Other Decks in Technology

Transcript

  1. The  economic  (in)feasibility  of     on-­‐premise  dev/test   The

     demand  and  supply  mismatch  of   development  and  tes4ng  resources   Navin  R.  Thadani,  @navinthadani   Ravello  Systems,  Inc.     Ravello  Systems,  Inc.  |  GlueCon  2013  
  2. On-­‐premise  development  &  test  sucks   Sprint 1   Sprint

      2   Release   Candidate   Product  late  to   market  and   poor  quality   Data  center/private  cloud  capacity   Project  Demand   Resources   Resources   Sprint 1   Sprint   2   Release   Candidate   Ravello  Systems,  Inc.  |  GlueCon  2013  
  3. #1  Lack  of  internal  capacity   #2  Difficult  to  replicate/

    provision  environments  quickly   Ravello  Systems,  Inc.  |  GlueCon  2013  
  4. A  simple  applicaSon   router   firewall   load  

    balancer   be1   OS   db2   OS   fe2   OS   fe1   OS   be2   OS   db1   OS   Front  end   Back  end   db  4er   q   OS   Ravello  Systems,  Inc.  |  GlueCon  2013  
  5. A  simple  development  process   Unit  test   environments  

    Integra4on  test   environments   System  test   environments   for  every   commit   for  every   commit   batched     Ravello  Systems,  Inc.  |  GlueCon  2013  
  6. Fundamental  quesSon   How  much  capacity  do  you  need  

    to  opSmally  develop  and  test   your  applica4on?     Ravello  Systems,  Inc.  |  GlueCon  2013  
  7. AssumpSon   As  far  as  possible,  you  want  to  

    test  on  replicas  of  the  produc4on   environment   Ravello  Systems,  Inc.  |  GlueCon  2013  
  8. A  queuing  theory  perspecSve   C2   C3   Test

      environments   C6   C7   C8   C1   Arrival  rate  =  λ   commits/hour   C5   Service  rate  =  μ   tests/hour   M-­‐D-­‐s  queue   Average  Sme   spent  in  the   queue   Probability  of   waiSng  more   than  5   minutes   Overall   resource   uSlizaSon   Ravello  Systems,  Inc.  |  GlueCon  2013  
  9. Dev/test  efficiency  fronSer   Number  of  tesSng  environments   Cost

      Cost  of  tes4ng   environments   Cost  of  “wai4ng”   4me   Total  cost   X   TE1   Ravello  Systems,  Inc.  |  GlueCon  2013  
  10. 8  person  development  team     5,000  commits  (in  12

     months)     300,000  lines  of  Java   Ravello  Systems,  Inc.  |  GlueCon  2013  
  11. Some  more  numbers   Unit  tests   Integra4on  tests  

    System  test   environments   λ     4/hr   μ     8/hr   μ     5/hr   Ravello  Systems,  Inc.  |  GlueCon  2013  
  12. Average  wait  Sme   1 2 3 4 5 6

    7 8 9 10 1 2 0 0 0 0 0 0 0 0 0 2 4 0 0 0 0 0 0 0 0 0 3 9 1 0 0 0 0 0 0 0 0 4 24 1 0 0 0 0 0 0 0 0 5 oo 2 0 0 0 0 0 0 0 0 Number  of  integraSon  tesSng  environments   Commit  rate   P 0 =1/ λ µ ( )n n! + λ µ ( )S S! 1 1− λ / Sµ " # $ % & ' n=0 S−1 ∑ ) * + + + + , - . . . . L q = λ / µ ( )S λ / Sµ ( ) S! 1-λ/Sµ ( )2 P 0 W q = L q λ Or  simple  simulaSon    h_ps://github.com/geertj     Dust  off  your  text  books  ;)   Ravello  Systems,  Inc.  |  GlueCon  2013  
  13. Dev/test  efficiency  fronSer  (λ=4/hr)   $0   $50,000   $100,000

      $150,000   $200,000   $250,000   $300,000   $350,000   $400,000   $450,000   $500,000   1   2   3   4   5   6   7   8   9   10   11   12   OpSmal  point   •  2  x  central  UT   •  2  x  IT     •  1  x  ST   •  2  x  manual  QA   Number  of  tes4ng  environments   Cost   Cost  of  “wai4ng”   Capex  +  opex   Total  cost  fron4er   Ravello  Systems,  Inc.  |  GlueCon  2013  
  14. Reality  bites  (badly)   Commits  per  hour   0  

    5   10   15   20   25   30   10/2/12   11/2/12   12/2/12   1/2/13   2/2/13   3/2/13   4/2/13   Average  4   commits/  hour   Peak  27  commits/   hour   Ravello  Systems,  Inc.  |  GlueCon  2013  
  15. Dev/test  efficiency  fronSer   Number  of  tesSng  environments   Cost

      Cost  of  tes4ng   environments   Cost  of   “wai4ng”  4me   For  commit   rate  L1   For  commit   rate  L2   TE1   TE2   X1   X2   Ravello  Systems,  Inc.  |  GlueCon  2013  
  16. Average  wait  Sme   Number  of  integraSon  tesSng  environments  

    1 2 3 4 5 6 7 8 9 10 1 2 0 0 0 0 0 0 0 0 0 2 4 0 0 0 0 0 0 0 0 0 3 9 1 0 0 0 0 0 0 0 0 4 24 1 0 0 0 0 0 0 0 0 5 100 2 0 0 0 0 0 0 0 0 6 100 4 1 0 0 0 0 0 0 0 7 100 6 1 0 0 0 0 0 0 0 8 100 11 1 0 0 0 0 0 0 0 9 100 26 2 0 0 0 0 0 0 0 10 100 100 3 1 0 0 0 0 0 0 11 100 100 4 1 0 0 0 0 0 0 12 100 100 7 1 0 0 0 0 0 0 13 100 100 12 2 0 0 0 0 0 0 14 100 100 26 2 1 0 0 0 0 0 15 100 100 100 3 1 0 0 0 0 0 16 100 100 100 5 1 0 0 0 0 0 17 100 100 100 7 1 0 0 0 0 0 18 100 100 100 12 2 1 0 0 0 0 19 100 100 100 27 3 1 0 0 0 0 20 100 100 100 100 3 1 0 0 0 0 21 100 100 100 100 5 1 0 0 0 0 22 100 100 100 100 7 2 1 0 0 0 23 100 100 100 100 13 2 1 0 0 0 24 100 100 100 100 26 3 1 0 0 0 25 100 100 100 100 100 4 1 0 0 0 26 100 100 100 100 100 5 1 0 0 0 27 100 100 100 100 100 8 2 1 0 0 28 100 100 100 100 100 13 2 1 0 0 29 100 100 100 100 100 28 3 1 0 0 30 100 100 100 100 100 100 4 1 0 0 Commit  rate   Ravello  Systems,  Inc.  |  GlueCon  2013  
  17. Dev/test  efficiency  fronSer  (λ=27/hr)   $0   $50,000   $100,000

      $150,000   $200,000   $250,000   $300,000   $350,000   $400,000   $450,000   $500,000   1   2   3   4   5   6   7   8   9   10   11   12   OpSmal  point   •  5  x  central  UT   •  8  x  IT     •  1  x  ST   •  3  x  manual  QA   Number  of  tes4ng  environments   Cost   Cost  of  “wai4ng”   Capex  +     Opex   Total  cost  fron4er   Ravello  Systems,  Inc.  |  GlueCon  2013  
  18. $100K  –  substandard  lab   WaiSng,  inefficiency,  resource   contenSon

     …     $250K  –  good  lab  service   Efficient  development   Hidden  cost  >>$1m  (inefficiency)   Average  uSlizaSon  (<5%)   Ravello  Systems,  Inc.  |  GlueCon  2013  
  19. A  new  fronSer?     $0   $50,000   $100,000

      $150,000   $200,000   $250,000   $300,000   $350,000   $400,000   $450,000   $500,000   1   2   3   4   5   6   7   8   9   10   11   12   Public  Cloud   25x  lower   cost   Internal  data   center   Number  of  tes4ng  environments   Ravello  Systems,  Inc.  |  GlueCon  2013  
  20. Reality  check   $0   $50,000   $100,000   $150,000

      $200,000   $250,000   $300,000   $350,000   $400,000   $450,000   $500,000   1   2   3   4   5   6   7   8   9   10   11   12   Change  applicaSon  to  run  on-­‐premise  (producSon)   and  cloud  (development  and  test)     ?   Public  Cloud   Internal  data   center   Number  of  tes4ng  environments   Ravello  Systems,  Inc.  |  GlueCon  2013  
  21. Your  opSons   1x   >>   2.5x   0.1x

      <0.1x   Wai4ng  4me   Capex  +   Opex   Modify  your  app  to  run  in   the  cloud  and  internal  data   center  +  automa4on     Internal  sub   opSmal  lab   Internal  opSmal   lab   “Migrate”  to   public  cloud   How  we  have   solved  it       Ravello  Systems,  Inc.  |  GlueCon  2013