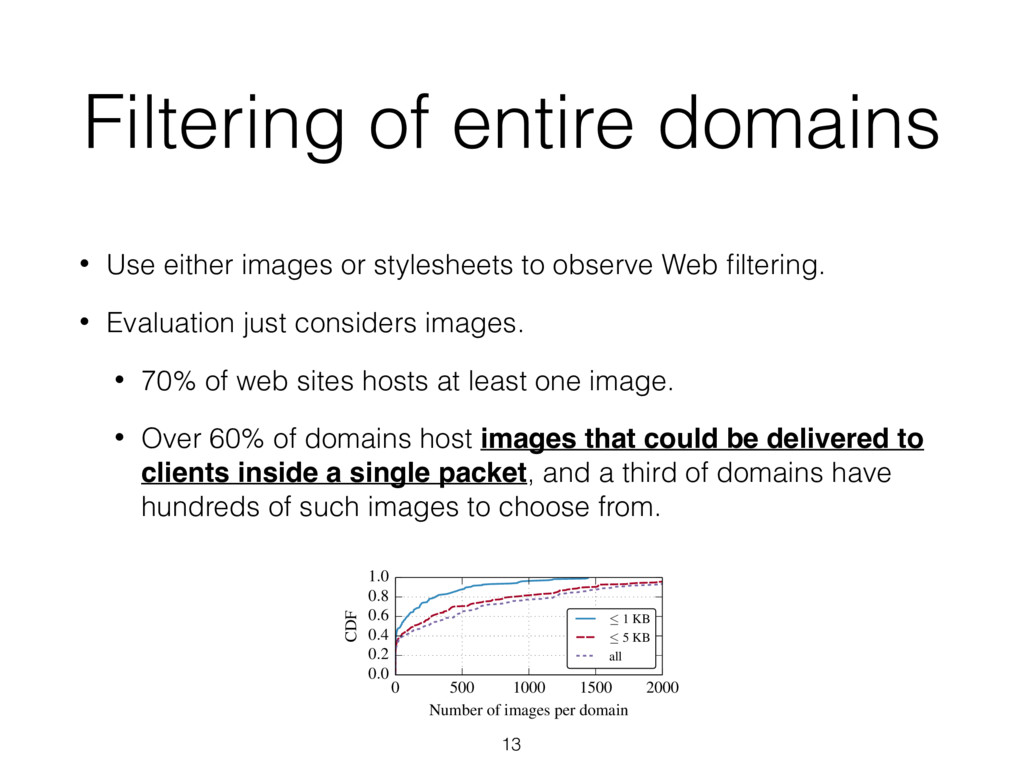
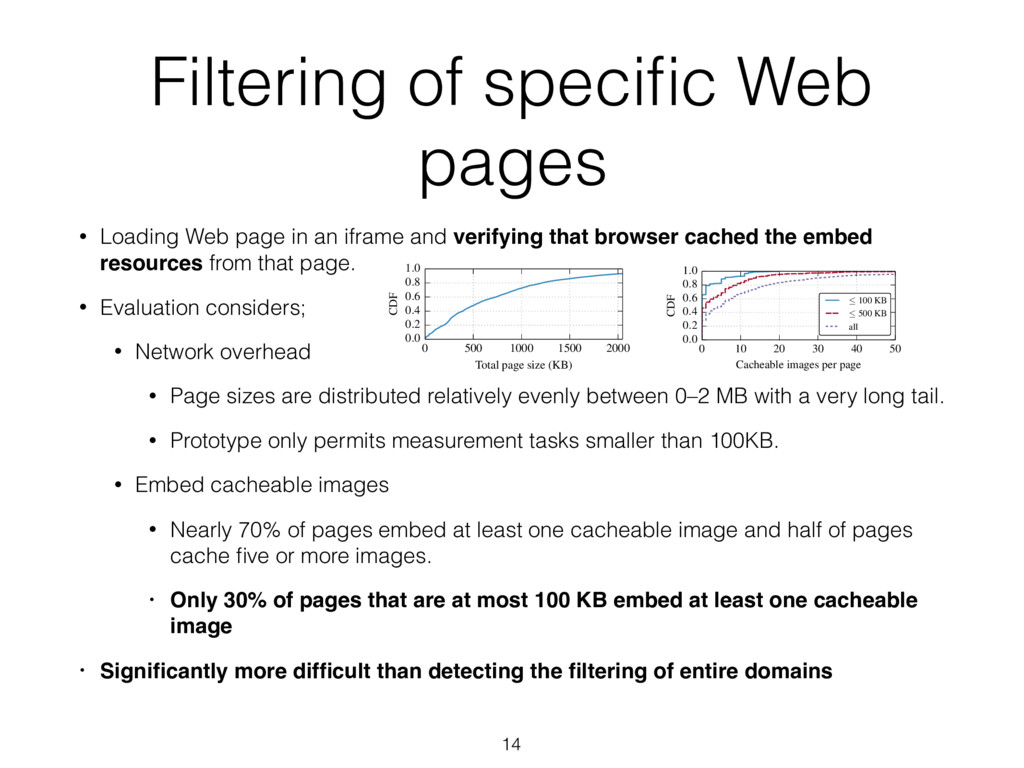
an iframe and verifying that browser cached the embed resources from that page. • Evaluation considers; • Network overhead • Page sizes are distributed relatively evenly between 0–2 MB with a very long tail. • Prototype only permits measurement tasks smaller than 100KB. • Embed cacheable images • Nearly 70% of pages embed at least one cacheable image and half of pages cache five or more images. • Only 30% of pages that are at most 100 KB embed at least one cacheable image • Significantly more difficult than detecting the filtering of entire domains Figure 4: Distribution of the number of images hosted by each of the 178 domains tested, for images that are at most 1 KB, at most 5 KB, and any size. Over 60% of domains host images that could be delivered to clients inside a single packet, and a third of domains have hundreds of such images to choose from. we generated as described above. Recall from Section 4.3 that we can use either images or style sheets to observe Web filtering of an entire domain; for simplicity, this analysis only considers images, although style sheets work similarly. We can measure a domain using this technique if (1) it contains images that can be embedded by an origin site and (2) those images are small enough not to significantly affect user ex- perience. We explore both of these requirements for the 178 domains in our list. Because our implementation expands URL patterns using the top 50 search results for that pattern, we will be analyzing a sample of at most 50 URLs per do- main. Most of these domains have more than 50 pages, so our results are a lower bound of the amenability of Encore to collect censorship measurements from each domain. Figure 4 plots the distribution of the number of images that each domain hosts. 70% of domains embed at least one image, and almost all such images are less than 5 KB. Nearly as many domains embed images that fit within a single packet, and a third of domains have hundreds of such images. Even if 0 500 1000 1500 2000 Total page size (KB) 0.0 0.2 0.4 0.6 0.8 1.0 CDF Figure 5: Distribution of page sizes, computed as the sum of sizes of all objects loaded by a page. This indicates the network overhead each page would incur if a measurement task loaded it in a hidden iframe. Over half of pages load at least half a megabyte of objects. Figure 6: Distribution of the number of cacheable images loaded by pages that require at most 100 KB of traffic to load, pages that incur at most 500 KB of traffic, and all pages. Perhaps unsurprisingly, smaller pages contain fewer (cacheable) images. Over 70% of all pages cache at least one image and half of all pages cache five or more images; these numbers drop considerably when excluding pages greater than 100 KB. 100 KB, although future implementations might tune this bound to a client’s performance and preferences. We then evaluate whether these sites embed content that Figure 4: Distribution of the number of images hosted by each of the 178 domains tested, for images that are at most 1 KB, at most 5 KB, and any size. Over 60% of domains host images that could be delivered to clients inside a single packet, and a third of domains have hundreds of such images to choose from. we generated as described above. Recall from Section 4.3 that we can use either images or style sheets to observe Web filtering of an entire domain; for simplicity, this analysis only considers images, although style sheets work similarly. We can measure a domain using this technique if (1) it contains images that can be embedded by an origin site and (2) those images are small enough not to significantly affect user ex- perience. We explore both of these requirements for the 178 domains in our list. Because our implementation expands URL patterns using the top 50 search results for that pattern, we will be analyzing a sample of at most 50 URLs per do- main. Most of these domains have more than 50 pages, so our results are a lower bound of the amenability of Encore to collect censorship measurements from each domain. Figure 4 plots the distribution of the number of images that each domain hosts. 70% of domains embed at least one image, and almost all such images are less than 5 KB. Nearly as many domains embed images that fit within a single packet, and a third of domains have hundreds of such images. Even if we conservatively restrict measurement tasks to load images less than 1 KB, Encore can measure Web filtering of over half of the domains. Filtering of specific Web pages. We explore how often En- core can measure filtering of individual URLs by loading a Web page in an iframe and verifying that the browser cached embedded resources from that page. We can use this mech- anism to measure filtering of pages that (1) do not incur too much network overhead when loading in a hidden iframe and (2) embed cacheable images. We first study the expected network overhead from loading sites in an iframe. Figure 5 plots the distribution of page sizes for each URL, where the page size is the sum of sizes of all resources a page loads and is a rough lower bound on the net- work overhead that would be incurred by loading each page Figure 5: Distribution of page sizes, computed as the sum of sizes of all objects loaded by a page. This indicates the network overhead each page would incur if a measurement task loaded it in a hidden iframe. Over half of pages load at least half a megabyte of objects. 0 10 20 30 40 50 Cacheable images per page 0.0 0.2 0.4 0.6 0.8 1.0 CDF 100 KB 500 KB all Figure 6: Distribution of the number of cacheable images loaded by pages that require at most 100 KB of traffic to load, pages that incur at most 500 KB of traffic, and all pages. Perhaps unsurprisingly, smaller pages contain fewer (cacheable) images. Over 70% of all pages cache at least one image and half of all pages cache five or more images; these numbers drop considerably when excluding pages greater than 100 KB. 100 KB, although future implementations might tune this bound to a client’s performance and preferences. We then evaluate whether these sites embed content that can be retrieved with cross-origin requests. Figure 6 shows the distribution of the number of cacheable images per URL for pages that are at most 100 KB, at most 500 KB, and any size. Nearly 70% of pages embed at least one cacheable image and half of pages cache five or more images, but these numbers drop significantly when restricting page sizes. Only 30% of pages that are at most 100 KB embed at least one cacheable image. Encore can measure filtering of upwards of 50% of do- mains depending on the sizes of images, but fewer than 10% of URLs when we limit pages to 100 KB. This finding sup- ports our earlier observation in Section 4.3 that detecting the filtering of individual Web resources may be significantly more difficult than detecting the filtering of entire domains. 6.2 Who performs Encore measurements? 14
![Measurement [cont.] • Prior to measurement, the authors built a](https://files.speakerdeck.com/presentations/37846d1e96fd4b0f95d422d85234cc25/slide_16.jpg)
![Measurement [cont.] • Use 70% of clients to test on](https://files.speakerdeck.com/presentations/37846d1e96fd4b0f95d422d85234cc25/slide_17.jpg)