Upgrade to Pro — share decks privately, control downloads, hide ads and more …

The role of the diffuse ionized gas in metallicity calibrations

The role of the diffuse ionized gas in metallicity calibrations

Talk at III Workshop – Chemical abundances in gaseous nebulae: from the Milky Way to the early Universe

Natalia Vale Asari

May 24, 2021
Tweet

More Decks by Natalia Vale Asari

Other Decks in Science

Transcript

  1. The role of the diffuse ionized gas (DIG) in metallicity

    calibrations 2 1 0 1 8.5 8.6 8.7 12 + logO⇥HN log M ⇥.⇤⇤ ⇥.⌅⇤ ⇥.⇧⇤ ⇥.⇥⇤ ⌃⇤. ⇤ ⌃⇤.⌥⇤ ⌃⇤. ⇤ ⌃⌃.⌃⇤ ⌃⌃. ⇤ (a) No correction 2 1 0 1 log SFR [M yr⇥1] (b) O/H – DIG removed 2 1 0 (c) O/H & SFR – DIG re Natalia Vale Asari (UFSC, Florianópolis, Brazil) Royal Society–Newton Advanced Fellowship
  2. Tremonti et al. (2004) Lequeux et al. (1979) log M

    12 + log O/H log M Z §1 Galaxy evolution from integrated spectra The Ṃ –Zneb relation in SDSS
  3. was the ity. The same systematic dependence of metallicity on

    SFR can be seen in the right-hand panel of Fig. 1, where metallicity is plotted as a function of SFR for different values of mass. Galaxies with high S galaxies. The grey-shaded areas contain 64 and 90 per cent of all SDSS galaxies, with show the median metallicities, as a function of M⋆ , of SDSS galaxies with different SFR for galaxies of different M⋆ . At all M⋆ with log(M⋆ ) < 10.7, metallicity decreases Problems with M–Z–SFR General: - Sample selection - Aperture effects SFR: - Dust correction - Proxy/calibration - DIG contamination Z: - Method/indices/calibration - DIG contamination Mannucci et al. (2010); see also Ellison et al. (2008), Lara-Lopez et al. (2010)
  4. Where the DIG’s at • Extraplanar • Interarm • In

    bulges (late- and early-type galaxies) Zurita et al. (2000) Hα map, H II regions subtracted Characterizing the DIG • Higher electron temperature • Lower electron density • Enhanced [N II]/Hα, [S II]/Hα, and usually [O III]/Hβ TYPHOON Poetrodjojo+ (2019 30 to 60% of total Hα may be due to the DIG according to Zurita+ 2000, Oey + 2007
  5. What ionizes the DIG? • Cosmic rays
 (Reynolds & Cox

    1992) • Shocks from supernova winds
 (Dopita & Sutherland 1995, Allen et al. 2008) • Turbulent dissipation 
 (Binette+ 2009) • Leakage of photons from SF regions 
 (Weilbacher+ 2018) • Photoionization by hot low-mass evolved stars (HOLMES)
 (Stasińska+ 2008, Flores-Fajardo+ 2011) HOLMES
  6. Stasińska et al. (2008, 2015); Cid Fernandes et al. (2010,

    2011); Herpich et al. (2016, 2018) §2 HOLMES (e.g. post-AGBs, white dwarves) may produce LINER-like emission lines. Binette et al. (1994)
  7. Cid Fernandes et al. (2011) Total observed L(Hα) / Expected

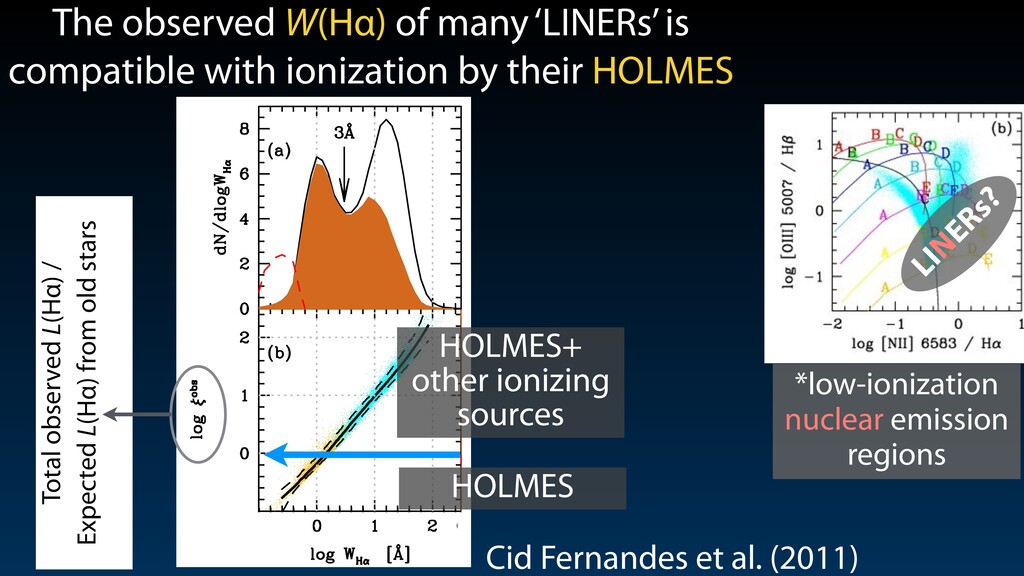
    L(Hα) from old stars The observed W(Hα) of many ‘LINERs’ is compatible with ionization by their HOLMES definition: RGs are ELGs with WHα < 3 Å. For WHα < 3 Å, the central black hole may well be active ( accreting), but its ionizing photon output is comparable to or wea than that produced by HOLMES. For Wold Hα values between 1 2 Å, which are compatible with current models (bottom panel Fig. 2), one finds that at our proposed WHα = 3 Å borderline AGN contributes between ∼1/3 and 2/3 of the ionizing pow Naturally, this fraction decreases even more as WHα decreases the point that AGN contribution is negligible for the bulk of the WHα population. It is therefore not correct to use the emission li of WHα < 3 Å systems to infer AGN properties. 5 A COMPREHENSIVE CLASSIFICATION OF GALAXIES We are now able to separate fake AGN (= RGs) from true AG In the LINER zone of Fig. 1, true AGN are defined by 3 < WHα 6 Å. To avoid confusion, we shall call these sources ‘wAGN’ the interest of a consistent notation, we shall also rename Seyf as ‘sAGN’. Finally, we remove from the SF category those galax consistent with a RG classification, that is to say those having WH 3 Å. Our final classification scheme is shown in Fig. 6. Sample sources split into percentage fractions of 22, 21, 8, 31 and 18 sAGN, wAGN, RG and PG, respectively. RGs therefore exis large numbers in the SDSS, in agreement with the basic predict that such systems are bound to exits as a mere consequence of ste evolution. AGN, on the other hand, are far less common than would infer associating all LINERs to non-stellar activity. 1694 R. Cid Fernandes et al. done for the ξ distribution, but it is clearly advantageous to d this boundary on the basis of a universally available and mo independent quantity: WHα . We conducted various experiments to define an optimal bound to separate the two peaks, all giving results between 3 and 4 Å. settled for WHα = 3 Å. We thus propose to the following pract definition: RGs are ELGs with WHα < 3 Å. For WHα < 3 Å, the central black hole may well be active accreting), but its ionizing photon output is comparable to or wea than that produced by HOLMES. For Wold Hα values between 1 2 Å, which are compatible with current models (bottom panel Fig. 2), one finds that at our proposed WHα = 3 Å borderline AGN contributes between ∼1/3 and 2/3 of the ionizing pow Naturally, this fraction decreases even more as WHα decreases the point that AGN contribution is negligible for the bulk of the WHα population. It is therefore not correct to use the emission li of WHα < 3 Å systems to infer AGN properties. 5 A COMPREHENSIVE CLASSIFICATION OF GALAXIES We are now able to separate fake AGN (= RGs) from true AG In the LINER zone of Fig. 1, true AGN are defined by 3 < WH 6 Å. To avoid confusion, we shall call these sources ‘wAGN’ the interest of a consistent notation, we shall also rename Seyf HOLMES HOLMES+ other ionizing sources LINERs? *low-ionization nuclear emission regions
  8. §3 Digging out the DIG* A&A 588, A68 (2016) A&A

    588, A68 (2016) Gomes+ 2016 (CALIFA) See also Sarzi+ 2010 (SAURON); Belfiore+ 2016 (MaNGA), …
  9. bitbucket.org/streeto/pycasso2 Python Cube Analysis and STARLIGHT Synthesis Organizer UFSC ‘IFS’

    team Dr Ariel Werle PhD student (now post-doc @ Padua) Dr André L. de Amorim post-doc→staff DOBBY is a free ELF (emission line fitter) Thomas Florido MSc student (now in São Paulo) Dr Guilherme Couto post-doc (now @Chile) Roberto Cid Fernandes staff Grażyna Stasińska Observatoire de Paris (frequent visitor @ UFSC) Dr Daniel Ruschel Dutra post-doc→staff
  10. WH! is a good tracer of DIG contribution et al.

    CALIFA: Calar Alto Legacy Integral Field Area Survey 667 galaxies, 0.8 kpc resolution DR3: Sanchéz et al. (2016) Lacerda et al. (2018)
  11. Lacerda et al. (2018) – CALIFA Figure 8. BPT diagrams

    for our sample. The left-hand panel shows the full sample, with colours coding for WH α , as indicated into SFc (WH α > 14 Å), mDIG (WH α = 3–14 Å), and hDIG (WH α < 3 Å) regions, colouring points according to their radial all cases, only zones with SN > 3 in all lines are plotted. Dividing curves come from (from left to right) Stasi´ nska et al. (2006 , K03), and Kewley et al. (2001, K01). Figure 9. BPT diagram for mDIG regions only (i.e. those with WH α in the 3–14 Å range), coloured according to W , and excluding zones inwards et al. 2014). Other WH α > 3 Å outlie dominated by hDIG zones also tend to be points in the central panels of Fig. 8). AGN may also power line emission w to distances as large as 20 kpc; Veilleu the so-called extended emission-line reg cones. They can be due either to photoio leaving the AGN with a small opening between radio jets and the galaxy ISM (Wilson 1996 ). However, in the frame which is to evaluate the importance o pinpoint its different regimes, EELRs in ondary issue, as they affect only specifi well-defined AGN – and perhaps not a the EELRs is a topic in itself, which i sensitive 3D spectroscopy, and some re doing so (e.g. Dopita et al. 2014), but it present paper. Another line-producing process negle In the case of the galactic wind in CAL we find WH α = 3–12 Å in the shock values. Again, WH α by itself cannot id DIG emission has different line ratios [N II]/H!, [O III]/H! are larger for DIG emission. low W(Hα) high W(Hα) DIG SFc
  12. 0 1 2 log Wobs H [˚ A] 0.0 L

    [ 0 1 2 log Wobs H [˚ A] 0.0 0.0 LS [ 0 1 2 log Wobs H [˚ A] 0.0 0.5 1.0 LSFc H Lobs H (d) 0 1 2 log Wobs H [˚ A] 0.0 0.5 1.0 LSFc [N ⇥⇥] Lobs [N ⇥⇥] (e) 0.0 0.5 1.0 LSFc [S ⇥⇥] Lobs [S ⇥⇥] Removing DIG contribution to line fluxes Z calibrations = valid for H II regions DIG- dominated SF- dominated 1409 MaNGA SF galaxies DIG- dominated SF- dominated Vale Asari et al. (2019)
  13. 2 1 0 1 8.5 8.6 8.7 12 + logO⇥HN

    log M ⇥.⇤⇤ ⇥.⌅⇤ ⇥.⇧⇤ ⇥.⇥⇤ ⌃⇤. ⇤ ⌃⇤.⌥⇤ ⌃⇤. ⇤ ⌃⌃.⌃⇤ ⌃⌃. ⇤ (a) No correction 2 1 0 1 log SFR [M yr⇥1] (b) O/H – DIG removed 2 1 0 1 (c) O/H & SFR – DIG removed Removing DIG emission for ~100k SDSS galaxies MaNGA prescription Vale Asari et al. (2019) 0 1 2 log Wobs H [˚ A] 0.0 0.5 1.0 LSFc [O ⇥⇥] Lobs [O ⇥⇥] (a) 0 1 2 log Wobs H [˚ A] 0.0 0.5 1.0 LSFc H⇥ Lobs H⇥ (b) R R 50 = 0.70 0 1 2 log Wobs H [˚ A] 0.0 0.5 1.0 LSFc H Lobs H (d) 0 1 2 log Wobs H [˚ A] 0.0 0.5 1.0 LSFc [N ⇥⇥] Lobs [N ⇥⇥] (e)
  14. Vale Asari et al. (2019) DIG effects on O/H estimates

    in SF galaxies 4729 Downloaded from https://academic.oup.com/mnras/article-abstrac Figure 5. Each panel shows O/H as a function of SFR in 0.30 dex-wide stellar mass bins for a sample of 94 335 SF galaxies from th (a) shows the log M centre values for each bin, and also the colour-coding for each median curve. Rows show results for the four differ discussed in Section 5.2. The column of panels on the right shows the observed relation (dashed lines); the middle corrects the emissi DIG effects on O/H estimates in SF gal nel shows O/H as a function of SFR in 0.30 dex-wide stellar mass bins for a sample of 94 335 SF galaxies from the SDSS DR7. Panel centre values for each bin, and also the colour-coding for each median curve. Rows show results for the four different O/H calibrations n 5.2. The column of panels on the right shows the observed relation (dashed lines); the middle corrects the emission lines for the O/H ed from https://academic.oup.com/mnras/article-abstract/489/4/4721/5561494 by St Andrews University Library user on DIG contaminates the M–Z–SFR relation – also SFR & other Z callibrations
  15. DIG contaminates the M–Z–SFR relation — and with higher spatial

    resolution (~MUSE*) the effect could be even larger! 2 1 0 1 8.5 8.6 8.7 12 + logO⇥HN log M ⇥.⇤⇤ ⇥.⌅⇤ ⇥.⇧⇤ ⇥.⇥⇤ ⌃⇤. ⇤ ⌃⇤.⌥⇤ ⌃⇤. ⇤ ⌃⌃.⌃⇤ ⌃⌃. ⇤ (a) No correction 2 1 0 1 log SFR [M yr⇥1] (b) O/H – DIG removed 2 1 0 1 (c) O/H & SFR – DIG removed Vale Asari et al. (2019) [email protected] Katia Slodkowski Clerici MSc student Applying for PhD positions! Go and see her poster! :-) *DIG/MUSE Janayna Mendes undergrad student
  16. Thanks to III Workshop Chemical abundances in gaseous nebulae: from

    the Milky Way to the early Universe 24–28 May, 2021 Online events hosted by Univap, São do José dos Campos, SP, Brazil