extended sources Sample selection: ROGUE I (Kozieł-Wierzbowska et al. 2020 ApJS) No. There are ~5 times more compact than extended radio sources Do all compact radio sources become extended? Natalia Vale Asari UFSC, Brazil / Royal Society– Newton Advanced Fellowship
[email protected] Dorota Kozieł-Wierzbowska Jagiellonian University, Poland Grażyna Stasińska Observatoire de Paris, France Marek Sikora Nicolaus Copernicus Astronomical Center, Poland The authors thank: The evolution of radio emission by a central engine and its impact on galaxy evolution are still
debatable. It has been found that there are many more galaxies with compact radio emission (i.e. within its optical half-light radius) than hosting extended jets. We have used the state-of-the-art ROGUE I catalogue (Kozieł-Wierzbowska et al. 2020) of galaxies with radio cores to investigate whether all compact radio sources may become extended (the so-called youth scenario), or if most of them will stop emitting in radio before becoming extended (the frustration scenario; see e.g. Fanti et al. 1995, A&A, 302, 31). Using a set of toy models, we find that only ~2–4% of compact
become extended radio sources, and that their black hole masses increase by ~10% in this process. These results can help quantify the impact of radio jets on fuelling and/or quenching of star
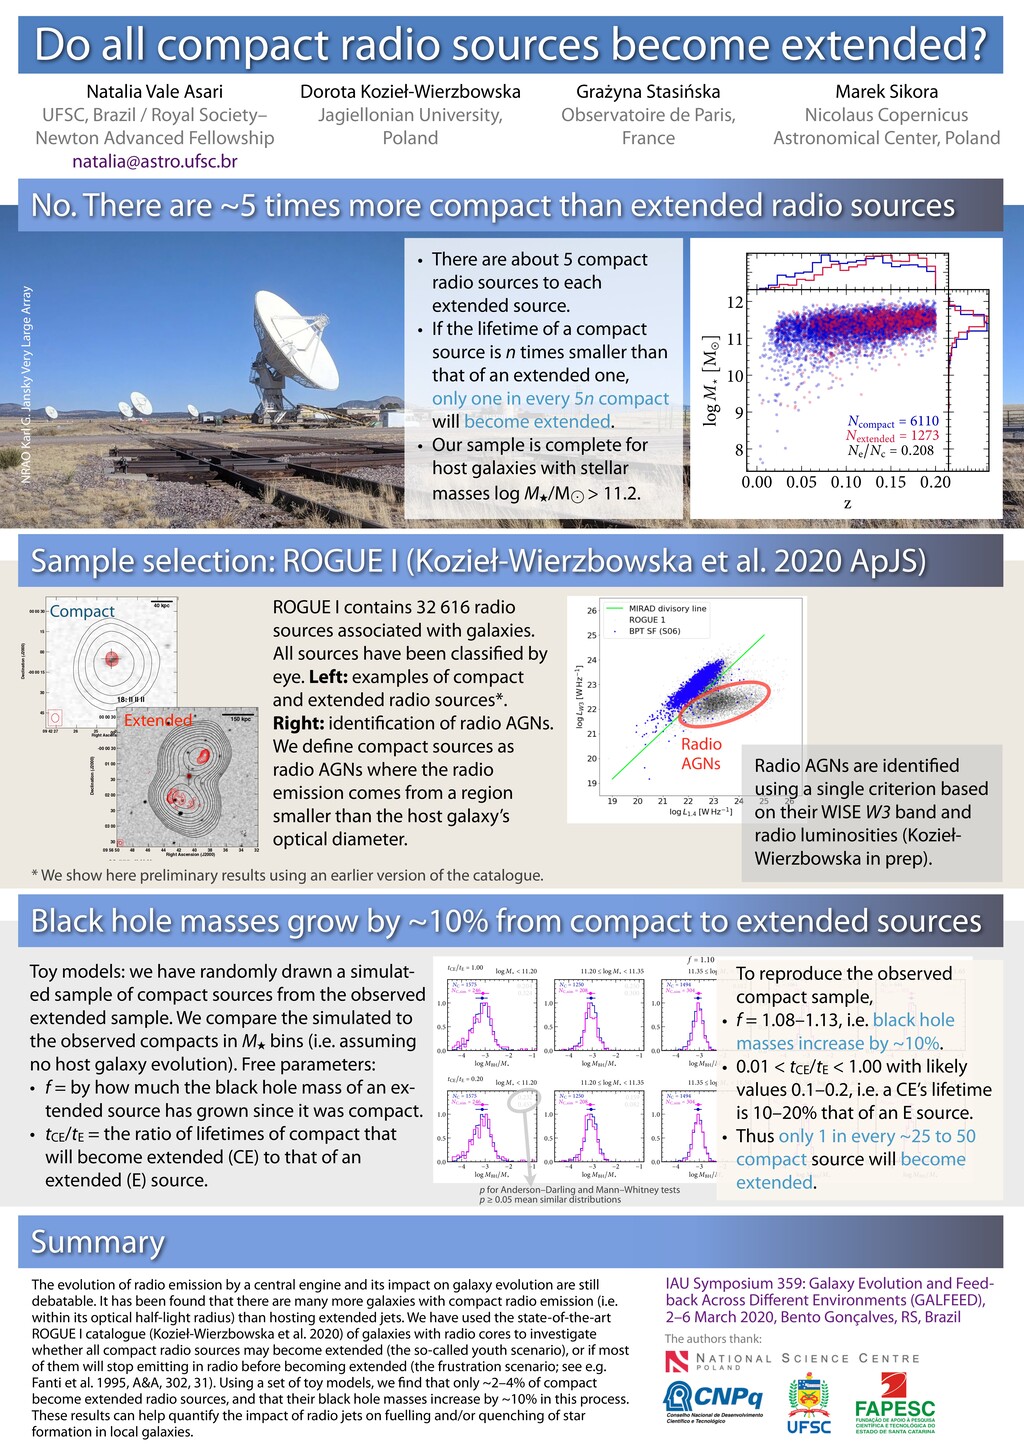
formation in local galaxies. NRAO Karl G. Jansky Very Large Array IAU Symposium 359: Galaxy Evolution and Feed- back Across Different Environments (GALFEED), 2–6 March 2020, Bento Gonçalves, RS, Brazil 0.00 0.05 0.10 0.15 0.20 z 0 1 2 3 4 log F 1.4 [WHz 1 m 2] N compact = 6110 N extended = 1273 N e ⇥N c = 0.208 0.00 0.05 0.10 0.15 0.20 z 0 1 2 3 log Fcore 1.4 [WHz 1 m 2] N compact = 6110 N extended = 1273 N e ⇥N c = 0.208 0.00 0.05 0.10 0.15 0.20 z 8 9 10 11 12 log M ⇤ [M⌅ ] N compact = 6110 N extended = 1273 N e ⇥N c = 0.208 4 3 2 1 log M BH ⇥M 0.0 0.5 1.0 N C = 1575 N C,sim = 246 .⇥ ⇤ .⌅⇥⇤ log M < 11.20 t CE ⇥t E = 1.00 4 3 2 1 log M BH ⇥M 0.0 0.5 1.0 N C = 1250 N C,sim = 208 .⇥⇧ .⌅ 11.20 ⇤ log M < 11.35 4 3 2 1 log M BH ⇥M 0.0 0.5 1.0 N C = 1494 N C,sim = 304 . ⌃⇥ . ⌃ 11.35 ⇤ log M < 11.50 4 3 2 1 log M BH ⇥M 0.0 0.5 1.0 N C = 1061 N C,sim = 294 .⇥⇧ .⇥⌅⌥ 11.50 ⇤ log M < 11.65 4 3 2 1 log M BH ⇥M 0.0 0.5 1.0 N C = 644 N C,sim = 203 .⌃⇧⇤ . log M ⌅ 11.65 4 3 2 1 log M BH ⇥M 0.0 0.5 1.0 N C = 1575 N C,sim = 246 .⇥⌅⇥ .⇤⇧⌅ log M < 11.20 t CE ⇥t E = 0.20 4 3 2 1 log M BH ⇥M 0.0 0.5 1.0 N C = 1250 N C,sim = 208 .⌃⇧⌥ . ⇥ 11.20 ⇤ log M < 11.35 4 3 2 1 log M BH ⇥M 0.0 0.5 1.0 N C = 1494 N C,sim = 304 .⌃⇥ .⌃⌅ 11.35 ⇤ log M < 11.50 4 3 2 1 log M BH ⇥M 0.0 0.5 1.0 N C = 1061 N C,sim = 294 .⇥⇧ .⇥ ⌥ 11.50 ⇤ log M < 11.65 4 3 2 1 log M BH ⇥M 0.0 0.5 1.0 N C = 644 N C,sim = 203 .⇥⇧ .⌅⇥ log M ⌅ 11.65 4 3 2 1 log M BH ⇥M 0.0 0.5 1.0 N C = 1575 N C,sim = 246 .⇥⌅ .⇤⇥ log M < 11.20 t CE ⇥t E = 0.10 4 3 2 1 log M BH ⇥M 0.0 0.5 1.0 N C = 1250 N C,sim = 208 .⌃⌃⌥ . ⌦⇧ 11.20 ⇤ log M < 11.35 4 3 2 1 log M BH ⇥M 0.0 0.5 1.0 N C = 1494 N C,sim = 304 .⌃⇤ .⌃⌦⇧ 11.35 ⇤ log M < 11.50 4 3 2 1 log M BH ⇥M 0.0 0.5 1.0 N C = 1061 N C,sim = 294 .⇥⇧ .⇥⇧⌅ 11.50 ⇤ log M < 11.65 4 3 2 1 log M BH ⇥M 0.0 0.5 1.0 N C = 644 N C,sim = 203 .⇥⇧ .⌅ ⇥ log M ⌅ 11.65 4 3 2 1 log M BH ⇥M 0.0 0.5 1.0 N C = 1575 N C,sim = 246 .⇥⇤⇥ .⌅⌥⌃ log M < 11.20 t CE ⇥t E = 0.01 4 3 2 1 log M BH ⇥M 0.0 0.5 1.0 N C = 1250 N C,sim = 208 .⌃ ⇧ . ⇧ 11.20 ⇤ log M < 11.35 4 3 2 1 log M BH ⇥M 0.0 0.5 1.0 N C = 1494 N C,sim = 304 .⌃⌦⇧ .⇥ ⌦ 11.35 ⇤ log M < 11.50 4 3 2 1 log M BH ⇥M 0.0 0.5 1.0 N C = 1061 N C,sim = 294 .⇥⇧ .⇥ 11.50 ⇤ log M < 11.65 4 3 2 1 log M BH ⇥M 0.0 0.5 1.0 N C = 644 N C,sim = 203 .⇥⇧ .⇤ ⌥ log M ⌅ 11.65 f = 1.10 10 Kozie l-Wierzbowska et al. 8: C C C Declination (J2000) Right Ascension (J2000) 09 42 27 26 25 24 23 22 21 00 00 30 15 00 -00 00 15 30 45 40 kpc 5,897: OI E OI Declination (J2000) Right Ascension (J2000) 02 04 12 10 08 06 04 02 -09 15 00 30 16 00 30 17 00 30 105 kpc 15,129: I I I Declination (J2000) Right Ascension (J2000) 15 47 30 25 20 15 10 05 00 46 55 50 35 43 42 41 40 39 38 37 36 35 180 kpc X X 18: II II II Declination (J2000) Right Ascension (J2000) 09 56 50 48 46 44 42 40 38 36 34 32 00 00 30 00 -00 00 30 01 00 30 02 00 30 03 00 30 150 kpc 25,220: OII I/II I/II Declination (J2000) Right Ascension (J2000) 15 14 10 05 00 13 55 50 45 40 35 24 17 16 15 14 13 12 11 10 09 08 160 kpc X 12,544: Z Z Z Declination (J2000) Right Ascension (J2000) 08 39 30 15 00 28 56 54 52 50 48 46 180 kpc X 28,555: II X X Declination (J2000) Right Ascension (J2000) 11 02 05 00 01 55 50 45 40 16 44 43 42 41 40 39 38 37 160 kpc 26,146: DD II DD Declination (J2000) Right Ascension (J2000) 11 58 35 30 25 20 15 10 05 26 24 23 22 21 20 19 18 125 kpc 20,337: WAT WAT WAT Declination (J2000) Right Ascension (J2000) 13 33 05 00 32 55 50 45 40 35 30 25 07 24 22 20 18 16 14 60 kpc X X X Figure 1. Examples of radio morphological classification assigned in the ROGUE I catalog (Table 2). The 1.4 GHz radio contours from the FIRST (red) and the NVSS (black) maps are overlaid on the optical DSS (gray scale) image, centered at the host galaxy position marked by a plus sign. Background/foreground sources are marked with “X” sign. The FIRST beam is placed inside the square box at the bottom left corner and the NVSS beam (⇠9 times of size of the FIRST beam) is not shown here for clarity. The contours levels, for the FIRST and the NVSS maps are drawn at 0.6 mJy beam 1 and 1.35 mJy beam 1 (⇠ 3 ), respectively, which increase by factors of ( p 2)n where n ranges from 0,1,2,3,...20. The contours at 3 are shown by the dashed lines. In the title of each image we give the catalog number and the codes adopted for radio morphology based on FIRST, NVSS, and final classifications, respectively. 10 Kozie l-Wierzbowska et al. 8: C C C Declination (J2000) Right Ascension (J2000) 09 42 27 26 25 24 23 22 21 00 00 30 15 00 -00 00 15 30 45 40 kpc 5,897: OI E OI Declination (J2000) Right Ascension (J2000) 02 04 12 10 08 06 04 02 -09 15 00 30 16 00 30 17 00 30 105 kpc 15,129: I I I Declination (J2000) Right Ascension (J2000) 15 47 30 25 20 15 10 05 00 46 55 50 35 43 42 41 40 39 38 37 36 35 180 kpc X X 18: II II II Declination (J2000) Right Ascension (J2000) 09 56 50 48 46 44 42 40 38 36 34 32 00 00 30 00 -00 00 30 01 00 30 02 00 30 03 00 30 150 kpc 25,220: OII I/II I/II Declination (J2000) Right Ascension (J2000) 15 14 10 05 00 13 55 50 45 40 35 24 17 16 15 14 13 12 11 10 09 08 160 kpc X 12,544: Z Z Z Declination (J2000) Right Ascension (J2000) 08 39 30 15 00 28 56 54 52 50 48 46 180 kpc X 28,555: II X X Declination (J2000) Right Ascension (J2000) 11 02 05 00 01 55 50 45 40 16 44 43 42 41 40 39 38 37 160 kpc 26,146: DD II DD Declination (J2000) Right Ascension (J2000) 11 58 35 30 25 20 15 10 05 26 24 23 22 21 20 19 18 125 kpc 20,337: WAT WAT WAT Declination (J2000) Right Ascension (J2000) 13 33 05 00 32 55 50 45 40 35 30 25 07 24 22 20 18 16 14 60 kpc X X X Figure 1. Examples of radio morphological classification assigned in the ROGUE I catalog (Table 2). The 1.4 GHz radio contours from the FIRST (red) and the NVSS (black) maps are overlaid on the optical DSS (gray scale) image, centered at the host galaxy position marked by a plus sign. Background/foreground sources are marked with “X” sign. The FIRST beam is placed inside the square box at the bottom left corner and the NVSS beam (⇠9 times of size of the FIRST beam) is not shown here for clarity. The contours levels, for the FIRST and the NVSS maps are drawn at 0.6 mJy beam 1 and 1.35 mJy beam 1 (⇠ 3 ), respectively, which increase by factors of ( p 2)n where n ranges from 0,1,2,3,...20. The contours at 3 are shown by the dashed lines. In the title of each image we give the catalog number and the codes adopted for radio morphology based on FIRST, NVSS, and final classifications, respectively. • There are about 5 compact radio sources to each
extended source. • If the lifetime of a compact source is n times smaller than that of an extended one,
only one in every 5n compact will become extended. • Our sample is complete for host galaxies with stellar masses log M★ /M⨀ > 11.2. ROGUE I contains 32 616 radio sources associated with galaxies. All sources have been classified by eye. Left: examples of compact and extended radio sources*. Right: identification of radio AGNs.
We define compact sources as radio AGNs where the radio emission comes from a region smaller than the host galaxy’s optical diameter. Radio AGNs are identified using a single criterion based on their WISE W3 band and radio luminosities (Kozieł- Wierzbowska in prep). Radio AGNs Compact Extended * We show here preliminary results using an earlier version of the catalogue. Toy models: we have randomly drawn a simulat- ed sample of compact sources from the observed extended sample. We compare the simulated to the observed compacts in M★ bins (i.e. assuming no host galaxy evolution). Free parameters: • f = by how much the black hole mass of an ex- tended source has grown since it was compact. • tCE/tE = the ratio of lifetimes of compact that will become extended (CE) to that of an
extended (E) source. To reproduce the observed compact sample, • f = 1.08–1.13, i.e. black hole masses increase by ~10%. • 0.01 < tCE/tE < 1.00 with likely values 0.1–0.2, i.e. a CE’s lifetime is 10–20% that of an E source. • Thus only 1 in every ~25 to 50 compact source will become
extended. p for Anderson–Darling and Mann–Whitney tests p ≥ 0.05 mean similar distributions