Upgrade to Pro — share decks privately, control downloads, hide ads and more …

Hello Log

Hello Log

ocowchun

August 09, 2017
Tweet

More Decks by ocowchun

Other Decks in Programming

Transcript

  1. What is a log A log record what happen and

    when For example: 1. 2017-08-08T13:24:03, someone reqeust /featured- genres/back-end 2. 2017-08-08T13:24:35, we deploy new version for cmx-api 3. 2017-08-08T13:24:42, memory usage is 250.2MB
  2. Problems try to solve 4 System resources usage 4 Services

    performance 4 API throughput 4 Where are these requests from 4 Information when some wrong happen (a.k.a. bug)
  3. Log is our best friend! System resources usage, Services performance:

    Log can record resources usage in specific time point. We can build a whole picture if we collect enough data. API throughput: We can know the throughput by record every request. Where are these requests from, Information when some wrong happen: Save the request information, for instance: user agent, ip, query string ...
  4. It's looks hard, is there any product I can use?

    System resources usage, Services performance: Amazon CloudWatch, New Relic, Datadog API throughput, Where are these requests from: Google Analytics, Mixpanel, Amplitude Information when some wrong happen: Rollbar, Sentry
  5. I want challenge myself牧I have some special requirements What do

    I need to concern when build log system: 4 Write and read performance 4 Scalability 4 System operation 4 How to query 4 Visualization and dashboard
  6. Log process flow 4 Send log to data processing pipeline

    4 Parse log in suitable format 4 Send the result to wherever you want
  7. Logstash Logstash is an open source, server-side data processing pipeline

    that ingests data from a multitude of sources simultaneously, transforms it, and then sends it to your favorite “stash.” 4 Log will ingest to Logstash first, and send to Elasticsearch after parse. 4 A lot built-in plugin to manipulate log.
  8. Logstash Filter plugins grok: parse and structure arbitrary text. Grok

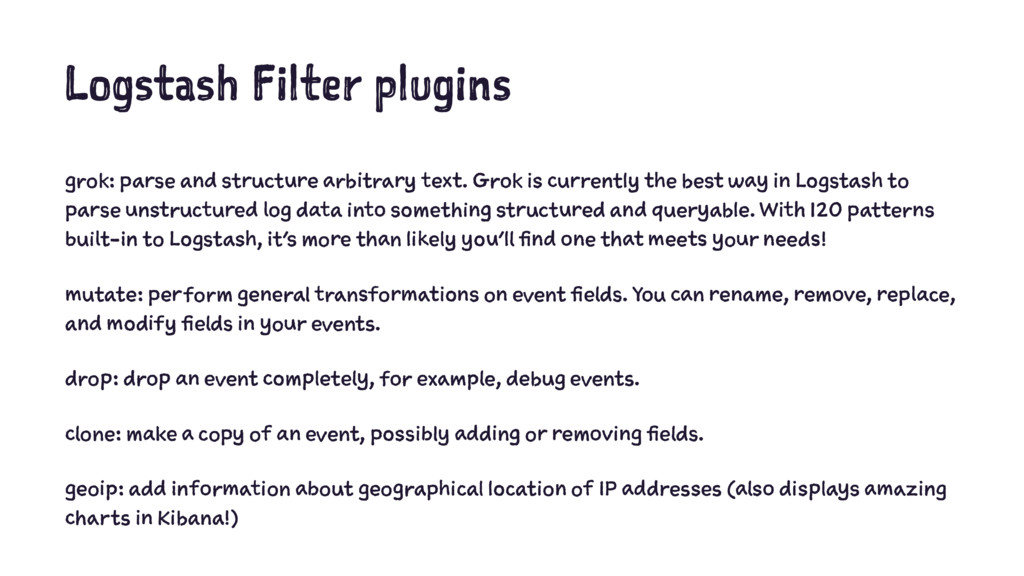
    is currently the best way in Logstash to parse unstructured log data into something structured and queryable. With 120 patterns built-in to Logstash, it’s more than likely you’ll find one that meets your needs! mutate: perform general transformations on event fields. You can rename, remove, replace, and modify fields in your events. drop: drop an event completely, for example, debug events. clone: make a copy of an event, possibly adding or removing fields. geoip: add information about geographical location of IP addresses (also displays amazing charts in Kibana!)
  9. Grok your raw log 55.3.244.1 GET /index.html 15824 0.043 Logstash

    config input { file { path => "/var/log/http.log" } } filter { grok { match => { "message" => "%{IP:client} %{WORD:method} %{URIPATHPARAM:request} %{NUMBER:bytes} %{NUMBER:duration}" } } }
  10. Elasticsearch Elasticsearch is a distributed, RESTful search and analytics engine

    4 Schemaless 4 Build powerful query using ugly Elasticsearch DSL 4 Store logs in Elasticsearch 4 Store by date, all logs create in same data will store in same index
  11. { "query": { "bool": { "must": [{ "match": { "user.name":

    "Ben" } }], "filter": [{ "match": { "admin_status": "not_read todo need_interview" } }, { "match": { "job_title": "web developer" } }] } }, "sort": { "updated_at": { "order": "desc" } } }
  12. Kibana Kibana lets you visualize your Elasticsearch data 4 Help

    you create beautiful charts without build query yourself 4 Retrieve time series data, perform calculations to tease out the answers to complex questions