Upgrade to Pro — share decks privately, control downloads, hide ads and more …

Measuring Brand Equity

OPEN
May 14, 2024
720

Measuring Brand Equity

OPEN

May 14, 2024

Transcript

  1. Brand/ Company Competition Stakeholders Customers Marketplace BRAND STRATEGY Brand Portfolio

    and Architecture Brand Identity/Essence Brand Positioning INTEGRATED BRAND EXPERIENCE Brand Design Brand Communication BRAND IMAGE Customer Behaviour BUSINESS RESULTS (Profit and Share) Managing Brands Over Time BRAND EQUITY BRAND VALUATION
  2. BRAND EQUITY Brand equity is the added value endowed on

    products and services, which may be reflected in the way consumers, think, feel, and act with respect to the brand. –Philip Kotler
  3. Measurement Pathways Three Pathways Customer based measures Attitudinal Data Hierarchy

    of Effects Brand Tracking Studies Incremental Short- term Sales Cash Flows Marketing Mix Modeling ROI Long-term Brand Value Brand Value Discounted Cash Flows Brand Scorecards An Integrated Measurement System
  4. Customer Based Brand Equity Loyalty Positive Reactions Point of Difference

    Brand Awareness Brand Identity Brand Image Brand Relationshi p
  5. Leading and Lagging Indicators Leading Indicators Energized Brand Strength Leading

    Indicators Brand Stature Differentiation Energy Relevance Esteem Knowledge Brand Asset Valuator D E R E K
  6. Unfocused/ New Niche or Momentum Leadership Declining Eroded Energized Brand

    Strength (EBS) (Differentiation, Energy, Relevance) Brand Stature (Esteem, Knowledge) Low High High Low Leadership Brands are Strong on Both Energized Brand Strength and Stature
  7. §Aaker (2000)- BA/ BAs/ PQ/ BL §Young & Rubicam- Brand

    Asset Valuator §David Aaker Brand 10 §Millward Brown- Brand Dynamics Pyramid §Inter-brand Metrics §EquiTrends §Brand Finance MEASURE OF BRAND EQUITY
  8. Aaker Kelle r Y&R Equi- Trend Inter- brand Aaker Keller

    Y&R Equi- Trend Inter- brand Associations x x x Market Trend x Awareness x x Mktng Support x Brand Trend x Stability x Differentiation xx Perceived Quality x x x Dist. Coverage x Perceived Value x Esteem xx Personality x x International x Price Premium xx Knowledge /Salience xx x Relevance xx Leadership x xx User Sat./Loyalty x x Legal Protect’n x Purchase Intention xx Market Share x COMMON MEASURES
  9. THE RIGHT APPROACH 13 Financial Value (Long term) Activity &

    Program Metrics Market Performance (short term) Customer Centric Brand Measure • Linking customer perceptions and market performance to impact on the financial value ROMI
  10. THE RIGHT APPROACH Activity Metrics Market Performance Customer Centric Brand

    Measure Investment Clarity Relevance Distinctiveness Consistency ROI as defined Short term sales ^ Brand awareness Familiarity/associations Brand attitudes Brand preference Customer acquisition Customer retention Attachment/Loyalty Sales Market share Price premium Profitability Price elasticity Geographic Expansion
  11. THE RIGHT APPROACH 15 Financial Value Activity & Program Metrics

    Market Performance Customer Centric Brand Measure • Linking customer perceptions and market performance to impact on financial value to assess ROMI. ROMI •Stock price •P/E ratio •Market capitalization •Brand contribution
  12. How Brands drive Business Value Brand Value Brand Contribution Branded

    Business Branded Business Value of a single branded business operating under the subject brand / trademark Brand Contribution Total economic benefit derived by a business from its brand Brand Value Proportion of brand contribution which can be legally transferred via sale or licensing, i.e. the trademark.
  13. Why value ‘brands’? Balance Sheet Tax Litigation Joint Ventures Financing

    M&A Investor Relations Internal Licensing Portfolio Management Brand Architecture Brand Strategy Budget Setting Brand Scorecards Technical Reasons: Strategy Reasons:
  14. Customer - Price - Volume - Repeat - Share of

    wallet - Cross sell External Audiences - Distribution terms - Channel access - Strategic alliances - Deal completion - Licensing - CSR Staff - Recruitment - Retention - Recommendation - Morale - Staff costs Financial Audiences - Interest spread - Share price - Debt/ Equity ratio - Risk appetite - Cost of borrowing Potential Customers Existing Customers Influencers e.g. Media Trade Channels Strategic Allies & Suppliers Investors Debt providers Sales Production All Other Employees Middle Managers Directors Brand affects a wide range of stakeholders
  15. Enterprise Value Intangible Assets Residual Goodwill Artistic Intangibles Marketing Intangibles

    Customer Intangibles Contract Intangibles Technology Intangibles Tangible Assets Working Capital Plant and Equipment Land and Buildings Creates Brand Value Brands and other intangible assets viewed in the holistic business context Accounting framework for valuing Intangible Assets
  16. Brand Finance: approach to Trademark (Brand) Valuation 1 2 3

    4 Brand Strength Index (BSI) Brand Royalty Rate Forecast Revenues Brand Value A brand strength benchmarking process with a score expressed out of 100 The BSI score is applied to a sector royalty rate range to identify an appropriate rate The royalty rate is applied to forecast revenues to derive brand revenues Post-tax brand revenues are discounted to a net present value which equals the brand value X X =
  17. Measure Attribute* Score Importance Brand Strength Index Inputs (25%) Product/CX

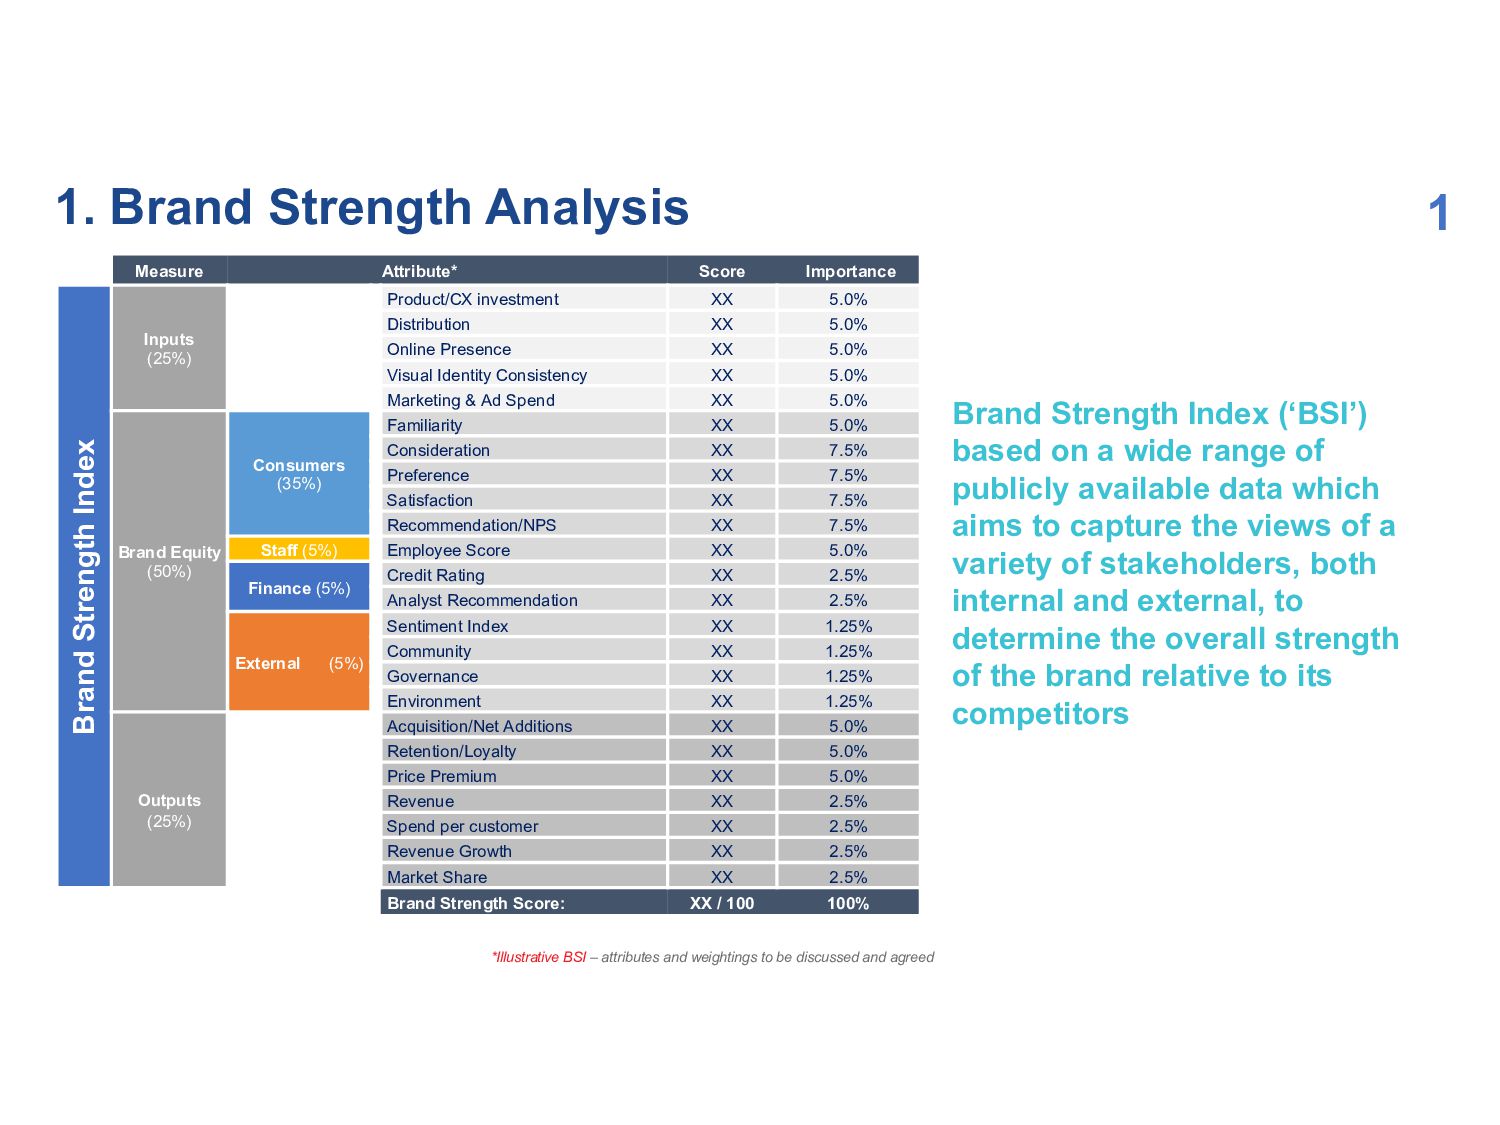
    investment XX 5.0% Distribution XX 5.0% Online Presence XX 5.0% Visual Identity Consistency XX 5.0% Marketing & Ad Spend XX 5.0% Brand Equity (50%) Consumers (35%) Familiarity XX 5.0% Consideration XX 7.5% Preference XX 7.5% Satisfaction XX 7.5% Recommendation/NPS XX 7.5% Staff (5%) Employee Score XX 5.0% Finance (5%) Credit Rating XX 2.5% Analyst Recommendation XX 2.5% External (5%) Sentiment Index XX 1.25% Community XX 1.25% Governance XX 1.25% Environment XX 1.25% Outputs (25%) Acquisition/Net Additions XX 5.0% Retention/Loyalty XX 5.0% Price Premium XX 5.0% Revenue XX 2.5% Spend per customer XX 2.5% Revenue Growth XX 2.5% Market Share XX 2.5% Brand Strength Score: XX / 100 100% 1. Brand Strength Analysis Brand Strength Index (‘BSI’) based on a wide range of publicly available data which aims to capture the views of a variety of stakeholders, both internal and external, to determine the overall strength of the brand relative to its competitors *Illustrative BSI – attributes and weightings to be discussed and agreed 1
  18. Economic profit is the after-tax operating profit of the brand,

    minus a charge for the capital used to generate the brand’s revenue and margins. measures the ability of the brand to create loyalty and, therefore, sustainable demand and profit into the future.
  19. Evaluate on-going performance The Big Picture 6. Build scale through

    licensing / franchising / partnerships 5. Build core business through market expansion 4. Build core business through product development 3. Portfolio management / rebranding group companies 2. Optimise brand positioning and strength 1. Base-case brand and business valuation (using internal data), growth strategy formulation, target-setting and tracker set-up Maximising a strong brand Current brand and business value Target brand and business value A framework that considers all aspects of brand used to drive business growth Suggested First Step
  20. Summary Brand Equity Health of the brand that affects customer

    equity Behavioral measures – awareness, judgement, imagery and loyalty Brand Valuation Monitory value of the brand attributes to earnings from the brand Cost based approach Market based approach Financial approach