Upgrade to Pro — share decks privately, control downloads, hide ads and more …

Systematic Debugging

Systematic Debugging

Obi Uchenna David

November 11, 2021
Tweet

More Decks by Obi Uchenna David

Other Decks in Technology

Transcript

  1. Systematic
    Debugging
    Obi Uchenna David


    @othreecodes


    View Slide

  2. Introduction & Overview
    Bugs
    Debugging
    Tracing
    Summary
    Profiling
    00
    Overview
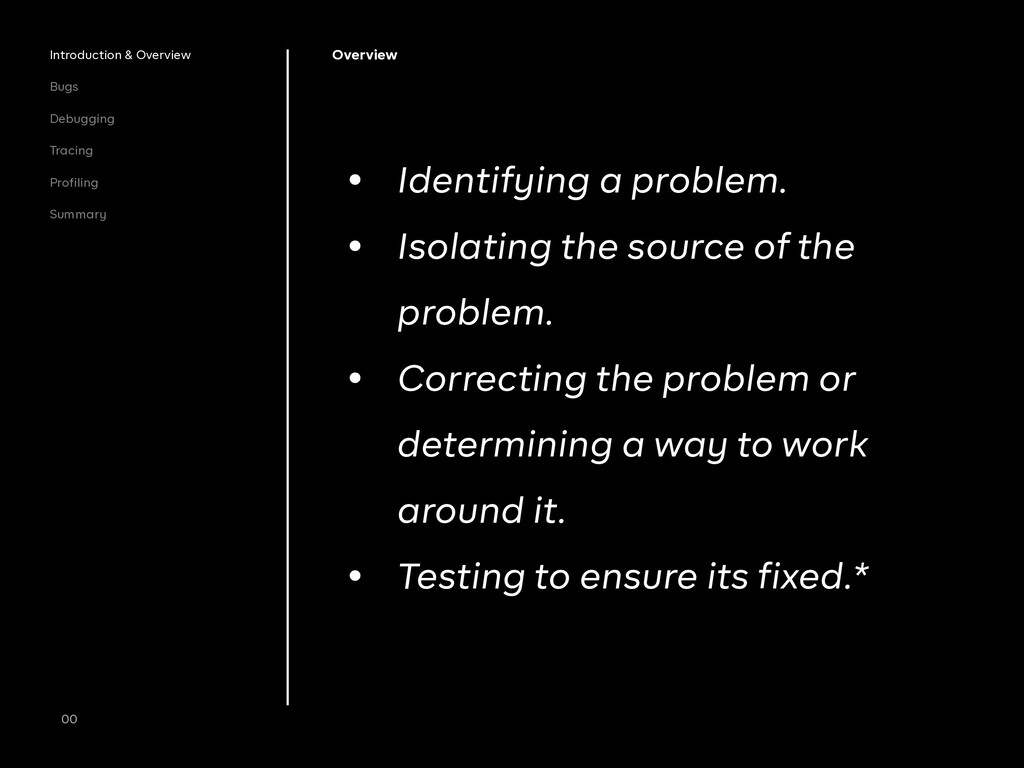
    • Identifying a problem.


    • Isolating the source of the
    problem.


    • Correcting the problem or
    determining a way to work
    around it.


    • Testing to ensure its fixed.*

    View Slide

  3. Introduction & Overview
    01
    How they occur


    • Syntax errors


    • Runtime errors


    • Compilation errors


    • Logic/Semantic errors


    • Resource errors


    • Interface errors
    Bugs
    Debugging
    Tracing
    Summary
    Profiling

    View Slide

  4. Introduction & Overview
    02
    Syntax errors


    • Linters help


    • IDEs have made life easier
    Bugs
    Debugging
    Tracing
    Summary
    Profiling

    View Slide

  5. Introduction & Overview
    03
    Runtime and Compilation errors


    • Compilation 
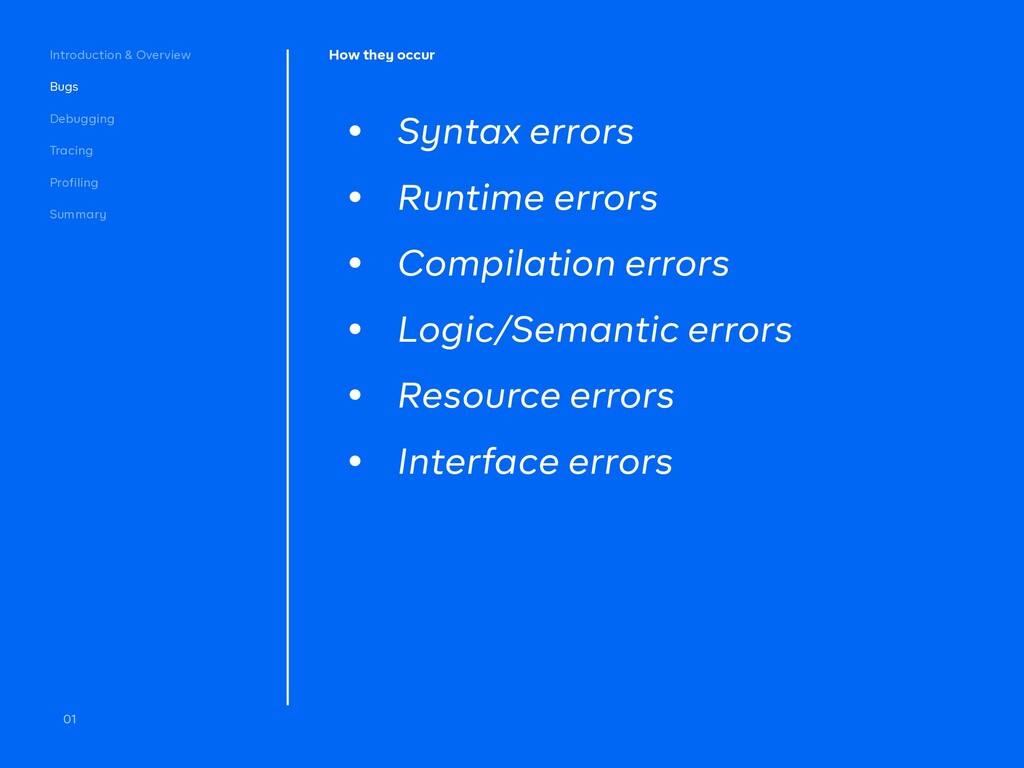
errors occur at
    build time.


    • Runtime errors occur at
    execution point.


    • Sometimes it may be due to
    server config changes or
    missing environment
    variables.
    Bugs
    Debugging
    Tracing
    Summary
    Profiling

    View Slide

  6. Introduction & Overview
    04
    Logic and Semantic errors (and interface errors)


    • Program will run, but it won’t
    go anywhere


    • Understanding
    requirements are important


    • Interface errors happen
    when you use code other
    than its meant to be used.
    Bugs
    Debugging
    Tracing
    Summary
    Profiling

    View Slide

  7. View Slide

  8. Introduction & Overview
    06
    Debugging


    Debugging is at the core of
    programming, because it takes up the
    largest percentage of your time while
    coding.


    There are three major phases involved in
    debugging:


    1. Finding bugs.


    2. Analyzing and understanding why
    bugs occur.


    3. Fixing or removing bugs.
    Bugs
    Debugging
    Tracing
    Summary
    Profiling

    View Slide

  9. How I fix/remove bugs
    • Restart app/server


    • Check failing tests


    • Check logs


    • Use break points


    • Revert to last working
    code


    • Copy and paste stack
    trace on google
    07

    View Slide

  10. Story time…
    08

    View Slide

  11. 09
    How do you fix a bug you did not
    create?

    View Slide

  12. Introduction & Overview
    10
    Logging


    Bugs
    Debugging
    Tracing
    Summary
    Profiling
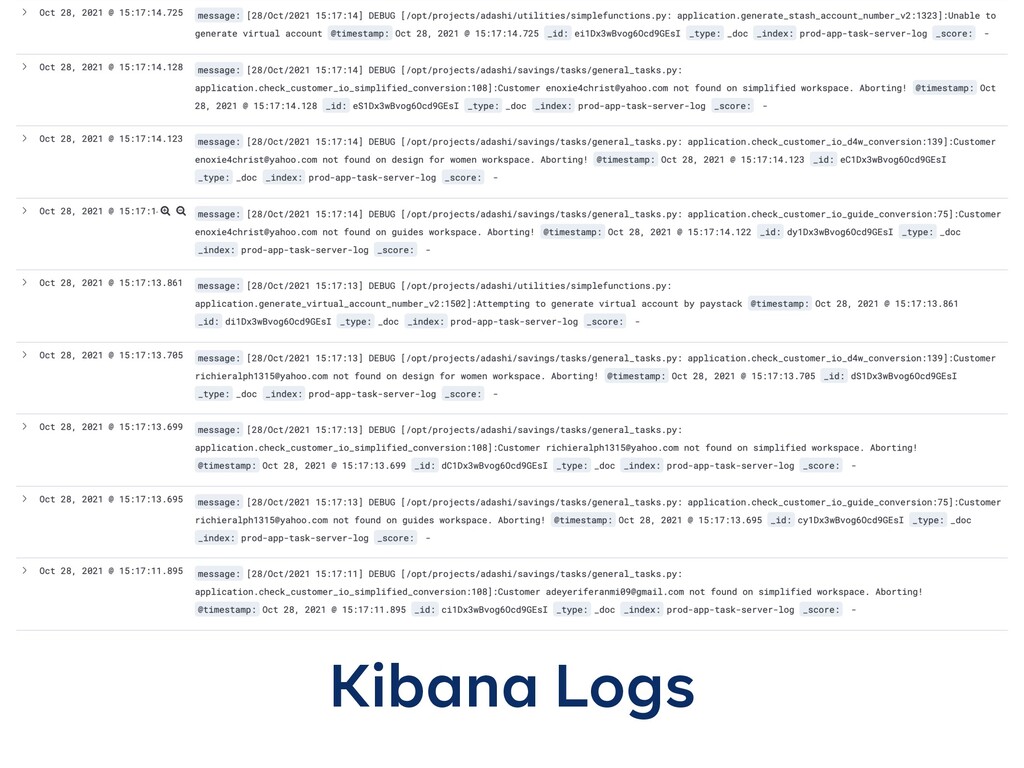
    A log is a record of events that happened over
    time.
    Log files can show any discrete event within an
    application or system, such as a failure, and
    error, or a state transformation. When
    something inevitably goes wrong, such
    transformations in state help indicate which
    change actually caused an error.

    View Slide

  13. Kibana Logs

    View Slide

  14. Introduction & Overview
    12
    Tracing


    Bugs
    Debugging
    Tracing
    Summary
    Profiling
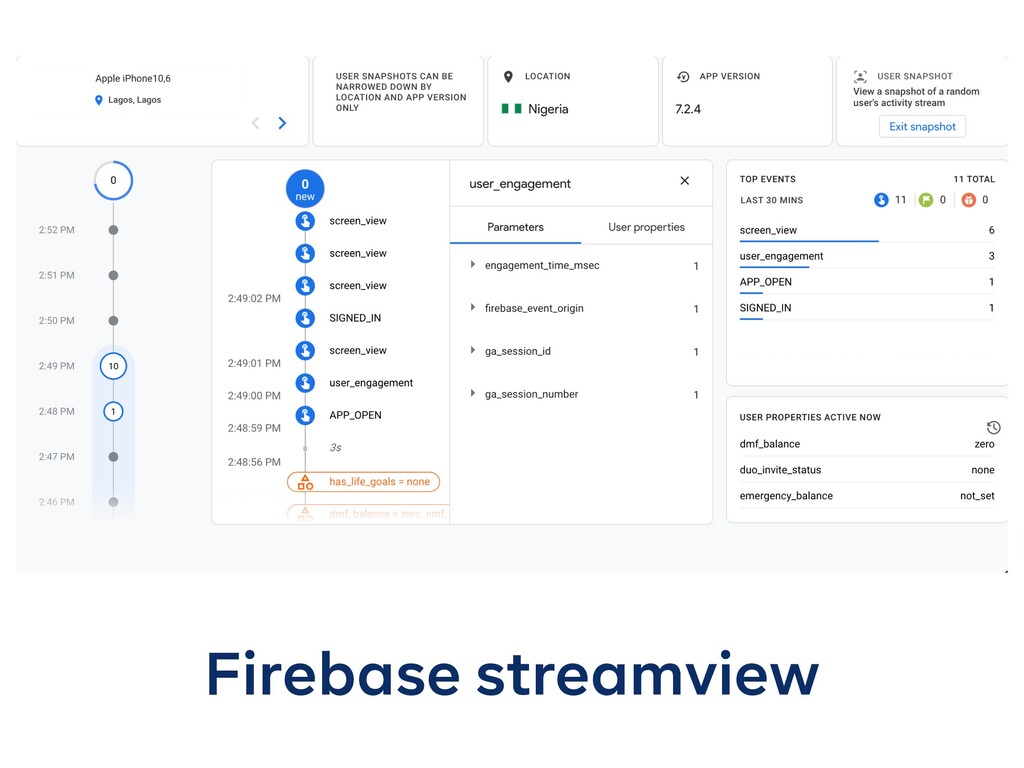
    A trace is a log of events within the program
    often related to a single user.

    This log may be detailed enough to report
    function calls and returns, and execution of
    other statements.
    Traces can be used for discovering the chain of
    events that led to a problem
    The goal of tracing is to following a program’s
    flow and data progression.

    View Slide

  15. Firebase streamview

    View Slide

  16. Introduction & Overview
    14
    Tracing


    Bugs
    Debugging
    Tracing
    Summary
    Profiling
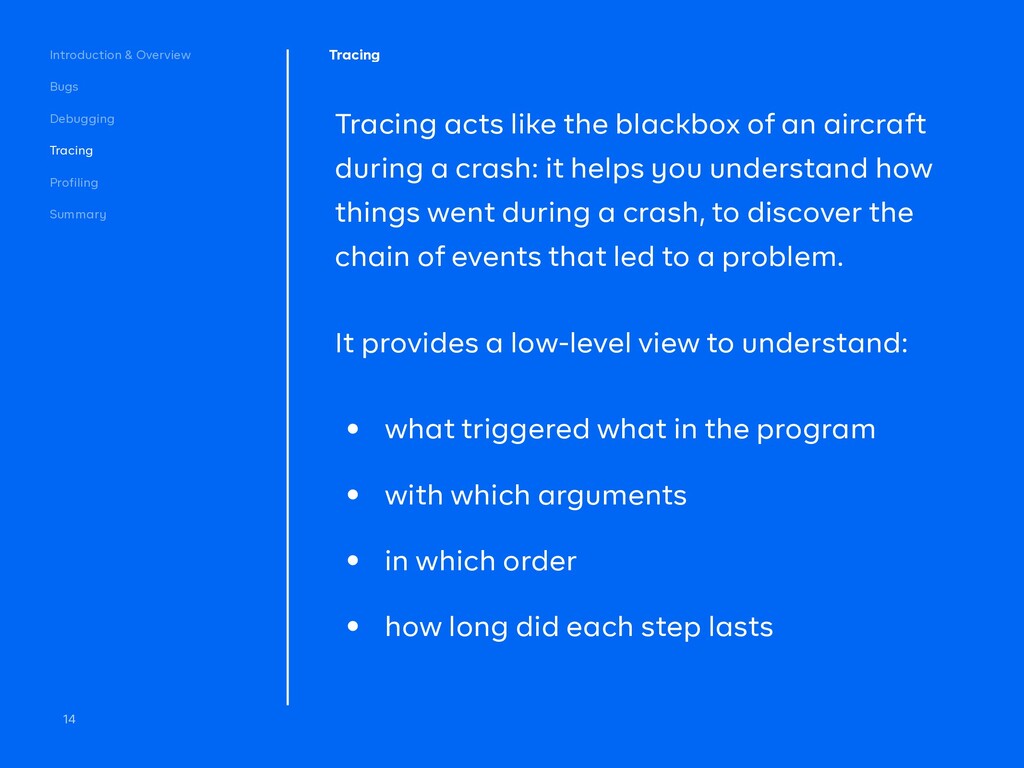
    Tracing acts like the blackbox of an aircraft
    during a crash: it helps you understand how
    things went during a crash, to discover the
    chain of events that led to a problem.


    It provides a low-level view to understand:


    • what triggered what in the program


    • with which arguments


    • in which order


    • how long did each step lasts


    View Slide

  17. Introduction & Overview
    15
    Distributed Tracing


    Bugs
    Debugging
    Tracing
    Summary
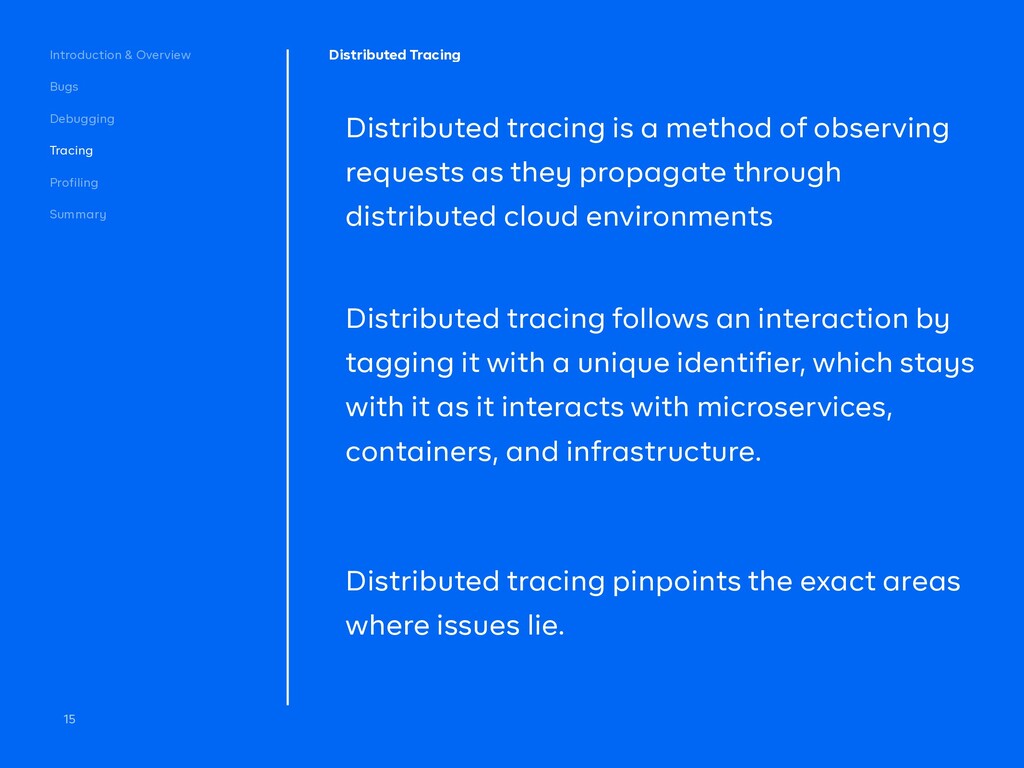
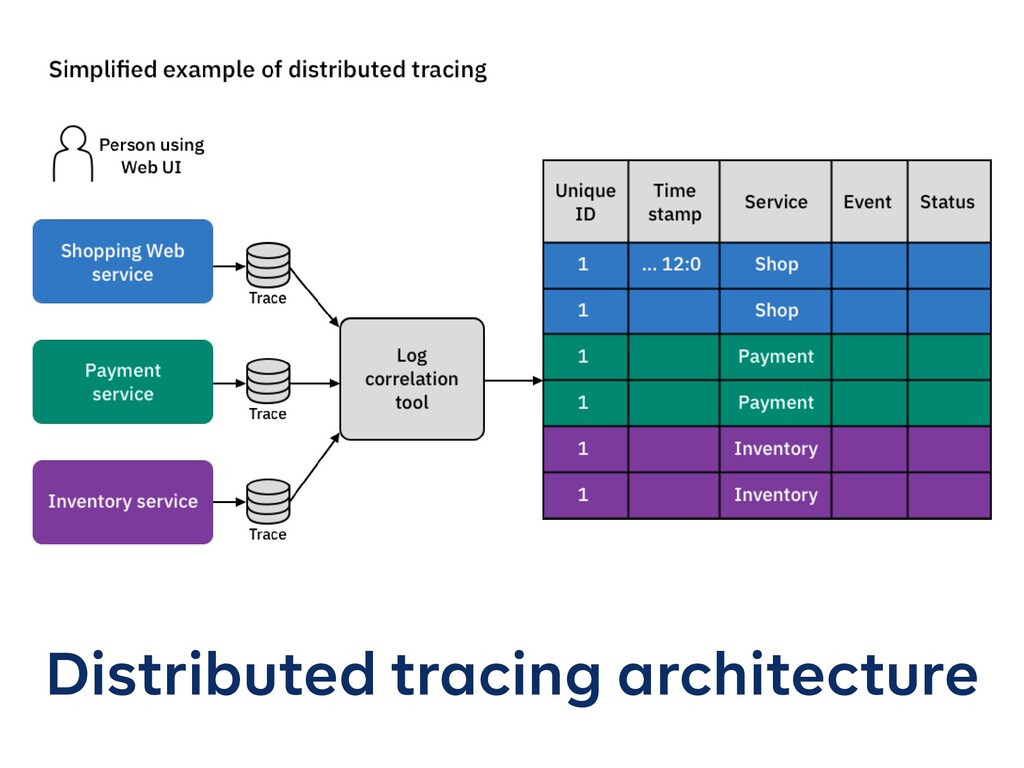
    Profiling
    Distributed tracing is a method of observing
    requests as they propagate through
    distributed cloud environments
    Distributed tracing follows an interaction by
    tagging it with a unique identifier, which stays
    with it as it interacts with microservices,
    containers, and infrastructure.
    Distributed tracing pinpoints the exact areas
    where issues lie.

    View Slide

  18. Distributed tracing architecture

    View Slide

  19. Introduction & Overview
    17
    Profiling


    Bugs
    Debugging
    Tracing
    Summary
    Profiling
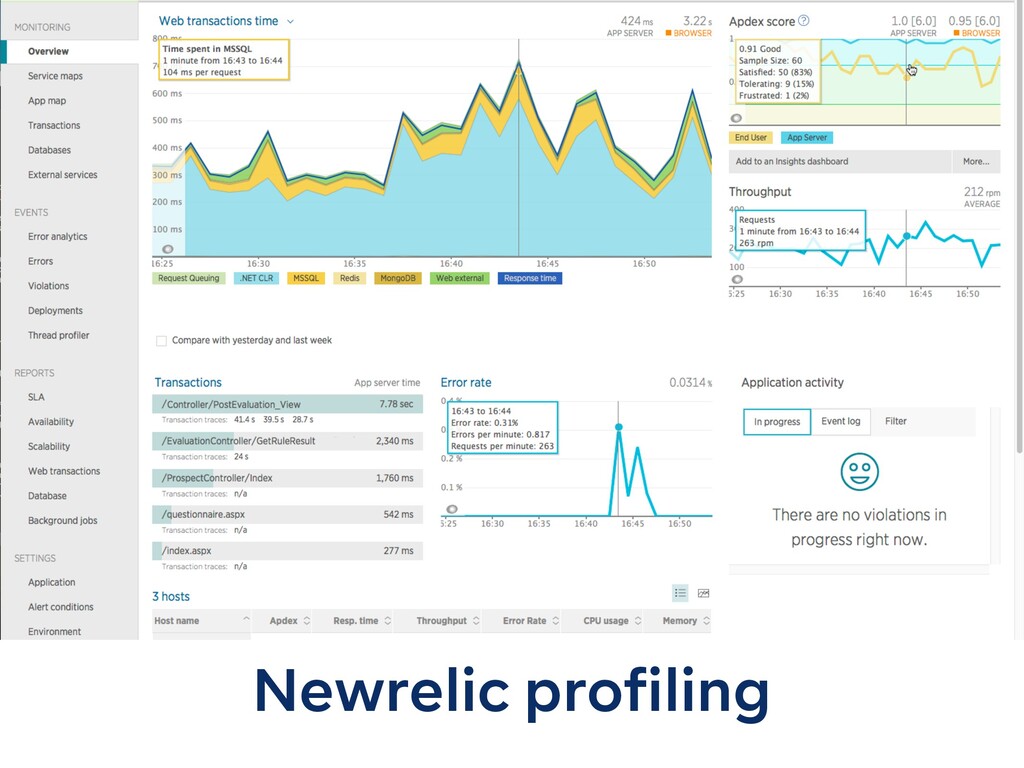
    A profile provides an inventory of performance
    events and timings for the execution as a
    whole. This ignores the chronology of the
    events in an absolute sense.
    Profiling is a good way to discovering resource
    errors.
    Profiling and metrics are the last piece of the
    monitoring puzzle. Together, they provide a
    statistic overview of a system's health and
    tracked events over time.

    View Slide

  20. Introduction & Overview
    18
    Profiling


    Bugs
    Debugging
    Tracing
    Summary
    Profiling
    Profiles range from low-level metrics like CPU
    usage or file I/O to higher-level metrics like
    throughput or latency. When aggregated and
    seen together, they are powerful signals giving
    you a holistic view of your system and can help
    detect issues.

    View Slide

  21. Firebase performance monitoring

    View Slide

  22. Wed.dev performance metrics

    View Slide

  23. Newrelic profiling

    View Slide

  24. Omo

    View Slide

  25. Introduction & Overview
    Processes
    What makes it work
    In Practical
    Summary
    Challenges
    23
    Here’s what we know


    In Summary
    When used together, Logging,
    Tracing and Profiling can give you
    powerful insights about your
    services and systems: detecting
    anomalies when they arise and
    quickly understand the root cause
    of performance issues.

    View Slide

  26. References


    • http://wearepresta.com/a-systematic-approach-to-debugging/


    • https://www.freecodecamp.org/news/how-to-improve-your-
    debugging-skills/


    • https://searchsoftwarequality.techtarget.com/definition/debugging


    • https://www.bmc.com/blogs/monitoring-logging-tracing/


    • https://stackify.com/what-is-code-profiling/


    • https://developer.android.com/topic/performance/tracing


    • https://youtu.be/dmnA3axZ3FY


    • https://stackoverflow.com/questions/41725613/definition-of-
    debugging-profiling-and-tracing


    • https://www.jackkinsella.ie/articles/7-keys-to-systematic-debugging


    • https://www.debuggingbook.org/beta/html/Intro_Debugging.html


    • https://www.jwhitham.org/2016/02/profiling-versus-tracing.html


    • http://ipm-hpc.sourceforge.net/profilingvstracing.html


    View Slide

  27. References


    • https://greeeg.com/issues/differences-between-logging-tracing-
    profiling


    • https://www.dynatrace.com/news/blog/what-is-distributed-tracing/

    View Slide