Upgrade to Pro — share decks privately, control downloads, hide ads and more …

What query logs tell us about travel flows

Pieter Colpaert
April 11, 2016
5.7k

What query logs tell us about travel flows

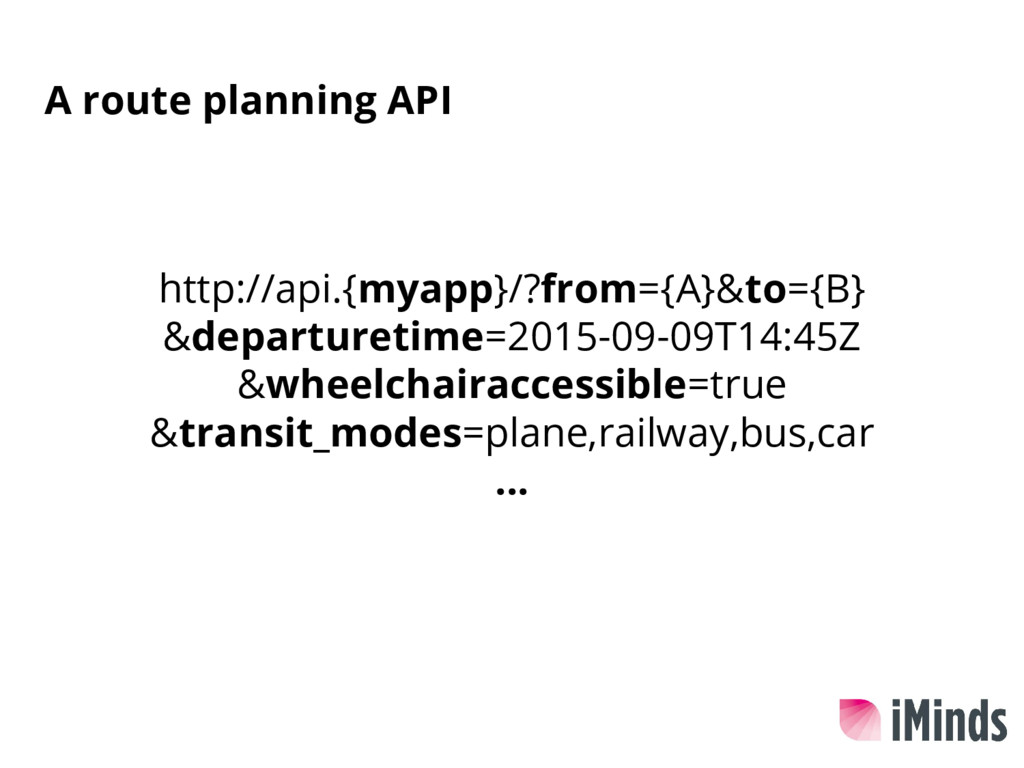
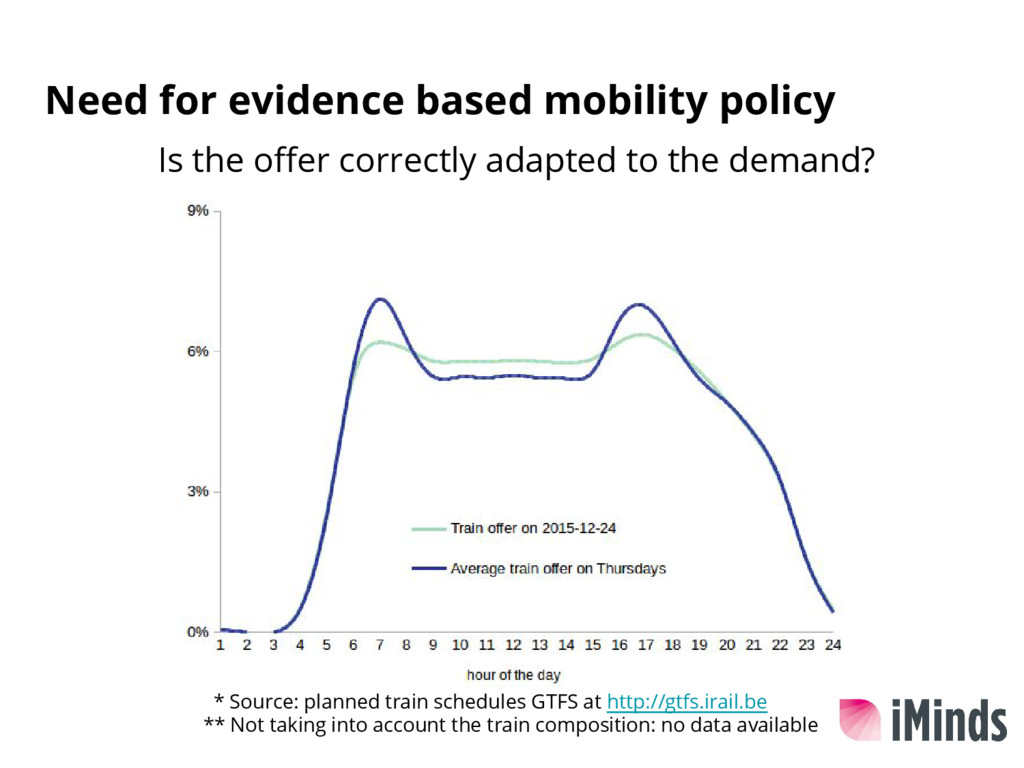
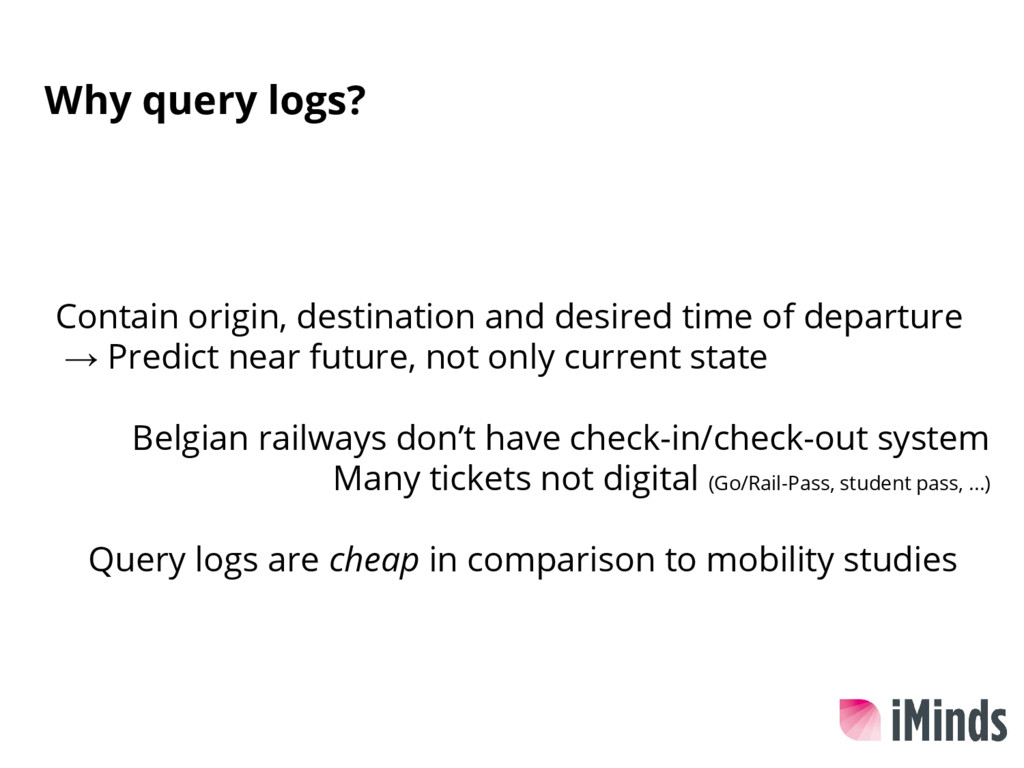
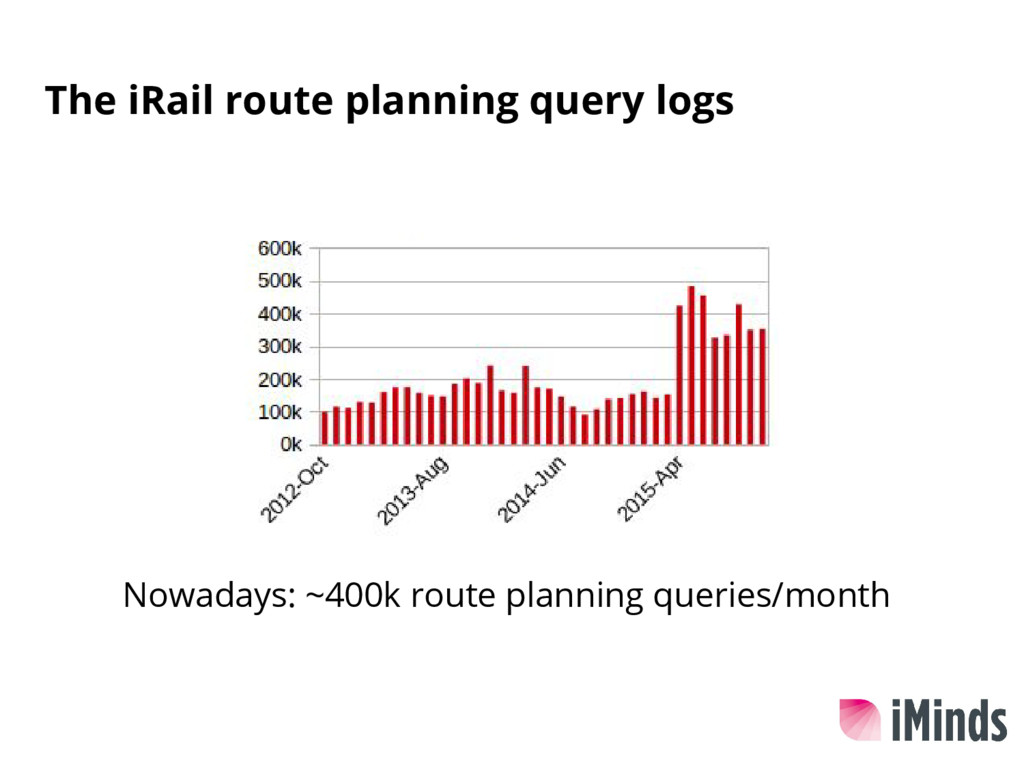
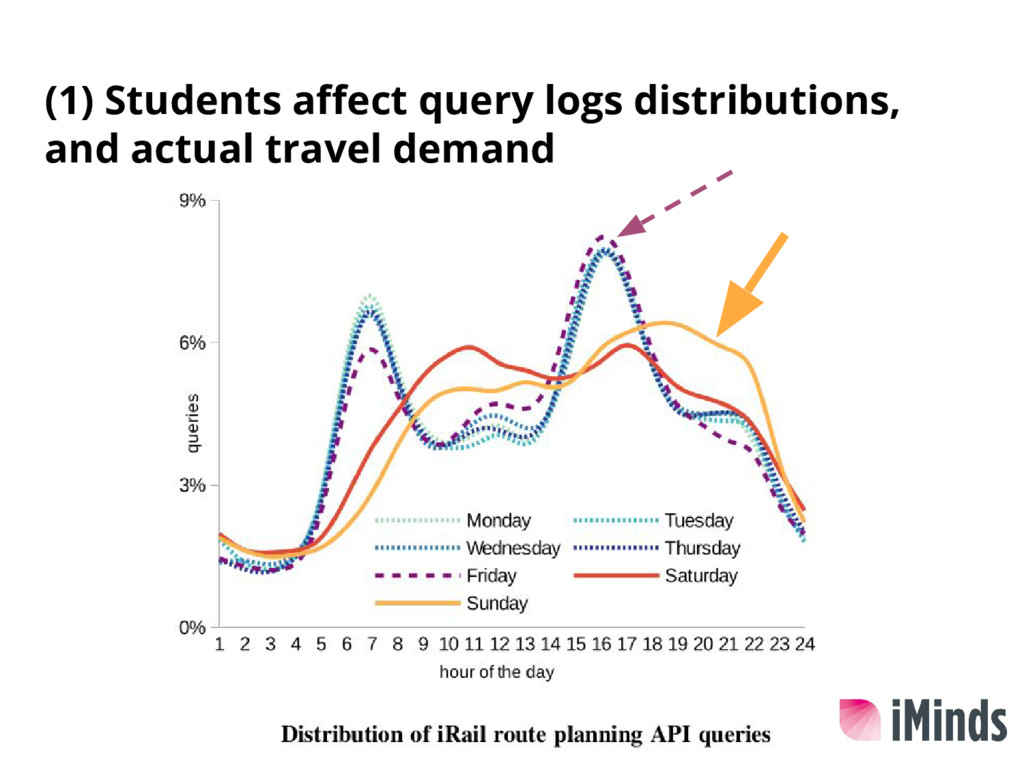
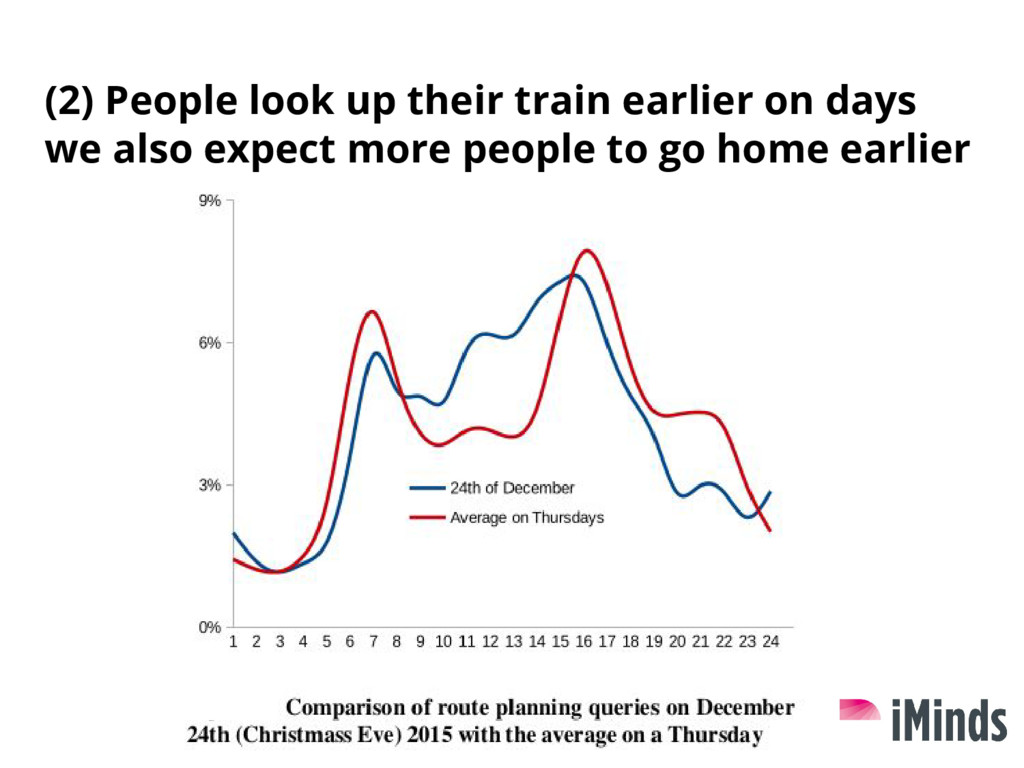
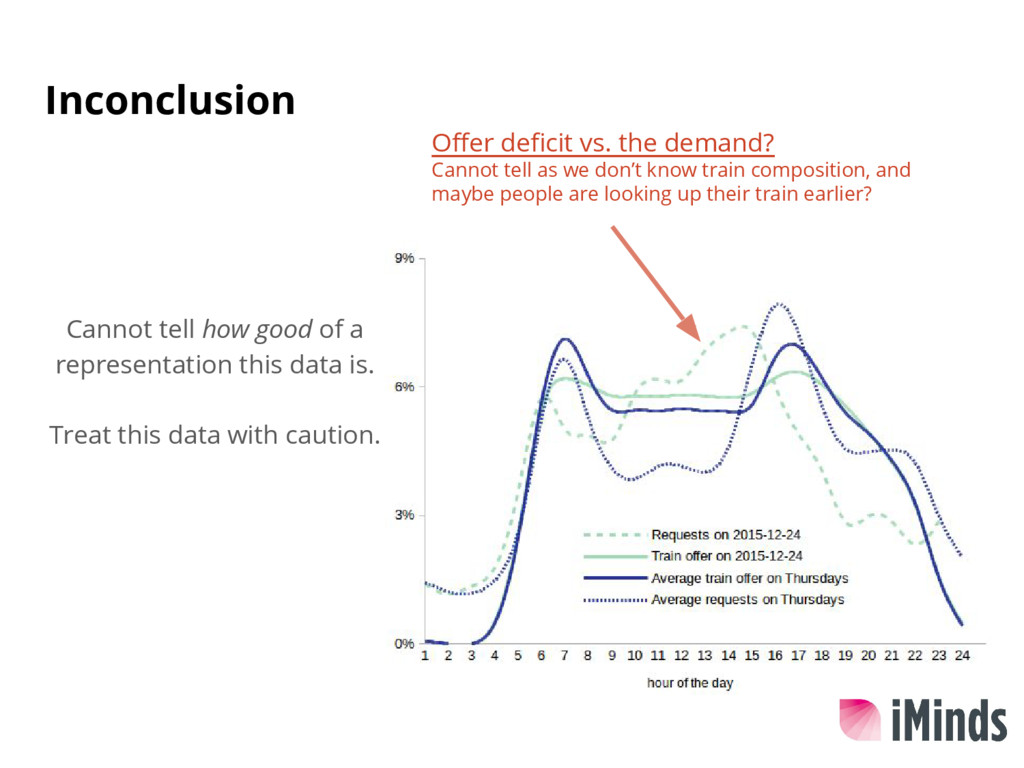
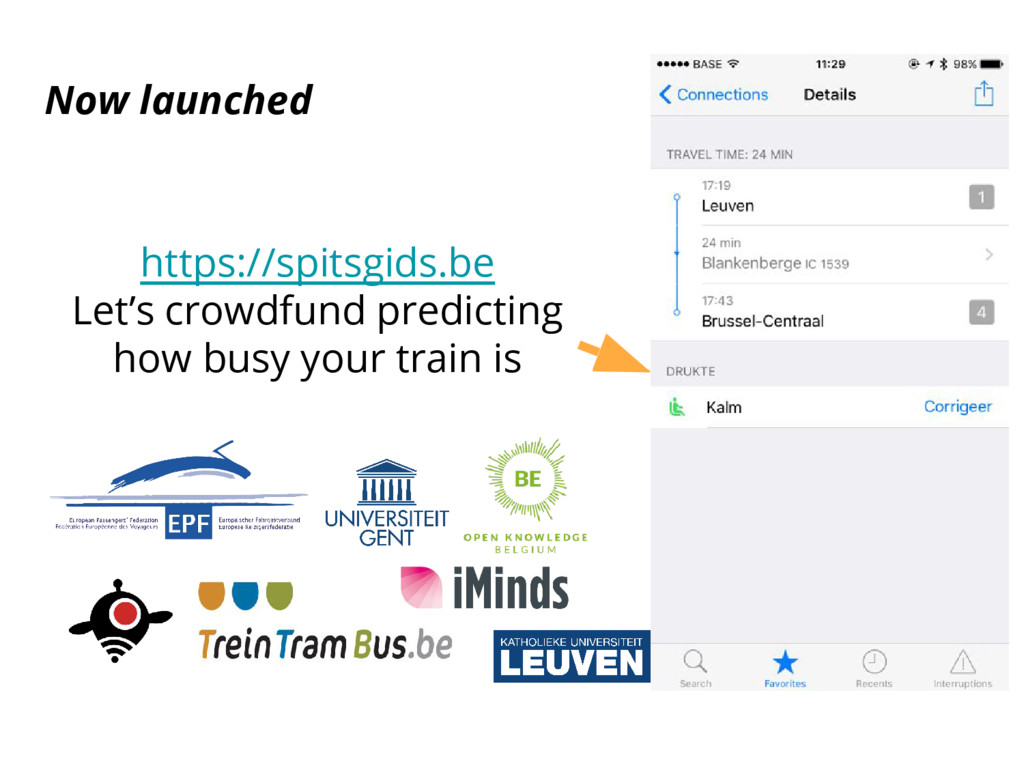
We studied the query logs of the iRail route planning API to see whether it can serve as a way to study travel flows in Belgium. We want to know, because iRail wants to launch a dataset than tells you how busy your train is. In Belgium, this can help you tell on which trains you will still be able to get some work done, or read a book, instead of having to stand up.

Crowd-funding campaign: https://spitsgids.be/

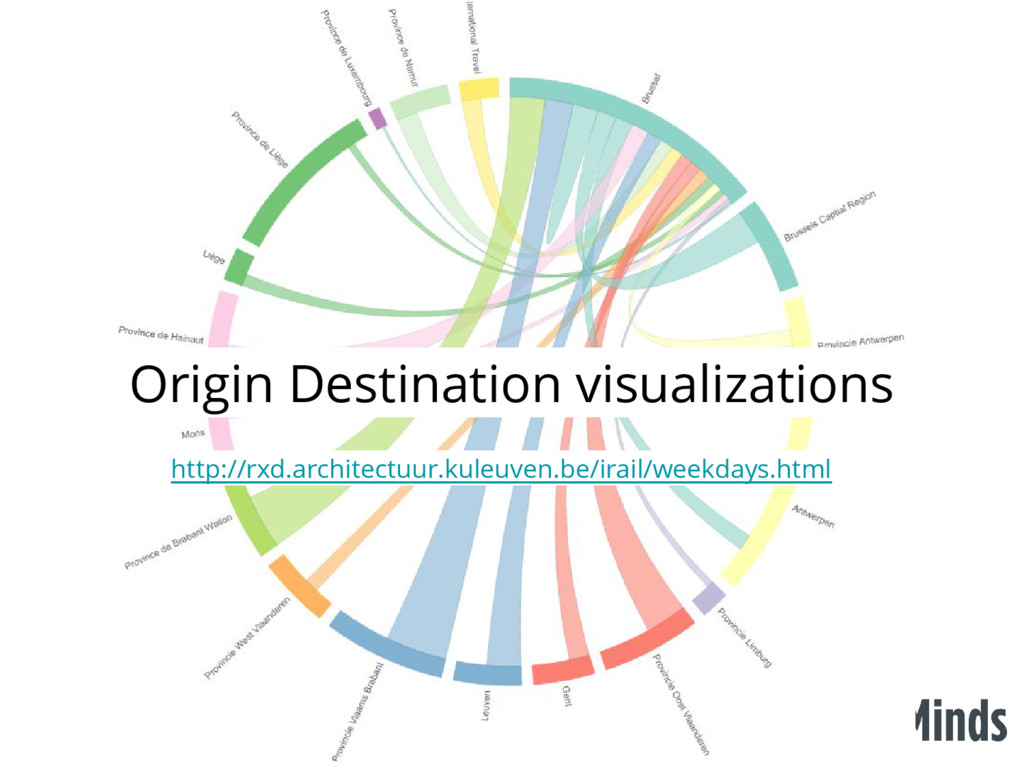
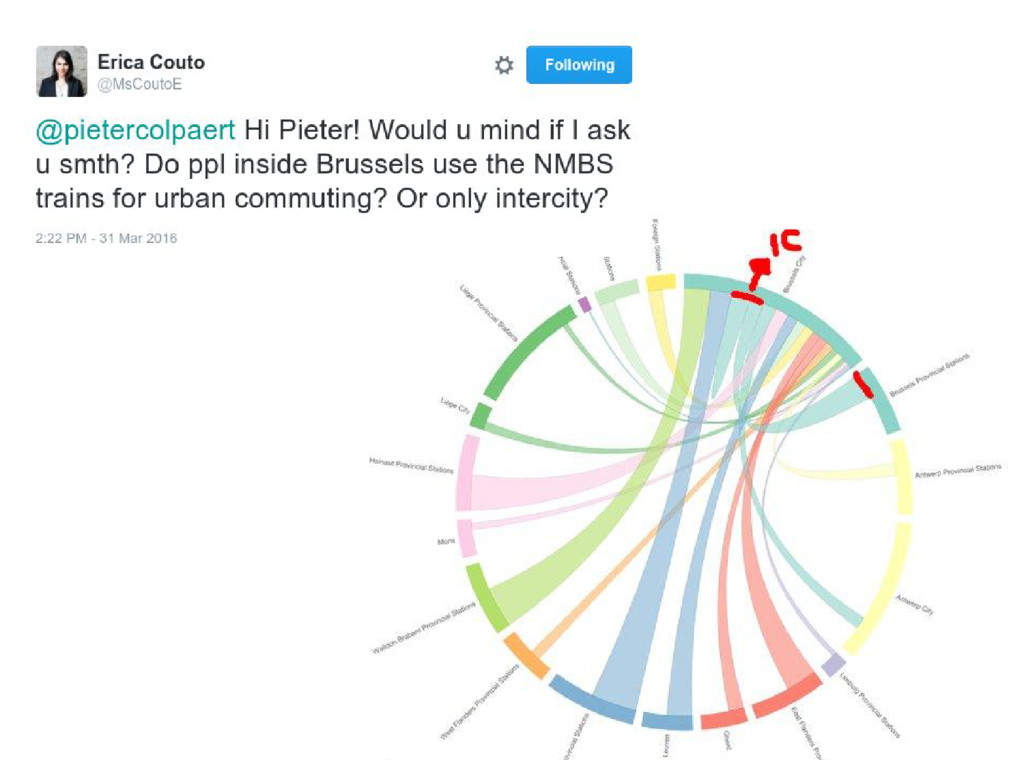
Interactive origin-destination visualization: http://rxd.architectuur.kuleuven.be/irail/weekdays.html

Full paper: http://usewod.org/files/workshops/2016/papers/paper.pdf
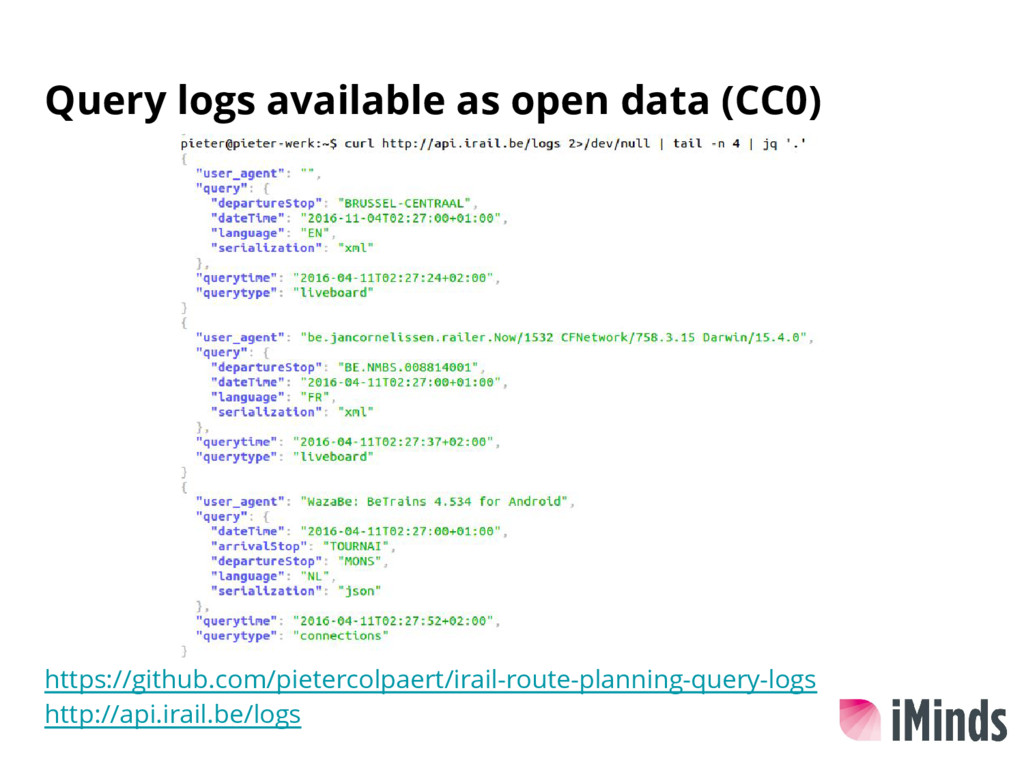
iRail query logs:
- Historic: http://gtfs.irail.be/nmbs/querylogs
- Real-time: http://api.irail.be/logs

Pieter Colpaert

April 11, 2016
Tweet

Transcript

  1. What query logs tell us about travel flows Pieter Colpaert,

    Alvin Chua, Ruben Verborgh, Erik Mannens, Rik Van de Walle and Andrew Vande Moere
  2. Can we use the query logs of a public transit

    route planning API as an indication of travel demand?
  3. Need for evidence based mobility policy Is the offer correctly

    adapted to the demand? * Source: planned train schedules GTFS at http://gtfs.irail.be ** Not taking into account the train composition: no data available
  4. Why query logs? Contain origin, destination and desired time of

    departure → Predict near future, not only current state Belgian railways don’t have check-in/check-out system Many tickets not digital (Go/Rail-Pass, student pass, ...) Query logs are cheap in comparison to mobility studies
  5. The iRail project “A hackerspace for a better transport experience

    in Belgium” iRail hosts: • data dumps http://gtfs.irail.be • a route planning API for anyone to prototype with http://api.irail.be
  6. ~100% increase in April Official app discontinued in favour of

    other official app → the iRail alternatives gained traction
  7. And more smaller ones Plenty of different apps and code

    snippets for different platforms… Github search:
  8. What’s the max size of our sample? In best case:

    1 query == 1 intention ~4*10^5 travel intentions captured /month Estimated n° of passengers per month in 2015: ~2*10^7 (source: statistics Belgium) ⇒ max 2% of travelers plan using iRail
  9. (2) People look up their train earlier on days we

    also expect more people to go home earlier
  10. Conclusion In the iRail query logs, we find patterns that

    correspond to real demand The origin destination visualization shows Belgium as a star-shaped network with Brussels at the center
  11. Inconclusion Cannot tell how good of a representation this data

    is. Treat this data with caution. Offer deficit vs. the demand? Cannot tell as we don’t know train composition, and maybe people are looking up their train earlier?