in survival Background extinction and expected differences in species survival Interplay between extinction intensity and extinction selectivity Patterns in functional diversity Mammal species pool functional composition Conclusions and commentary 2 / 74
in survival Background extinction and expected differences in species survival Interplay between extinction intensity and extinction selectivity Patterns in functional diversity Mammal species pool functional composition Conclusions and commentary 3 / 74
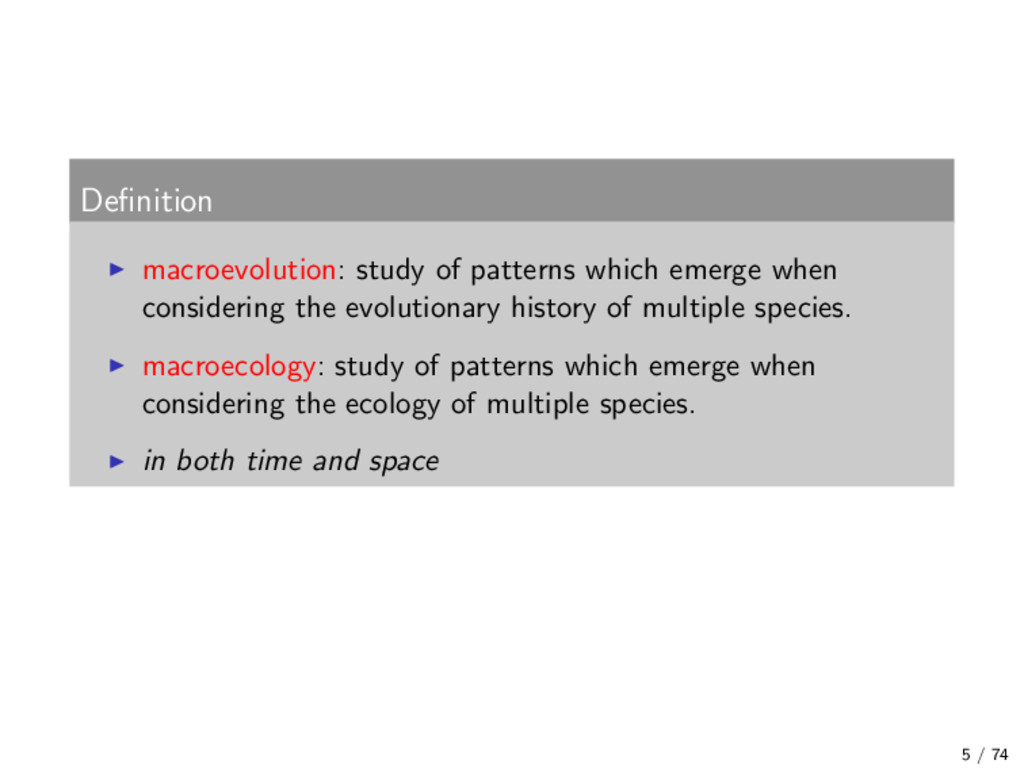
evolutionary history of multiple species. macroecology: study of patterns which emerge when considering the ecology of multiple species. in both time and space 5 / 74
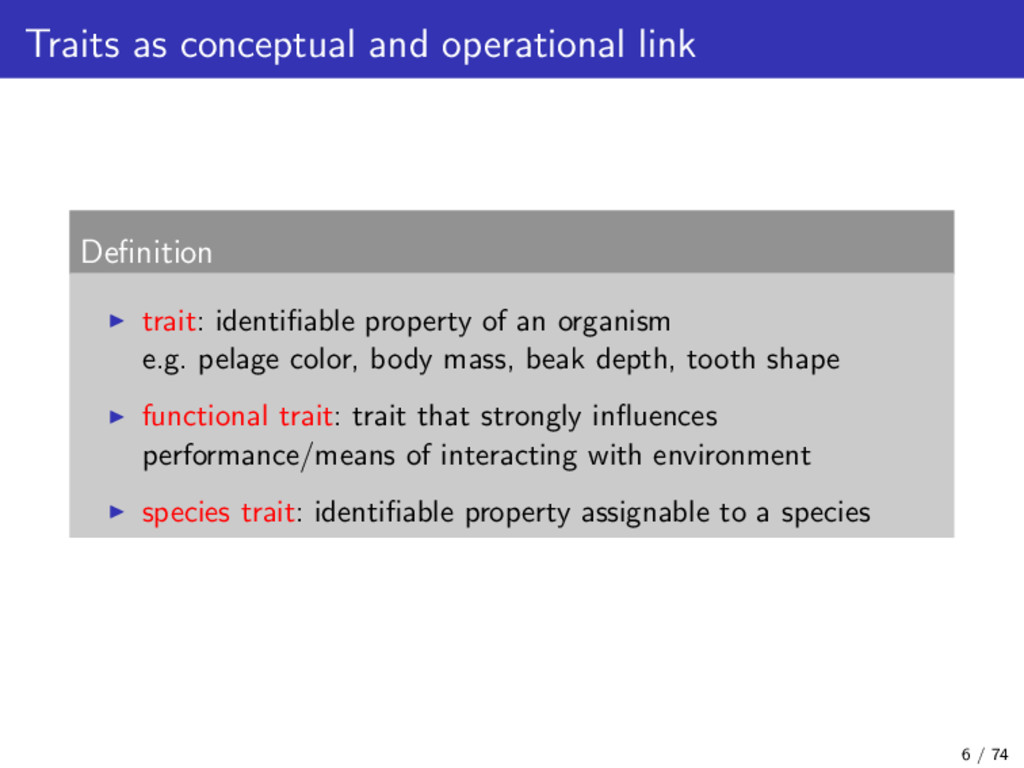
of an organism e.g. pelage color, body mass, beak depth, tooth shape functional trait: trait that strongly influences performance/means of interacting with environment species trait: identifiable property assignable to a species 6 / 74
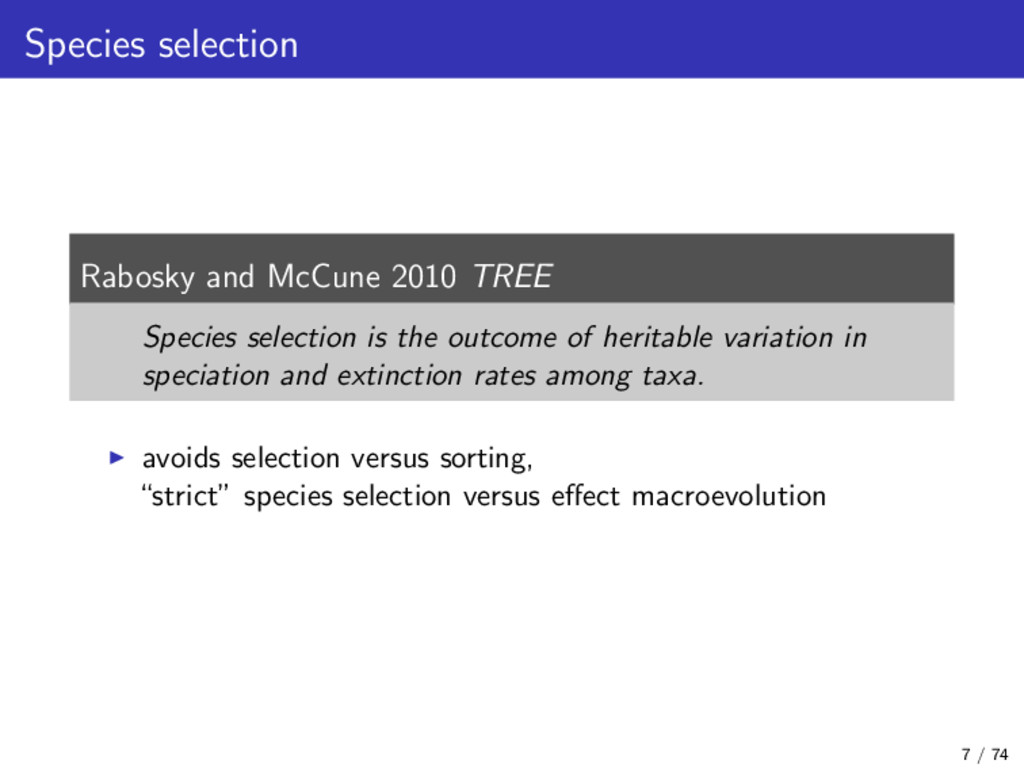
the outcome of heritable variation in speciation and extinction rates among taxa. avoids selection versus sorting, “strict” species selection versus effect macroevolution 7 / 74
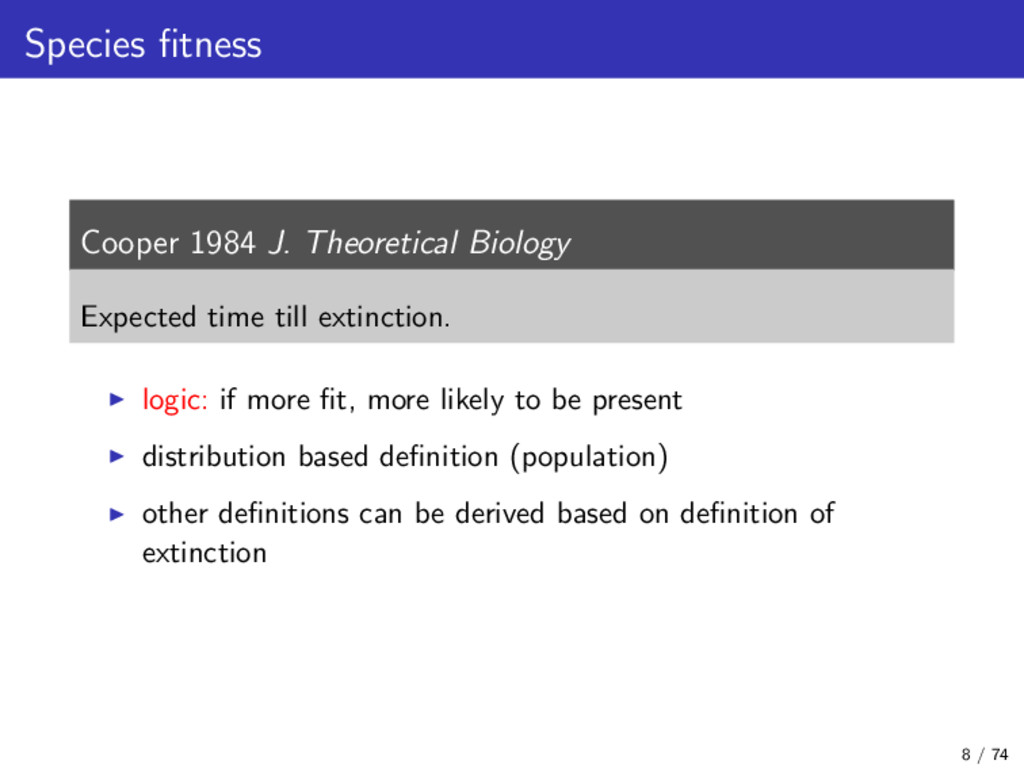
extinction. logic: if more fit, more likely to be present distribution based definition (population) other definitions can be derived based on definition of extinction 8 / 74
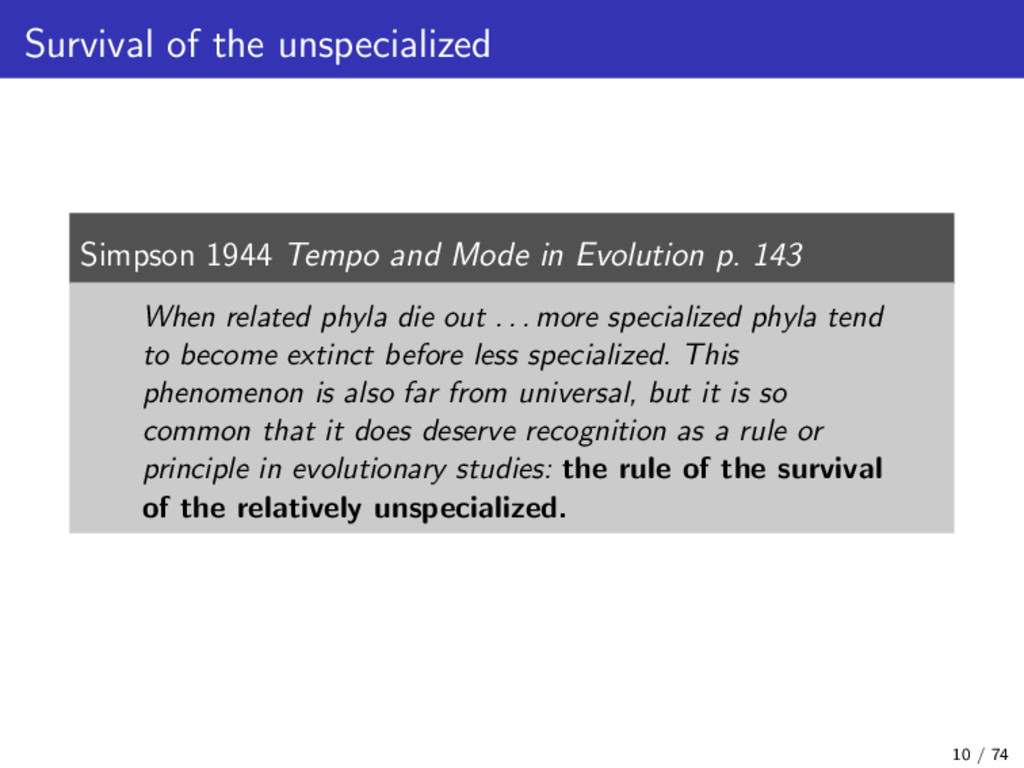
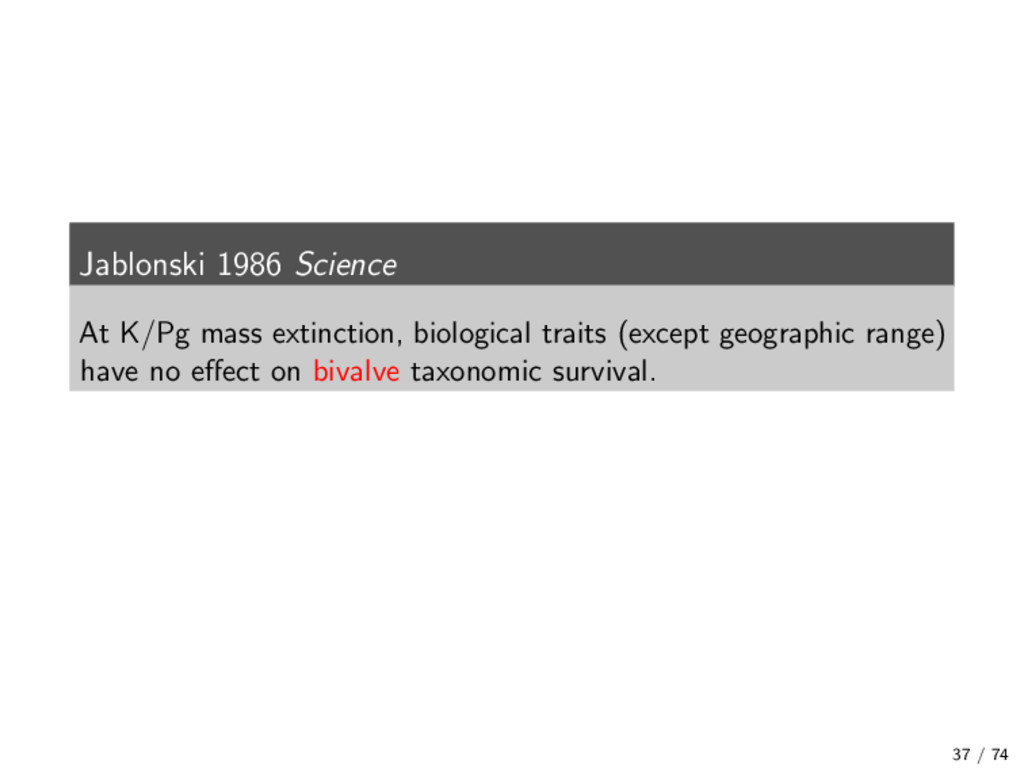
Evolution p. 143 When related phyla die out . . . more specialized phyla tend to become extinct before less specialized. This phenomenon is also far from universal, but it is so common that it does deserve recognition as a rule or principle in evolutionary studies: the rule of the survival of the relatively unspecialized. 10 / 74
in survival Background extinction and expected differences in species survival Interplay between extinction intensity and extinction selectivity Patterns in functional diversity Mammal species pool functional composition Conclusions and commentary 14 / 74
in survival Background extinction and expected differences in species survival Interplay between extinction intensity and extinction selectivity Patterns in functional diversity Mammal species pool functional composition Conclusions and commentary 21 / 74
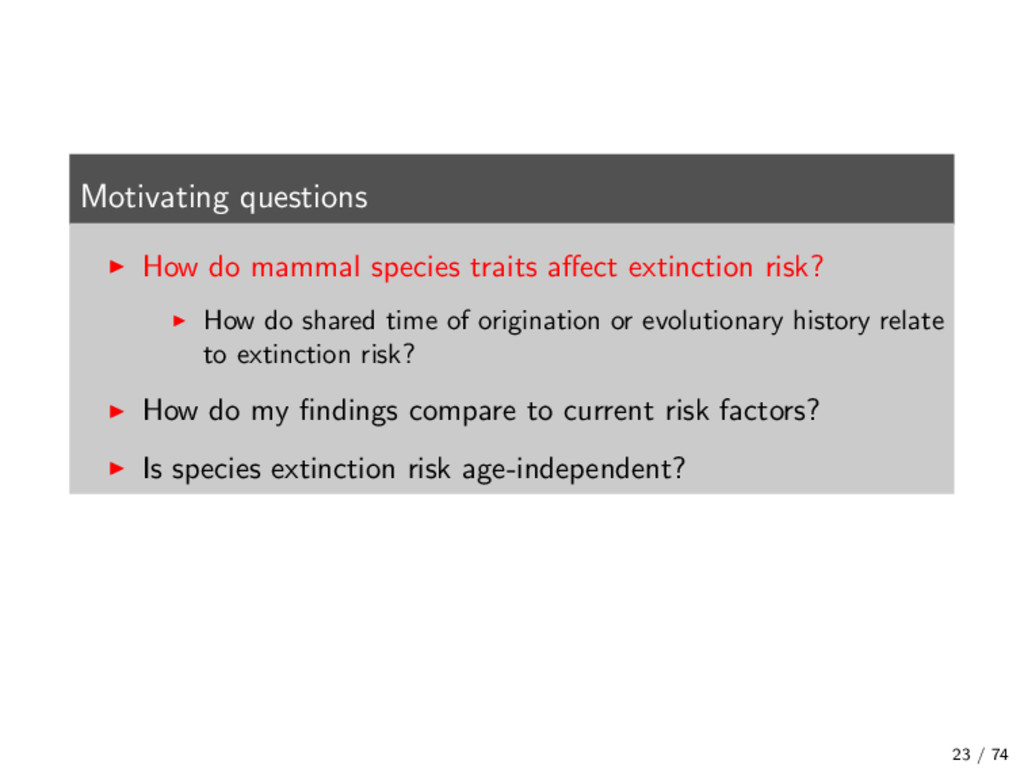
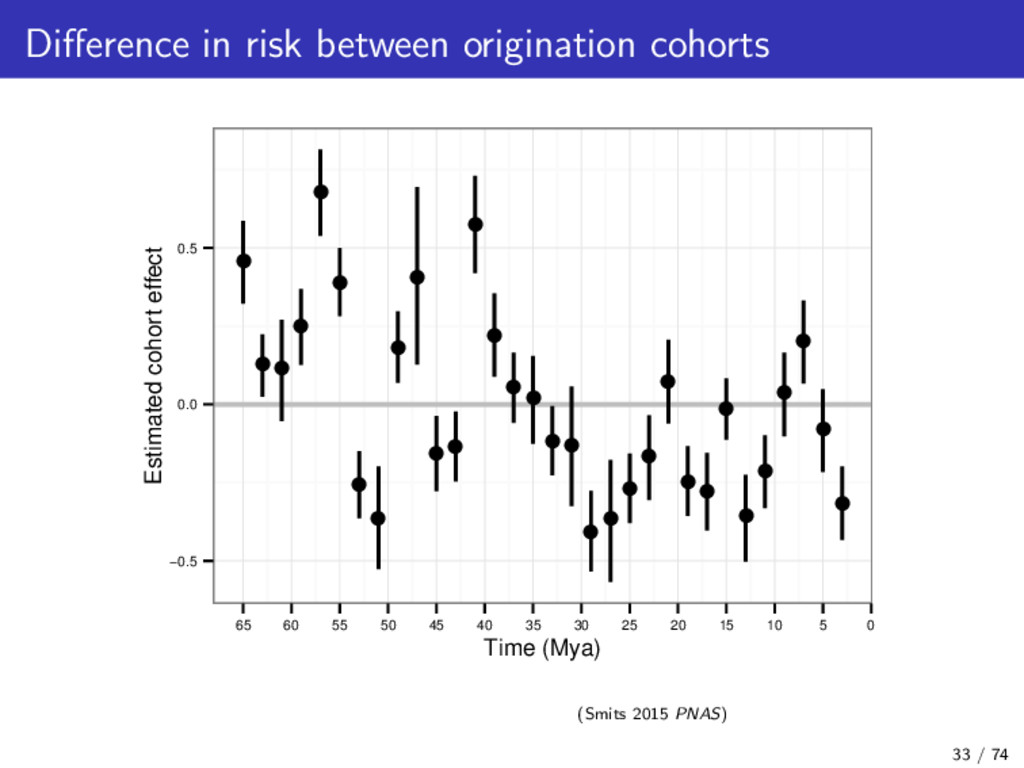
How do shared time of origination or evolutionary history relate to extinction risk? How do my findings compare to current risk factors? Is species extinction risk age-independent? 23 / 74
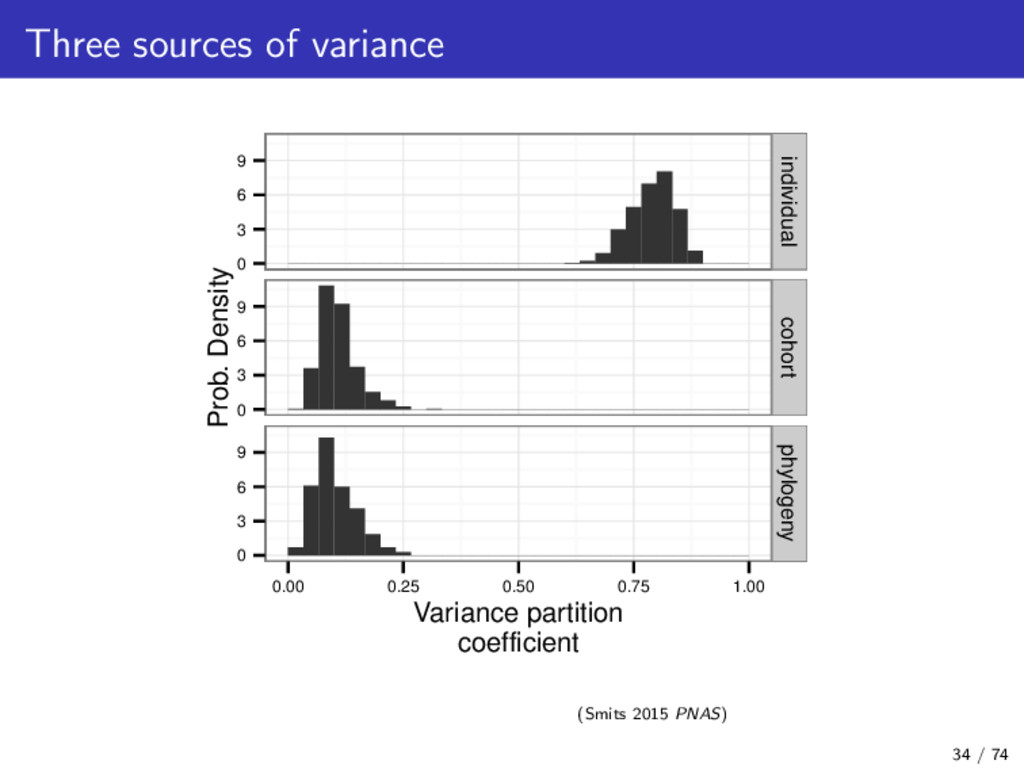
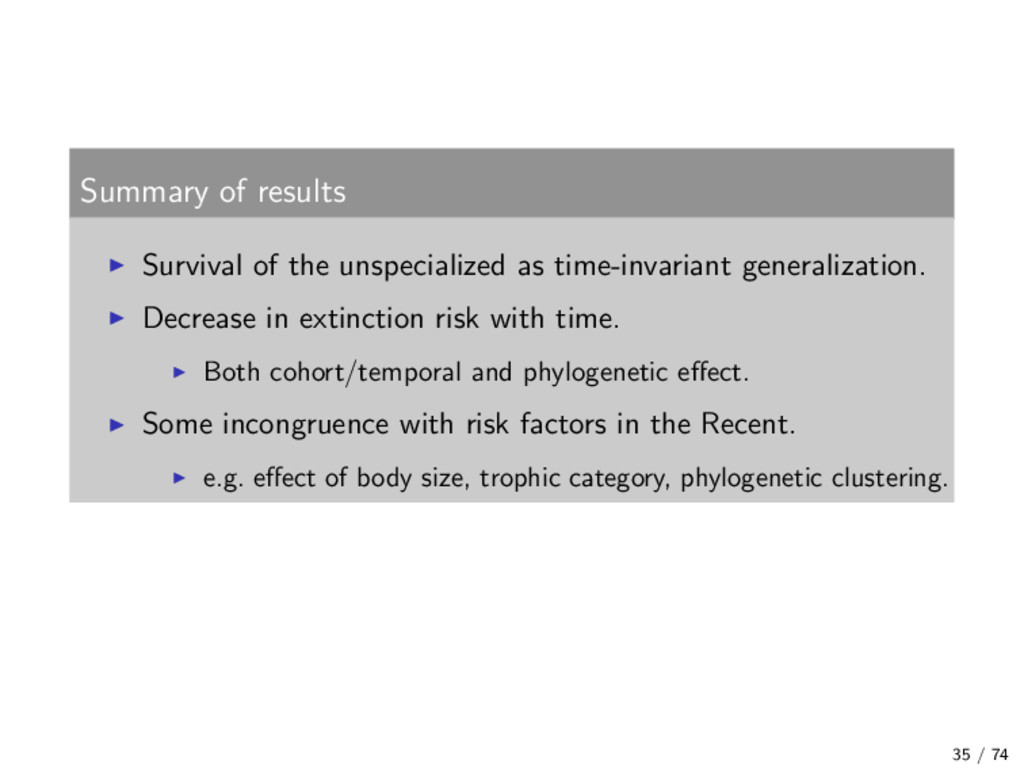
Decrease in extinction risk with time. Both cohort/temporal and phylogenetic effect. Some incongruence with risk factors in the Recent. e.g. effect of body size, trophic category, phylogenetic clustering. 35 / 74
in survival Background extinction and expected differences in species survival Interplay between extinction intensity and extinction selectivity Patterns in functional diversity Mammal species pool functional composition Conclusions and commentary 36 / 74
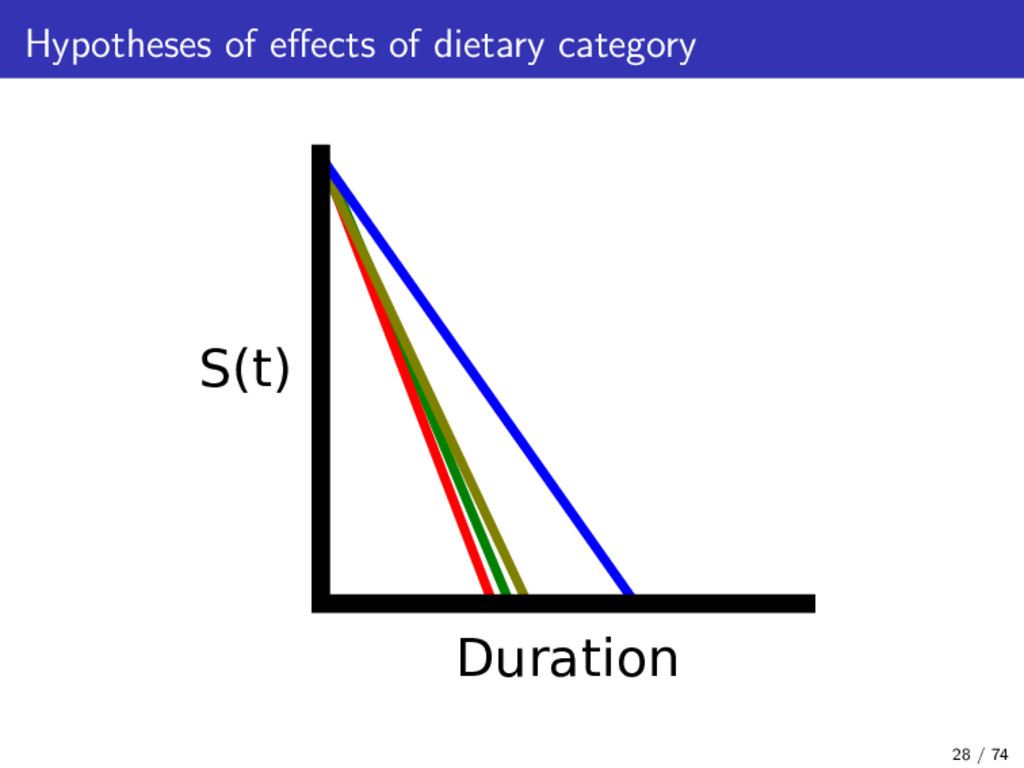
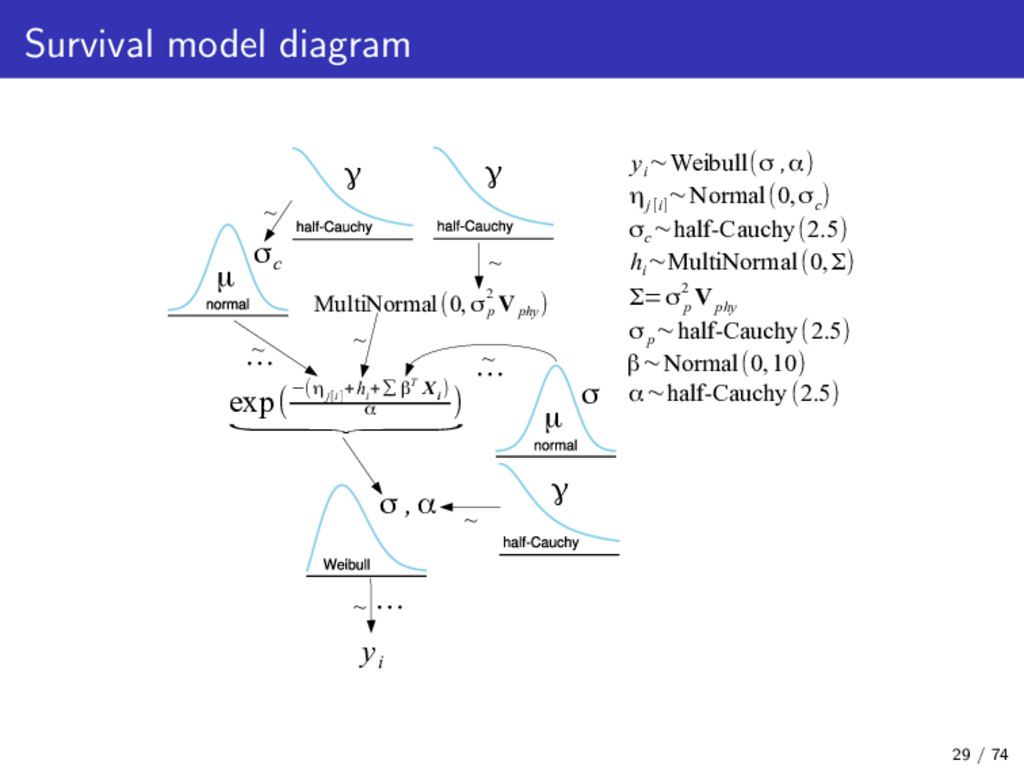
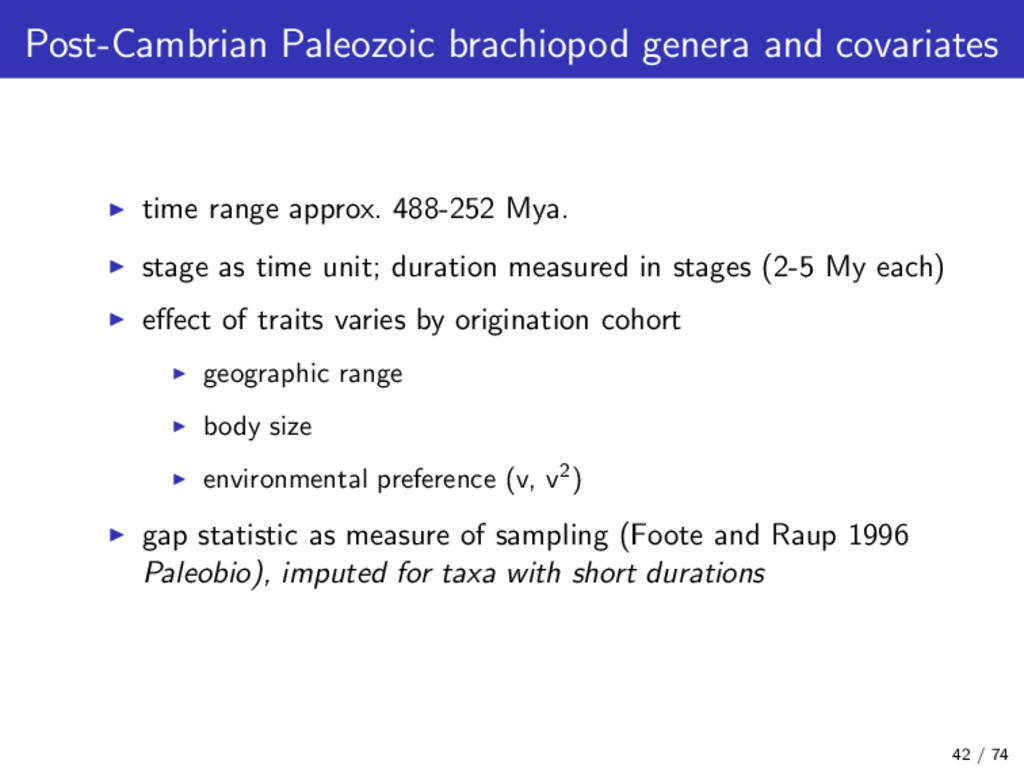
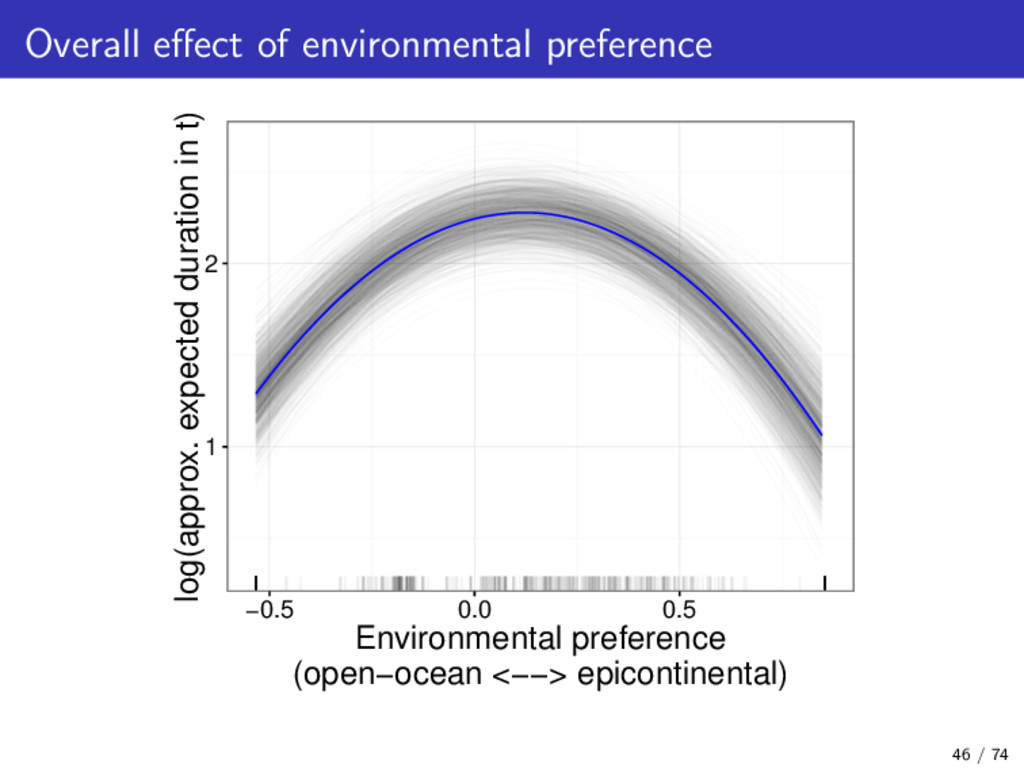
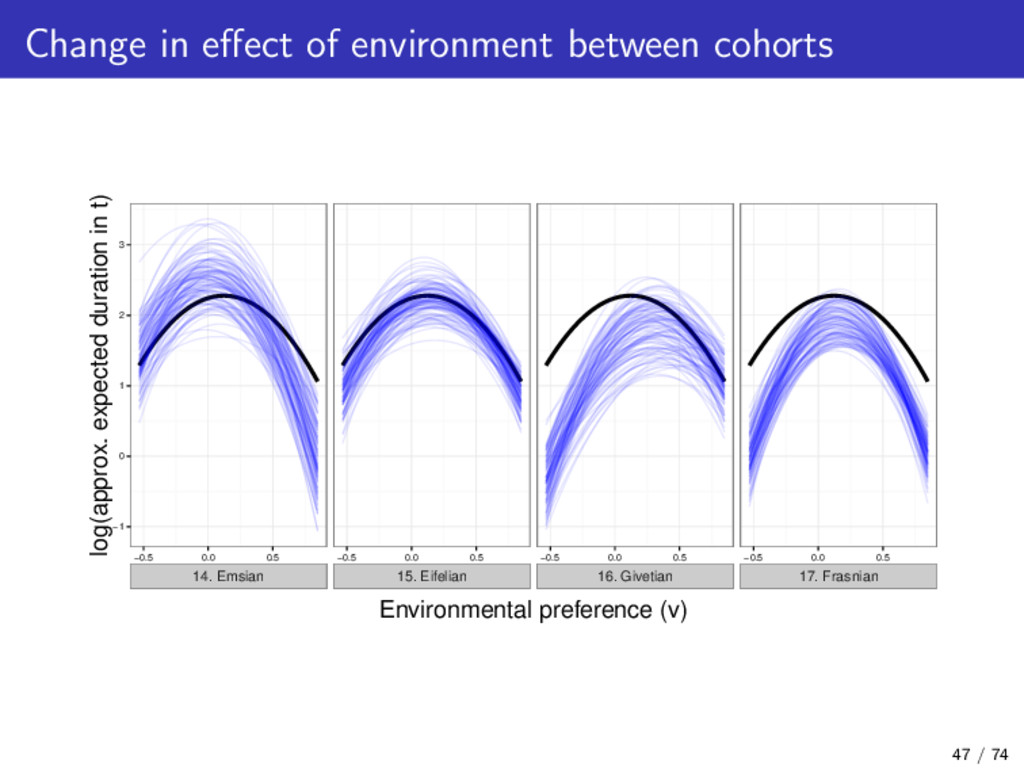
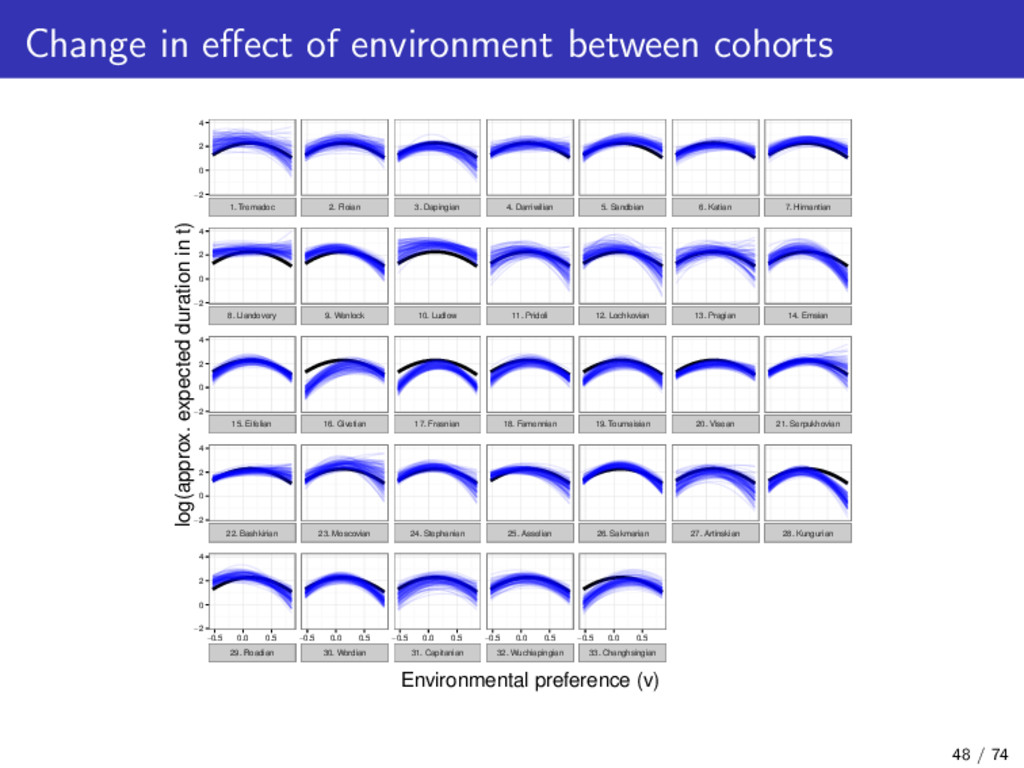
Mya. stage as time unit; duration measured in stages (2-5 My each) effect of traits varies by origination cohort geographic range body size environmental preference (v, v2) gap statistic as measure of sampling (Foote and Raup 1996 Paleobio), imputed for taxa with short durations 42 / 74
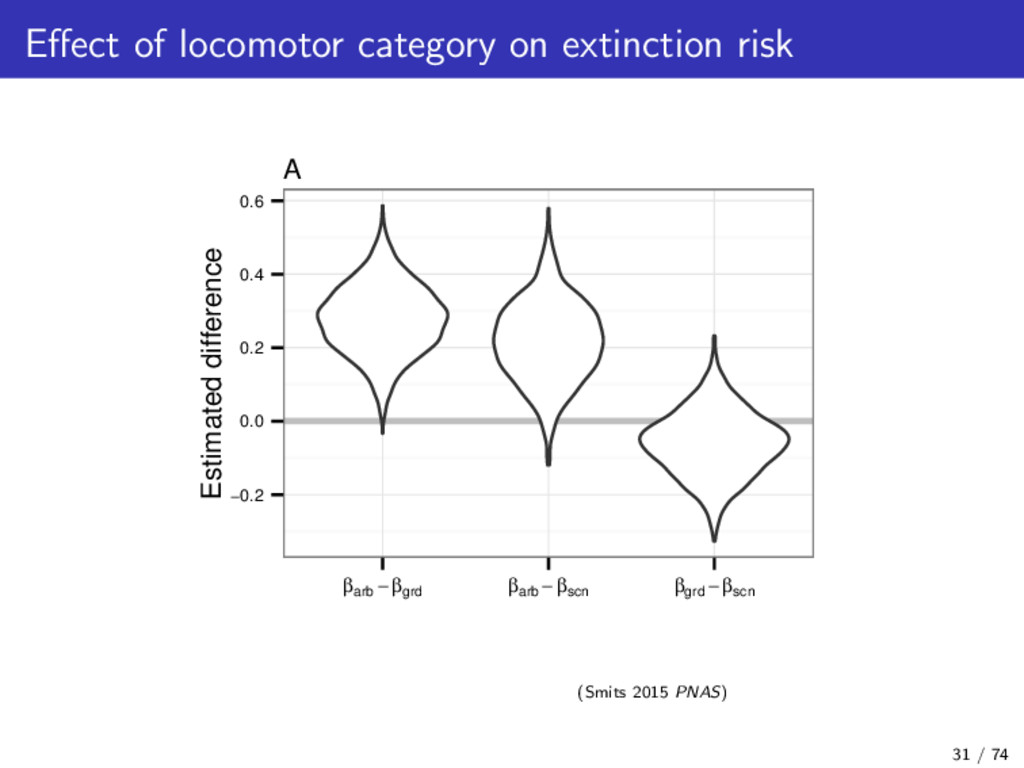
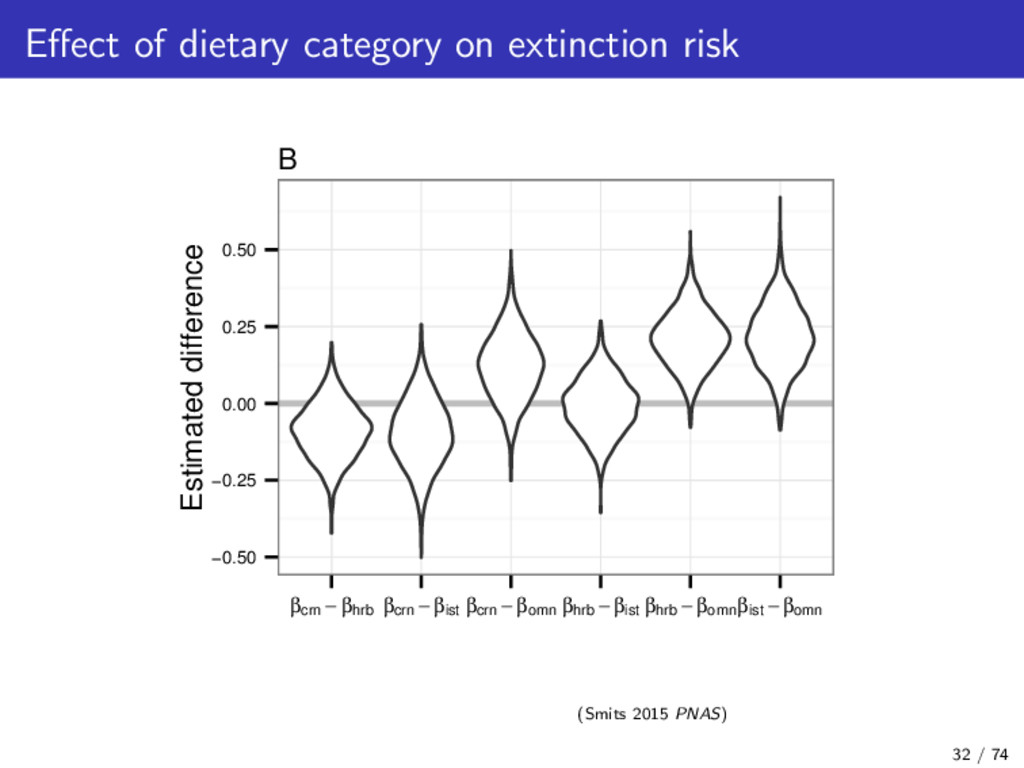
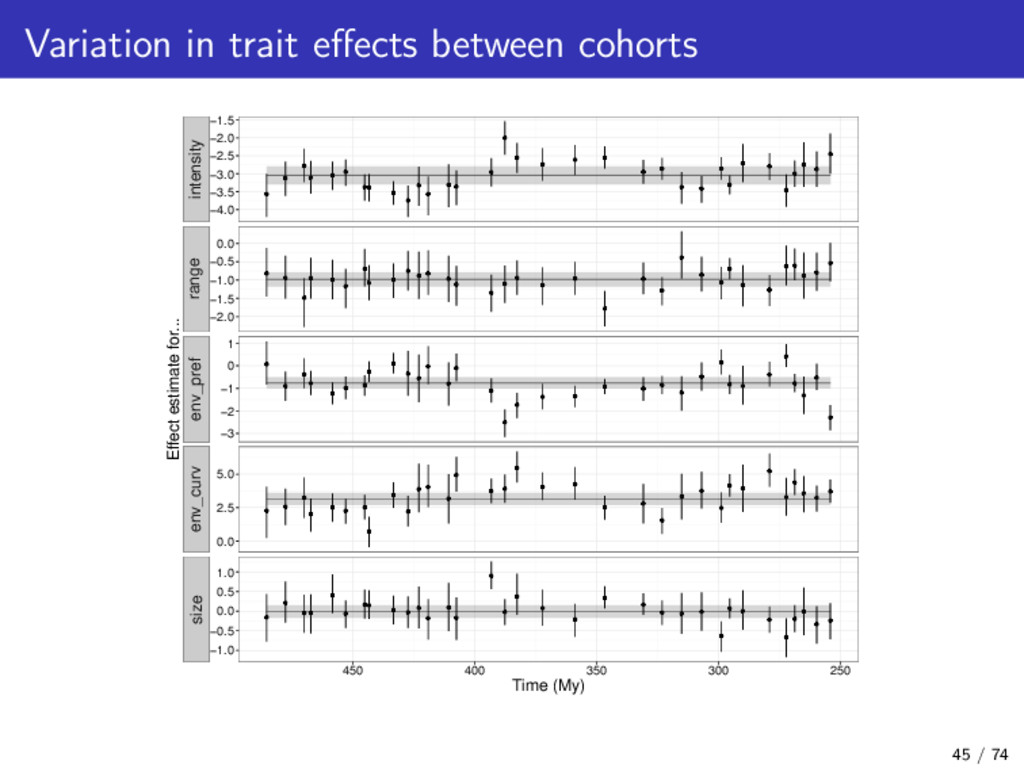
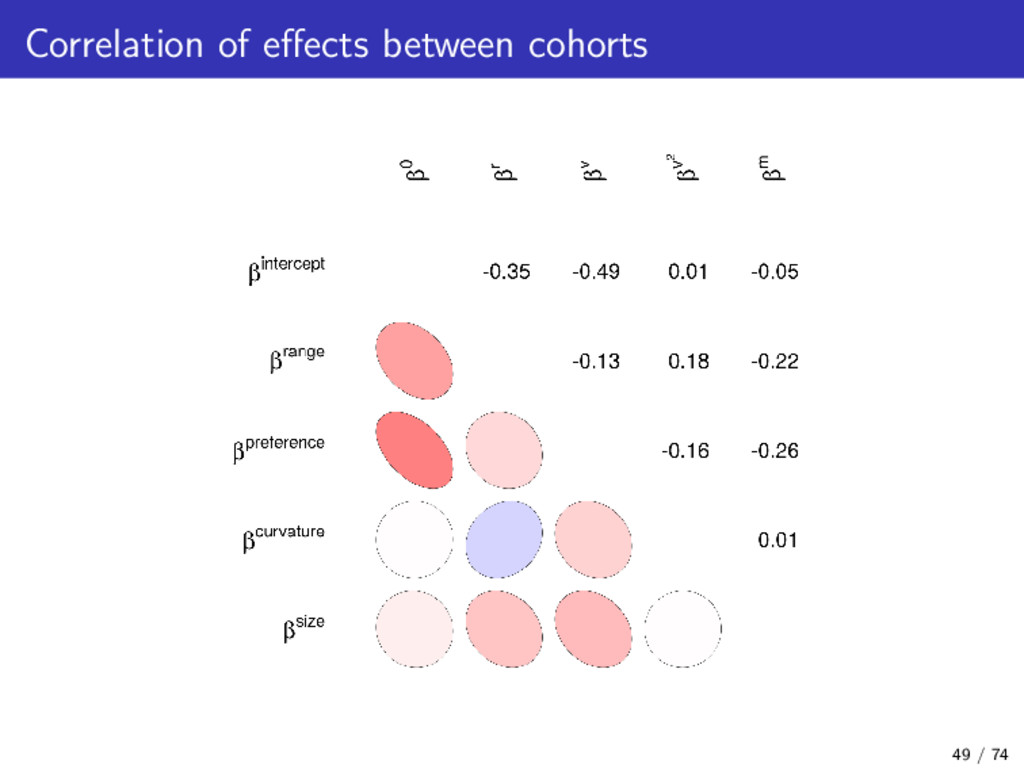
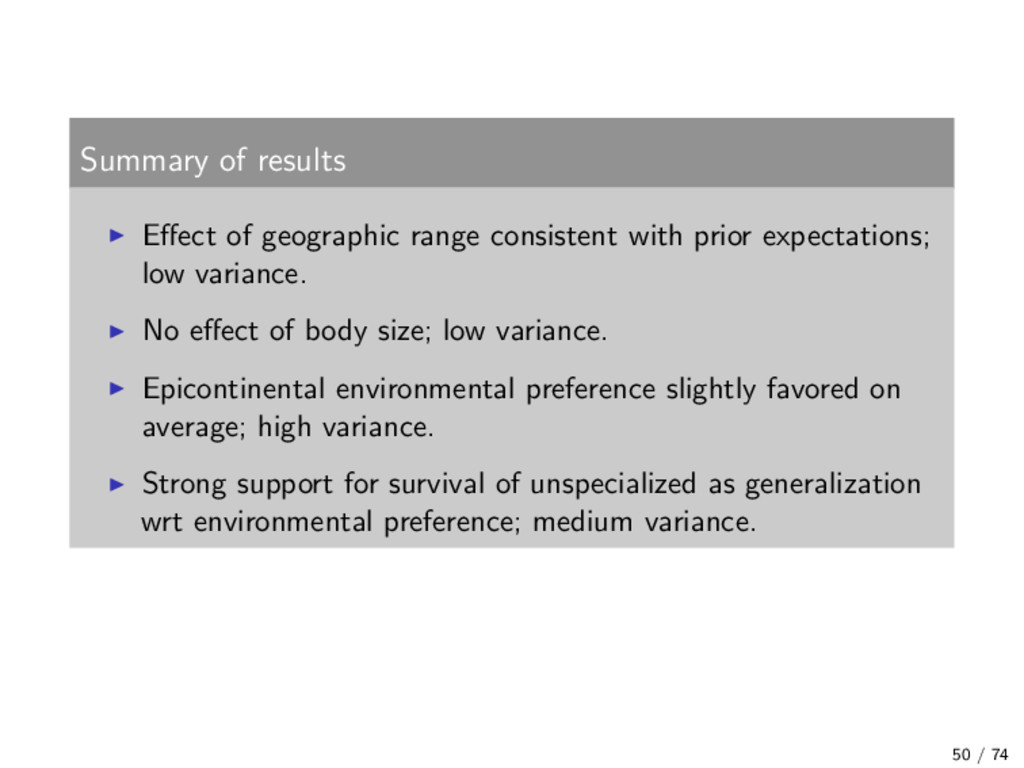
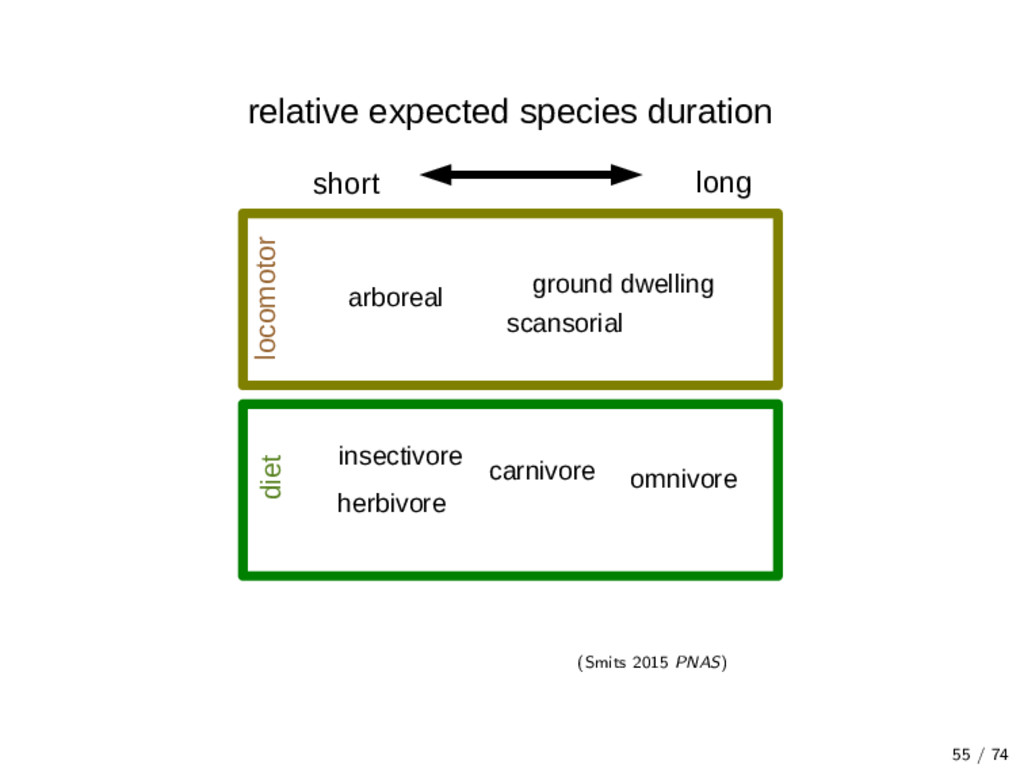
expectations; low variance. No effect of body size; low variance. Epicontinental environmental preference slightly favored on average; high variance. Strong support for survival of unspecialized as generalization wrt environmental preference; medium variance. 50 / 74
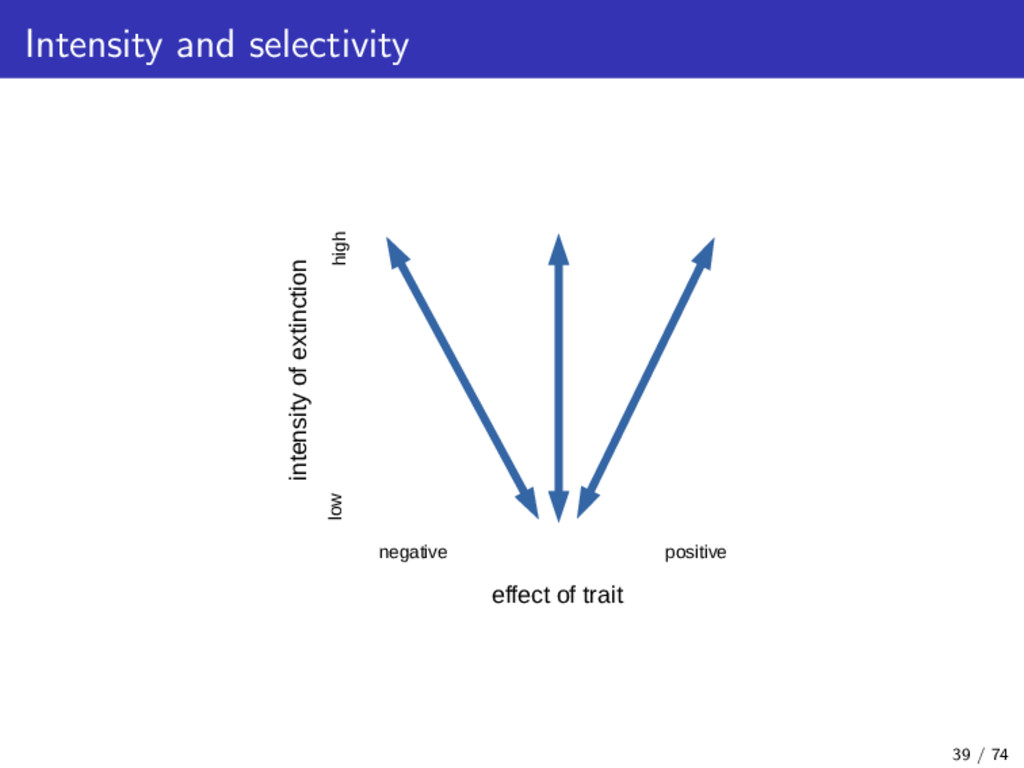
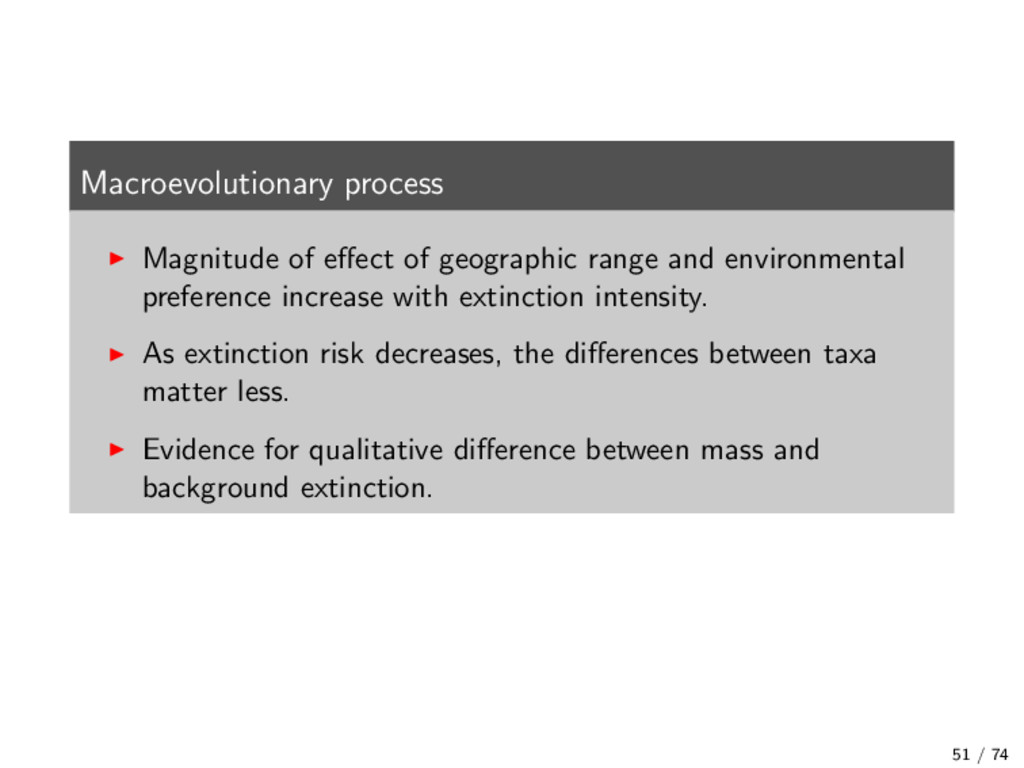
preference increase with extinction intensity. As extinction risk decreases, the differences between taxa matter less. Evidence for qualitative difference between mass and background extinction. 51 / 74
in survival Background extinction and expected differences in species survival Interplay between extinction intensity and extinction selectivity Patterns in functional diversity Mammal species pool functional composition Conclusions and commentary 52 / 74
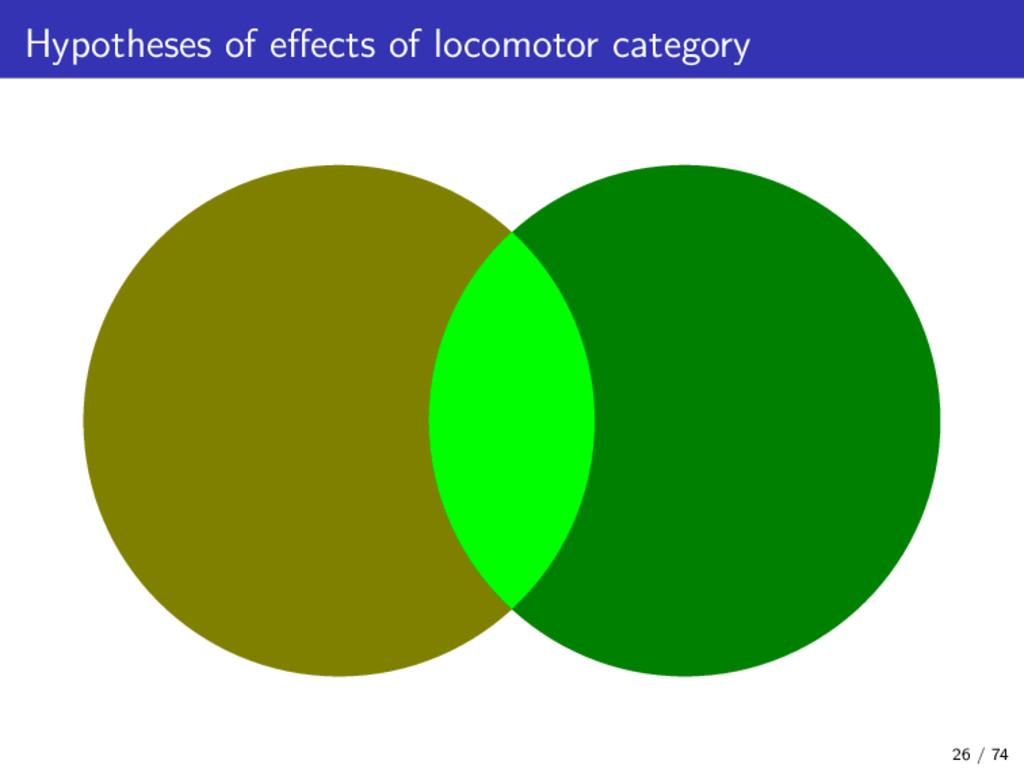
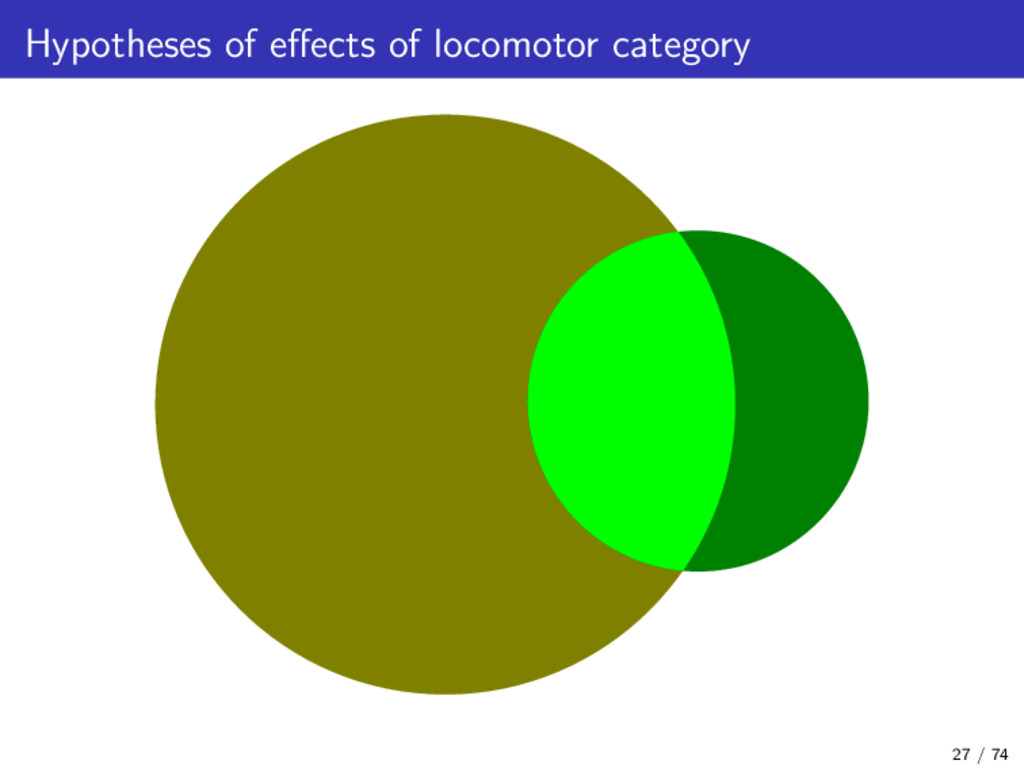
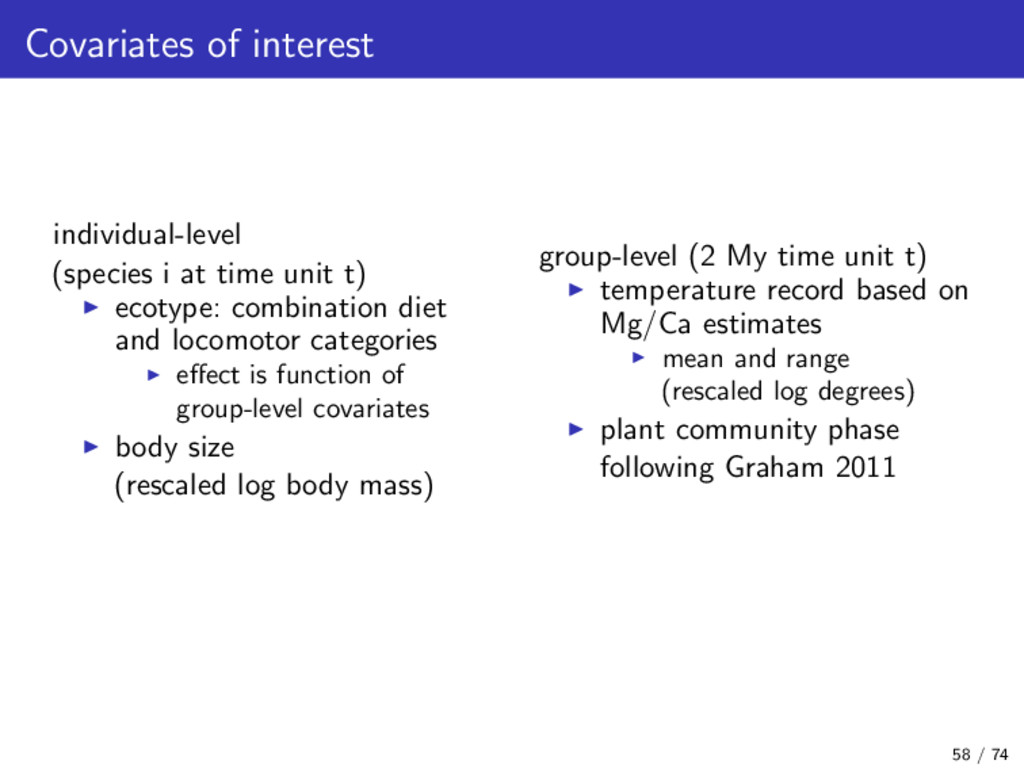
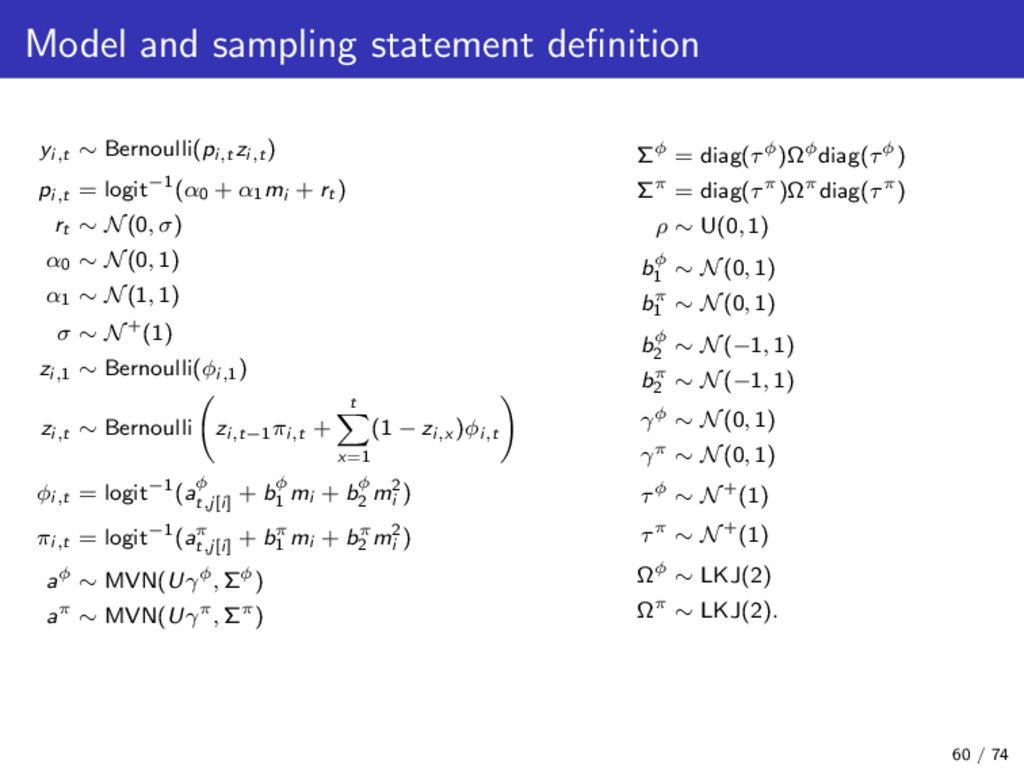
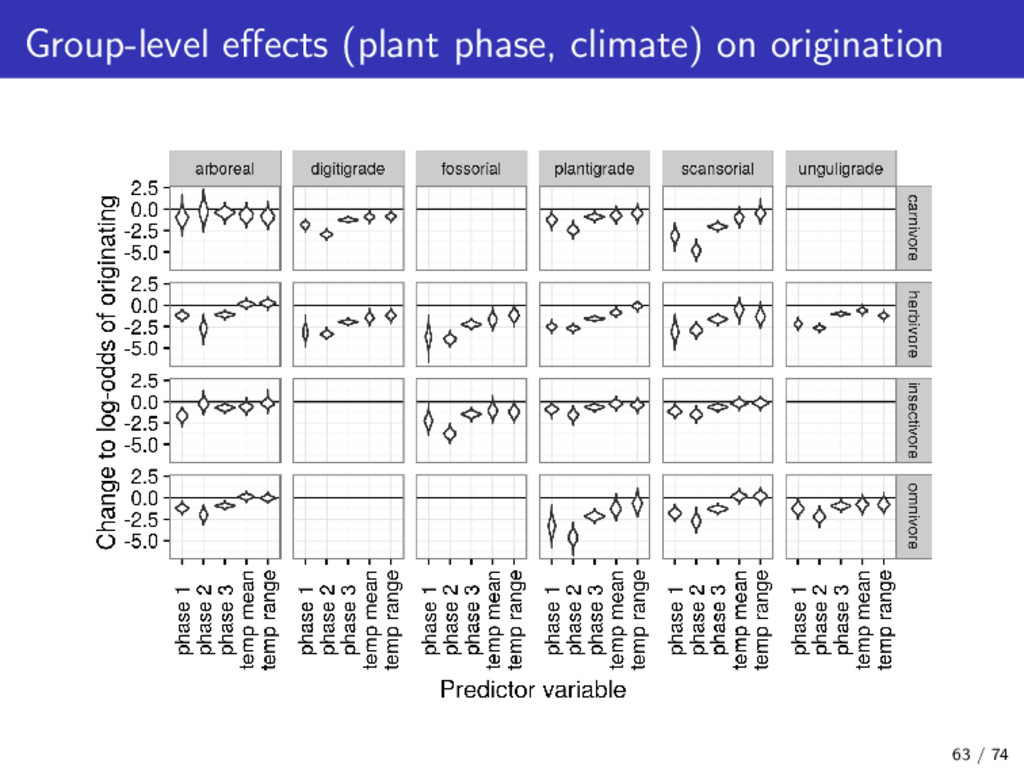
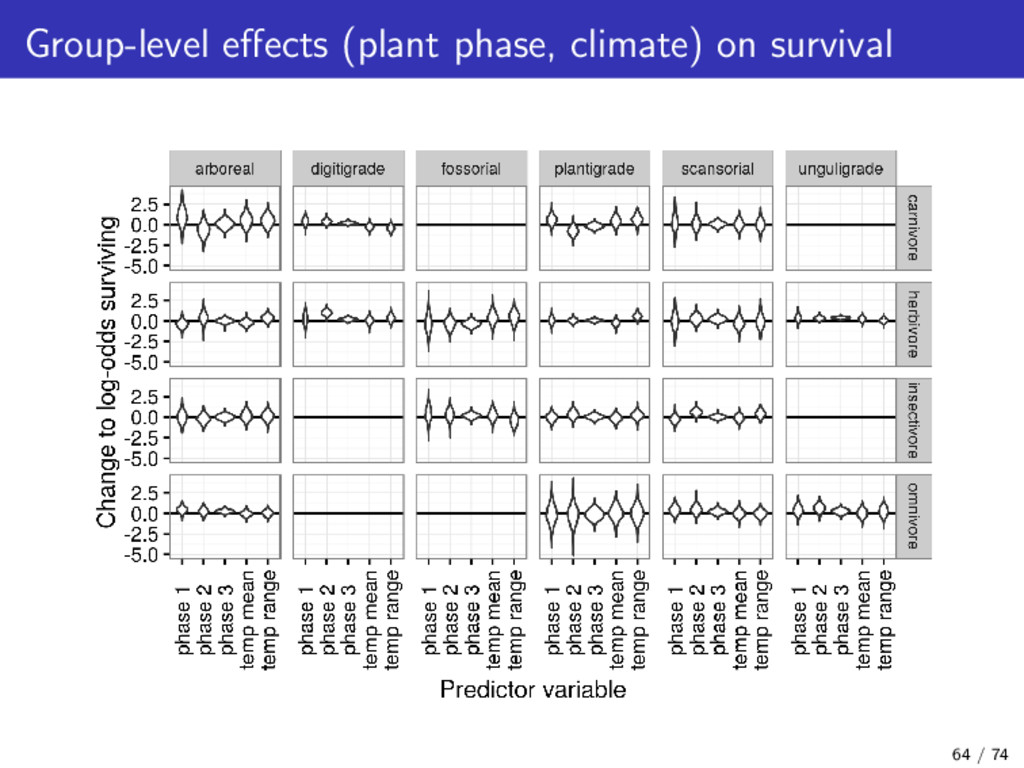
ecotype: combination diet and locomotor categories effect is function of group-level covariates body size (rescaled log body mass) group-level (2 My time unit t) temperature record based on Mg/Ca estimates mean and range (rescaled log degrees) plant community phase following Graham 2011 58 / 74
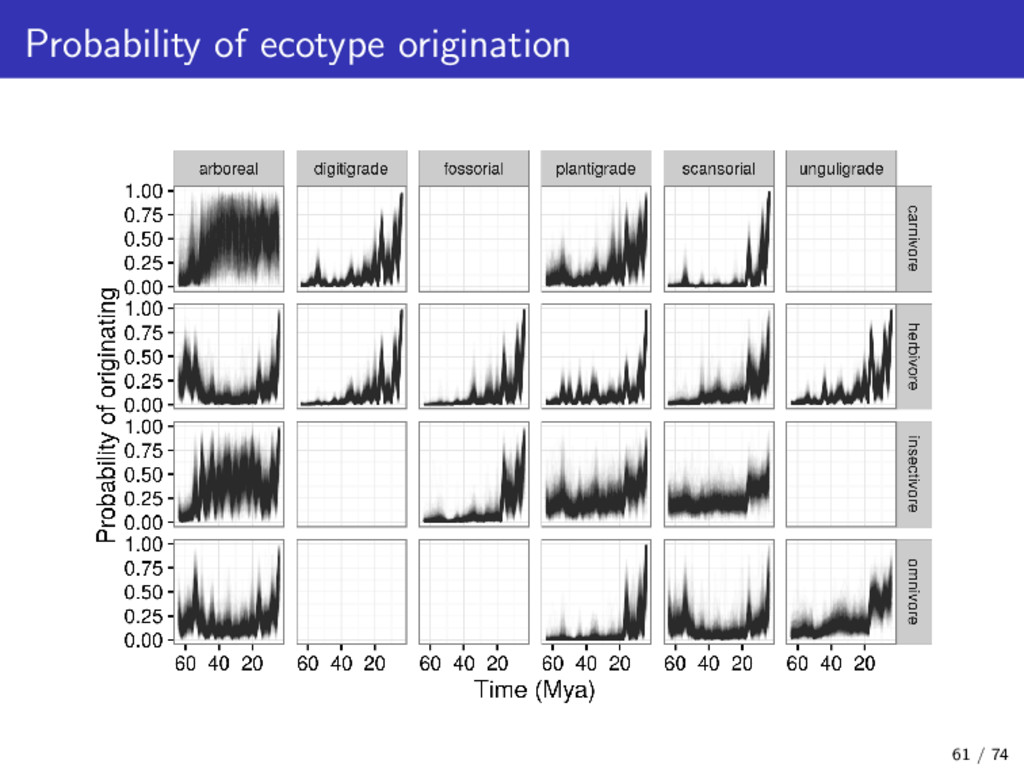
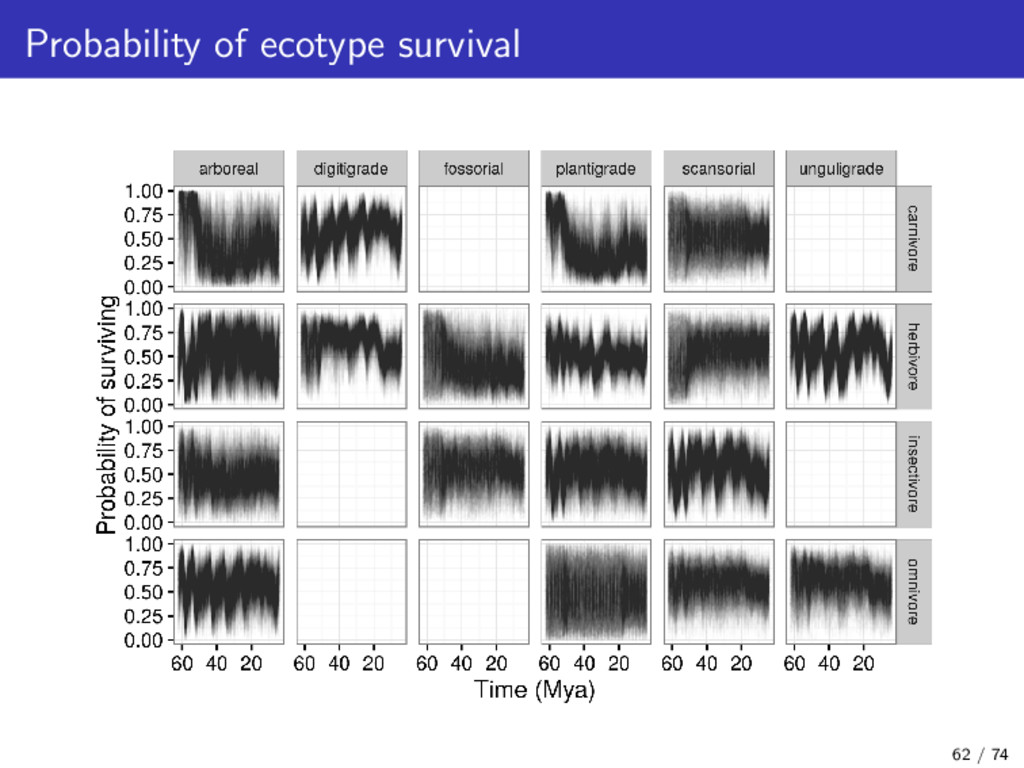
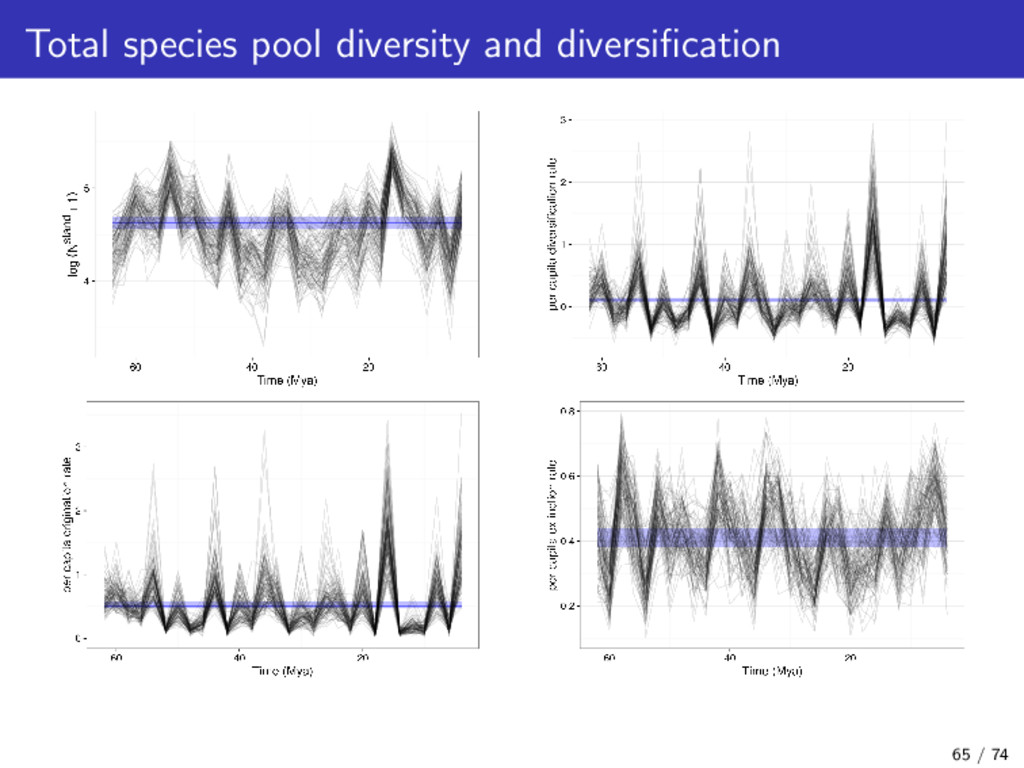
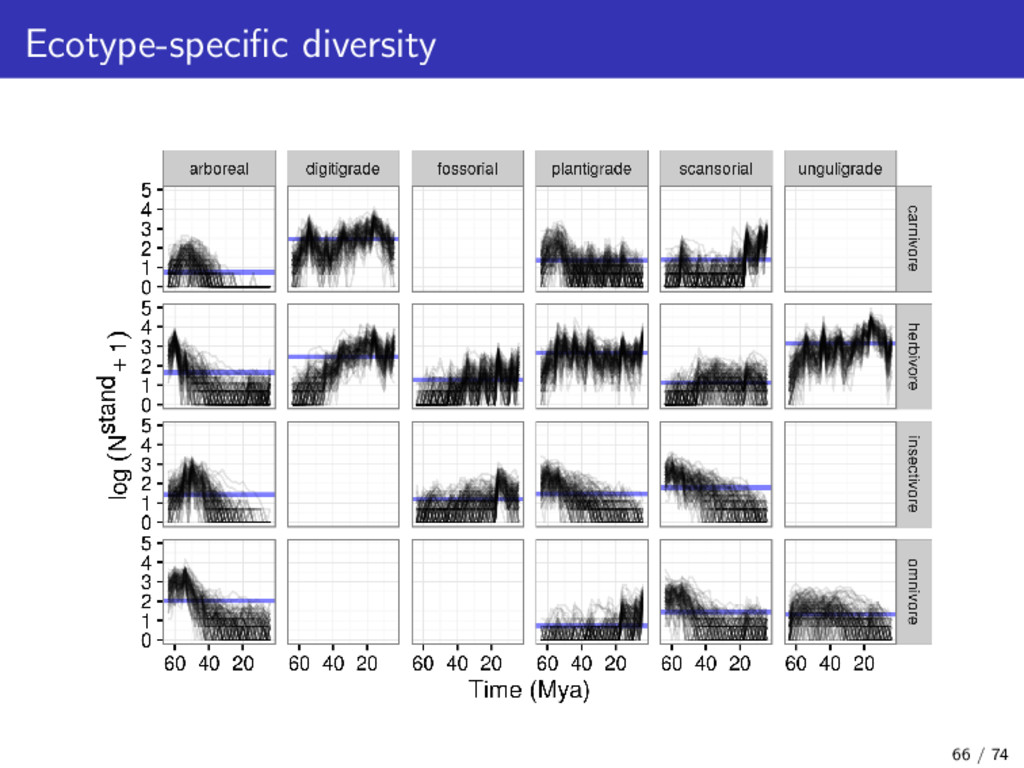
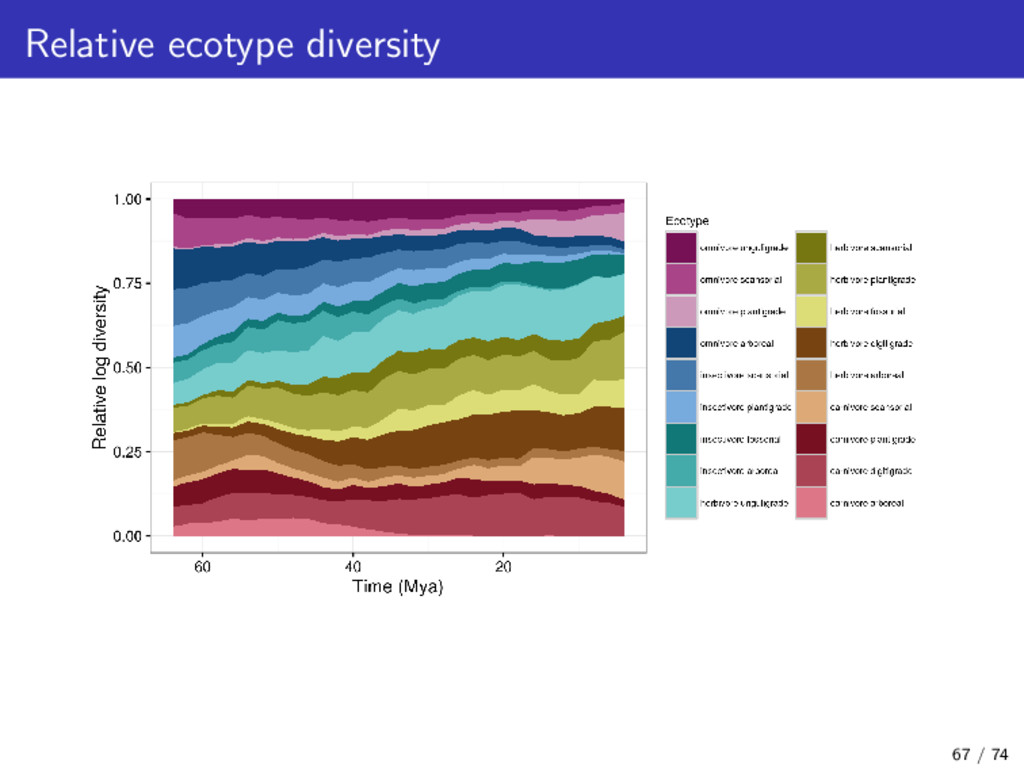
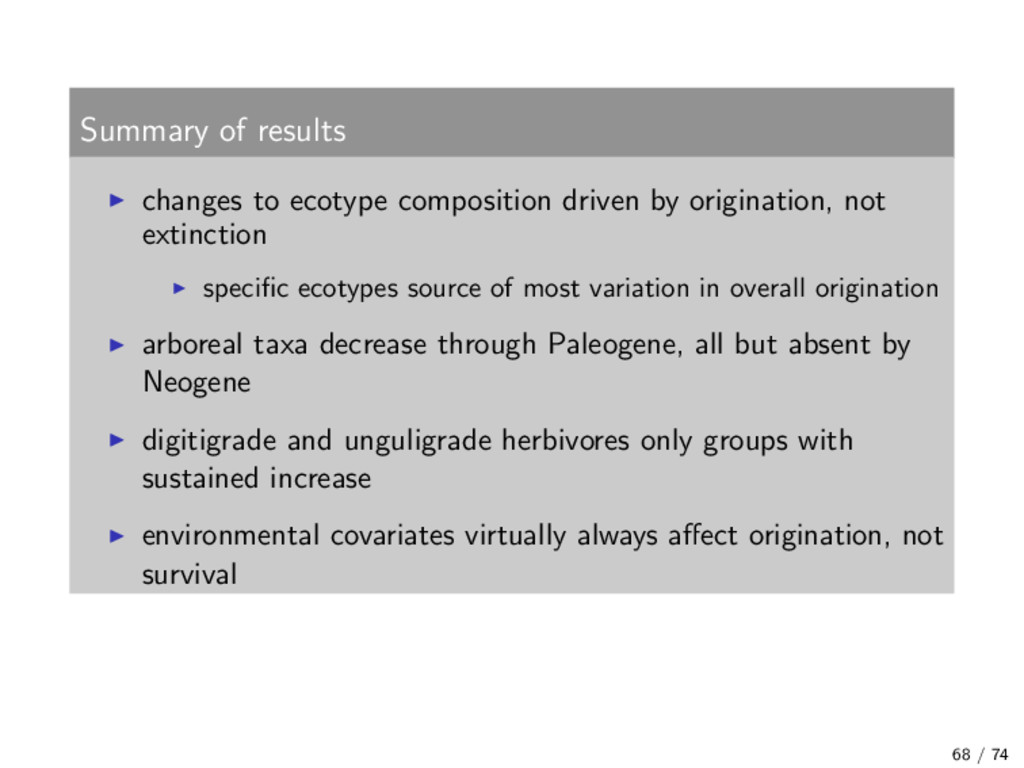
not extinction specific ecotypes source of most variation in overall origination arboreal taxa decrease through Paleogene, all but absent by Neogene digitigrade and unguligrade herbivores only groups with sustained increase environmental covariates virtually always affect origination, not survival 68 / 74
in survival Background extinction and expected differences in species survival Interplay between extinction intensity and extinction selectivity Patterns in functional diversity Mammal species pool functional composition Conclusions and commentary 69 / 74
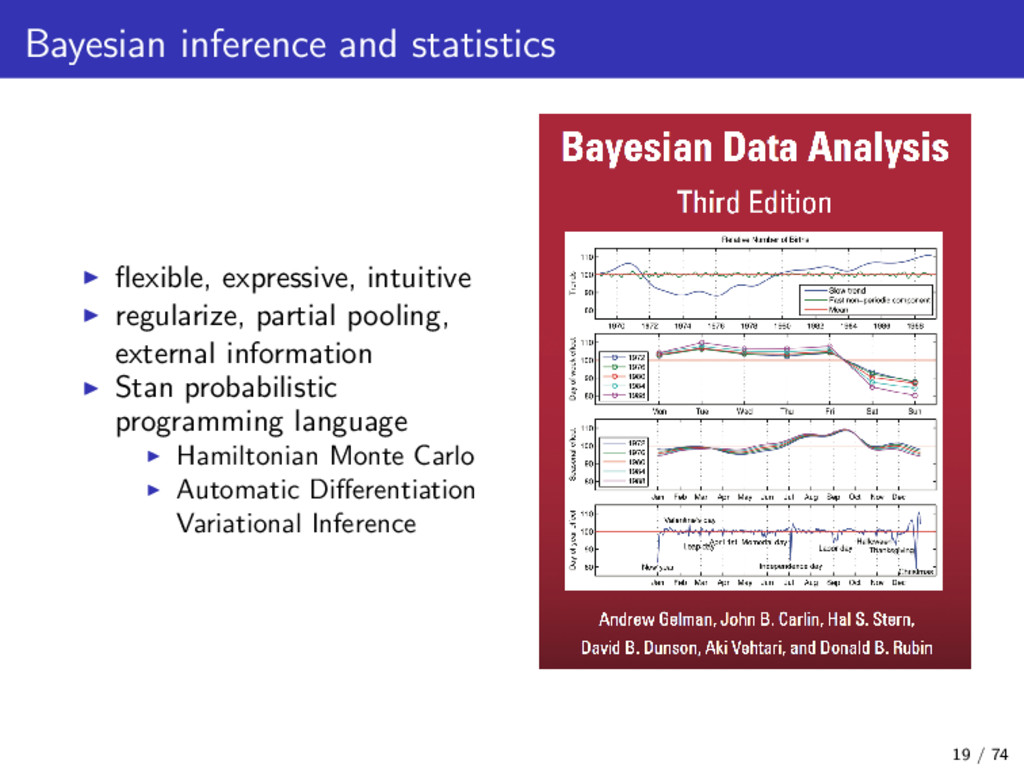
patterns in evolution and ecology emphasis on functional traits yields strong and intuitive results because of obvious selective importance Gelman: “big data are messy. messy data need large models. large models need Bayesian inference.” 70 / 74
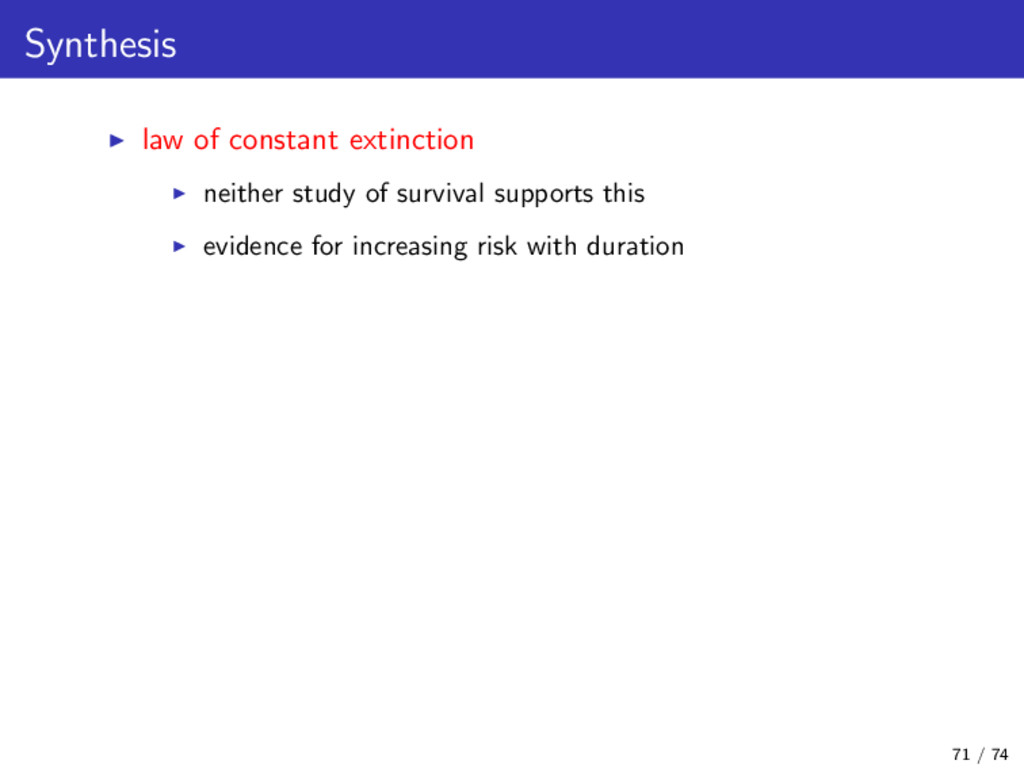
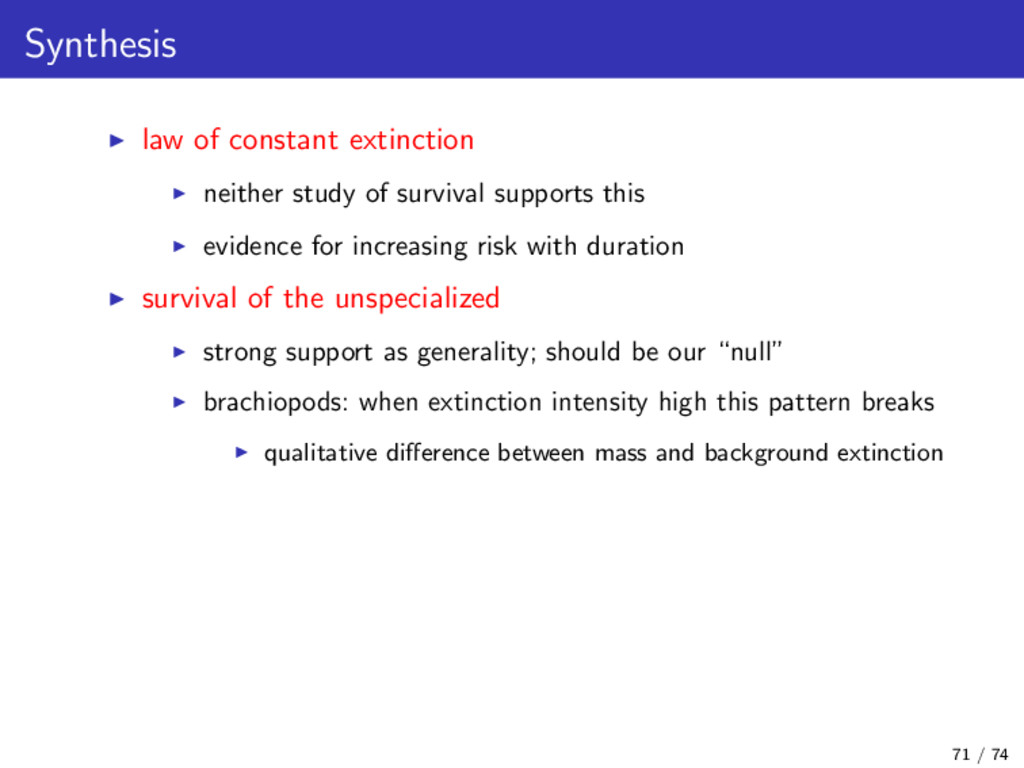
this evidence for increasing risk with duration survival of the unspecialized strong support as generality; should be our “null” brachiopods: when extinction intensity high this pattern breaks qualitative difference between mass and background extinction 71 / 74
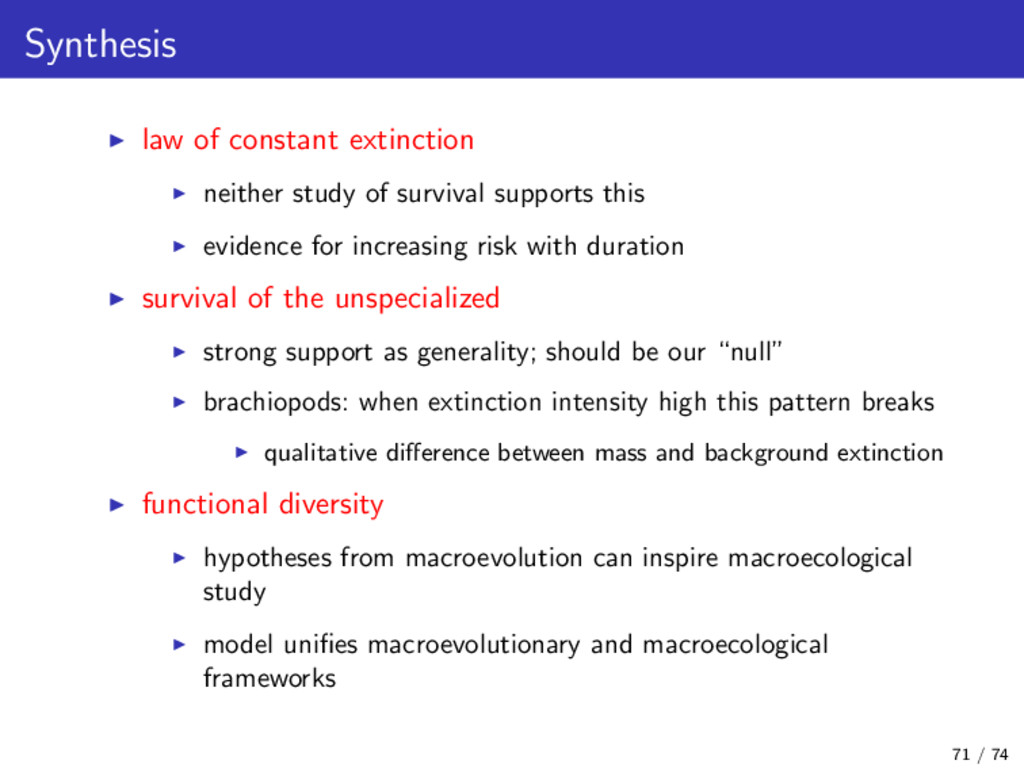
this evidence for increasing risk with duration survival of the unspecialized strong support as generality; should be our “null” brachiopods: when extinction intensity high this pattern breaks qualitative difference between mass and background extinction functional diversity hypotheses from macroevolution can inspire macroecological study model unifies macroevolutionary and macroecological frameworks 71 / 74
Mitchell Foote lab Marites Villarosa Garcia, Samuel Miller, Nadia Pierrehumbert, Kathleen Ritterbush Gregory Wilson Alistair Evans Jeff Bradley, Donald Grayson, Jim Kenagy, Nancy Simmons Sandy Carlson, Christine Janis Carolyn Johnson, Elizabeth Eakin 2012 Darwinian/Paleo cohorts Stewart Edie, Amy Henry, Katherine Silliman, Sarah Tulga, Max Winston Jessica Escott, Ben Frable, Brian Goodrich, Colin Kyle, Darcy Ross, Elizabeth Sander, Laura Southcott, Julie Symaszek, Brian Waligorski Jean Leahy 73 / 74
![Hierarchical survival model sampling E[taxon duration for cohort j] body](https://files.speakerdeck.com/presentations/09b2d067fc104fc1a2cca7a8f4cde9f5/slide_42.jpg)