Upgrade to Pro — share decks privately, control downloads, hide ads and more …

New spatial abundance models inform distribution, population, and trends for forest birds in Canada

Peter Solymos
October 08, 2020

New spatial abundance models inform distribution, population, and trends for forest birds in Canada

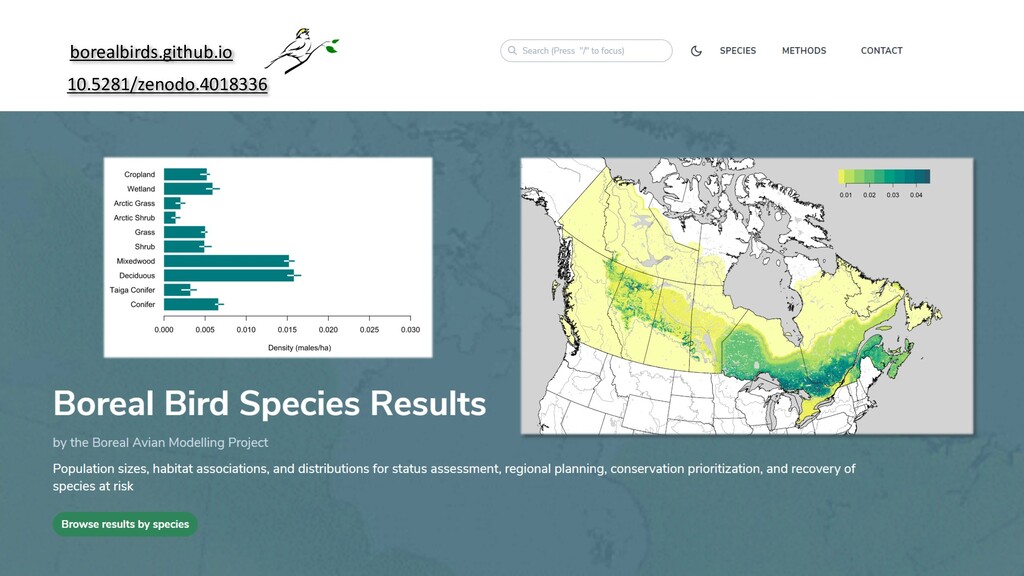
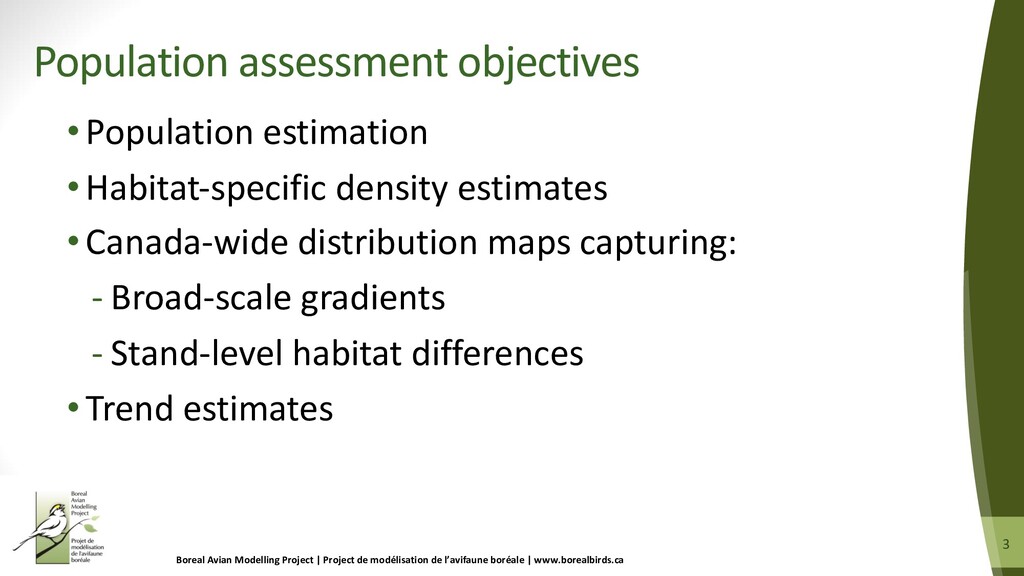
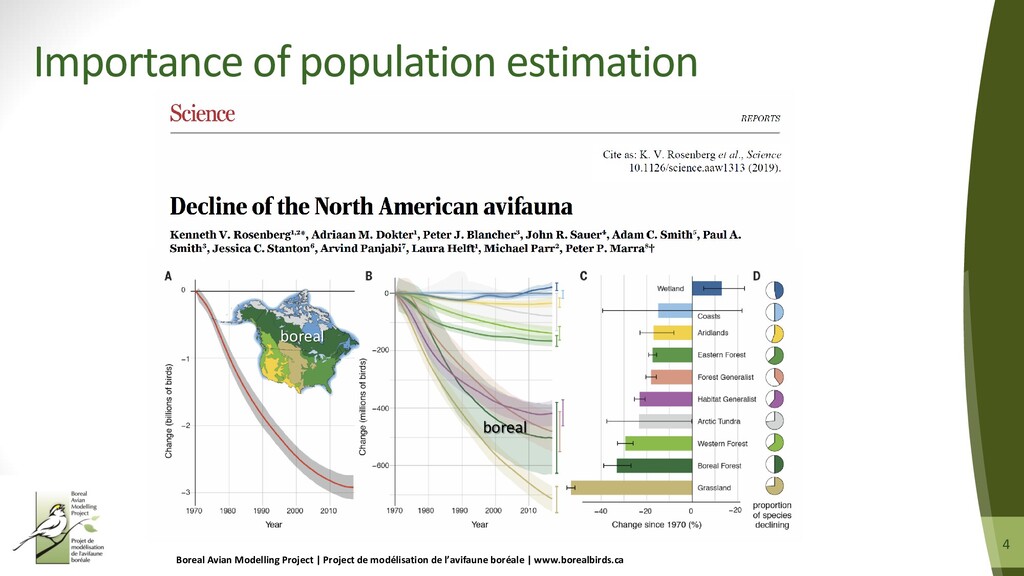
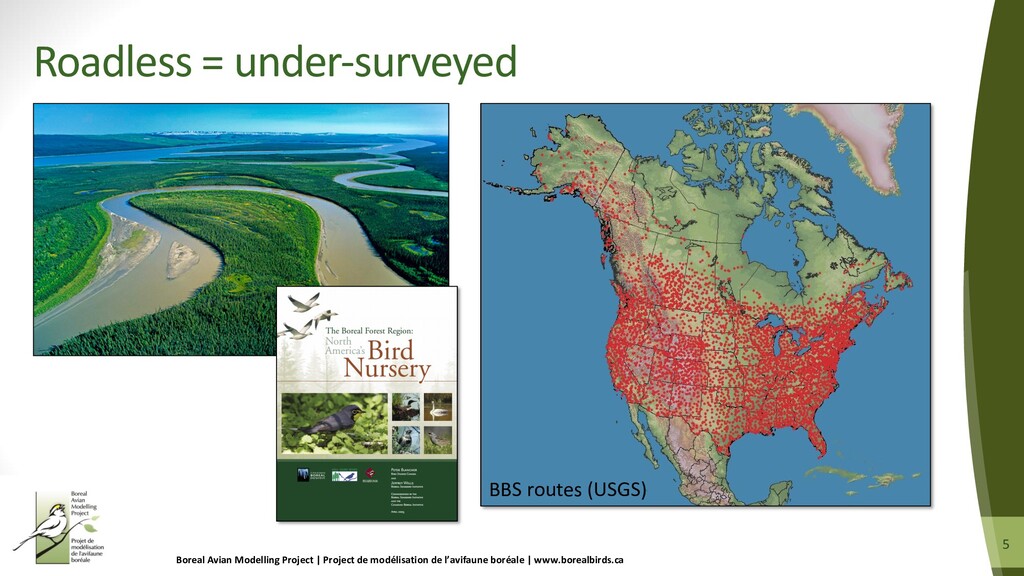
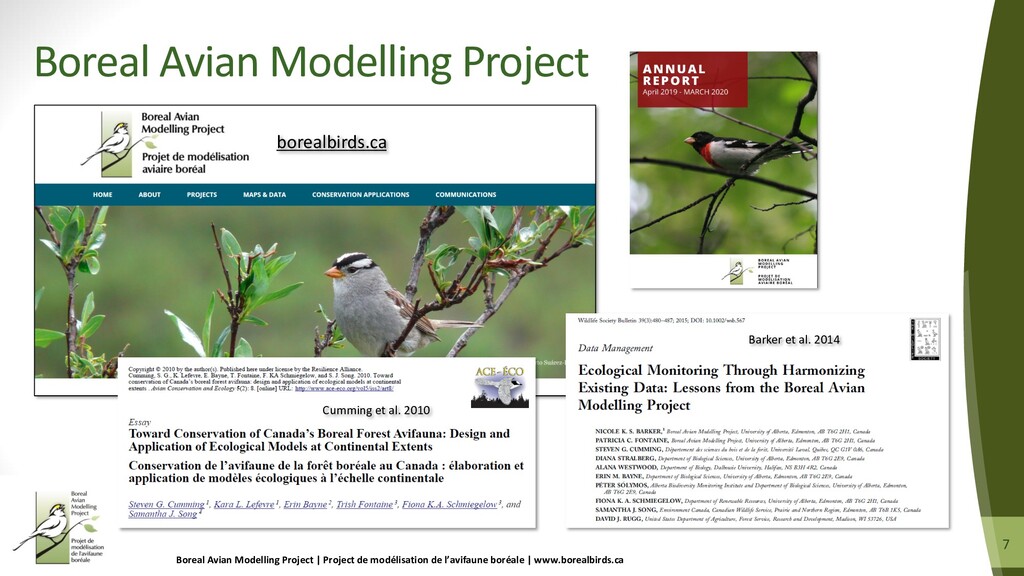
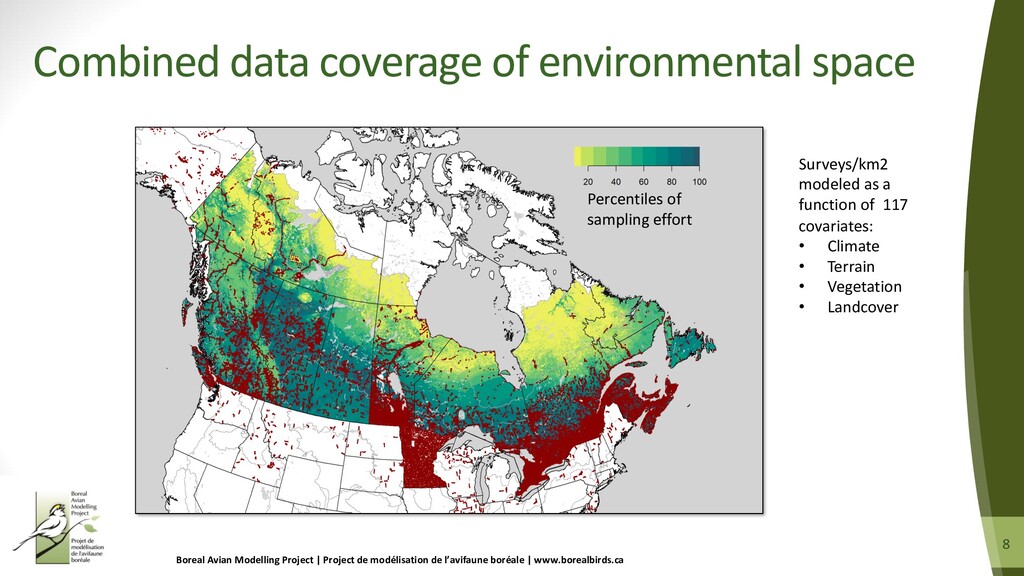
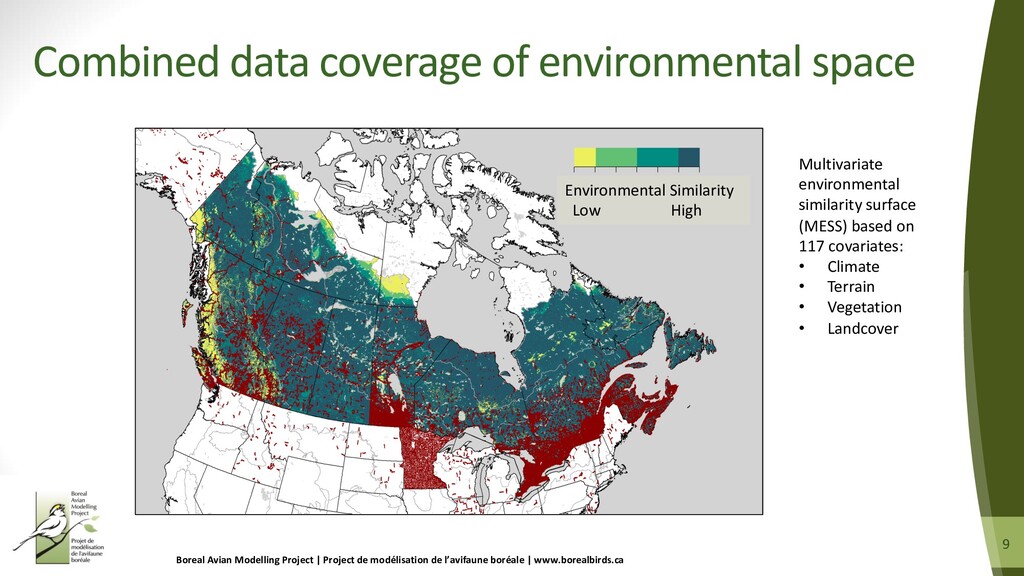
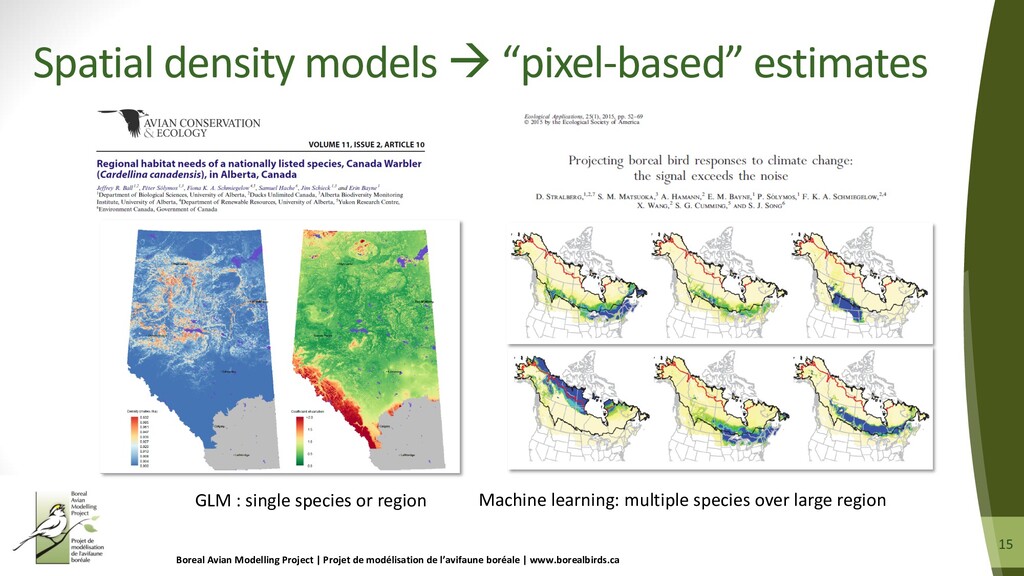
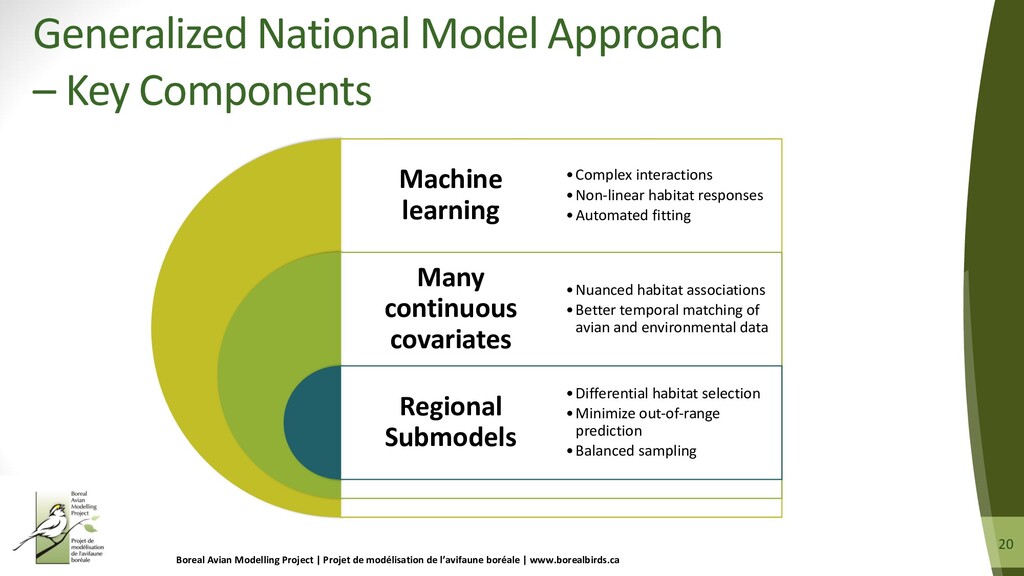
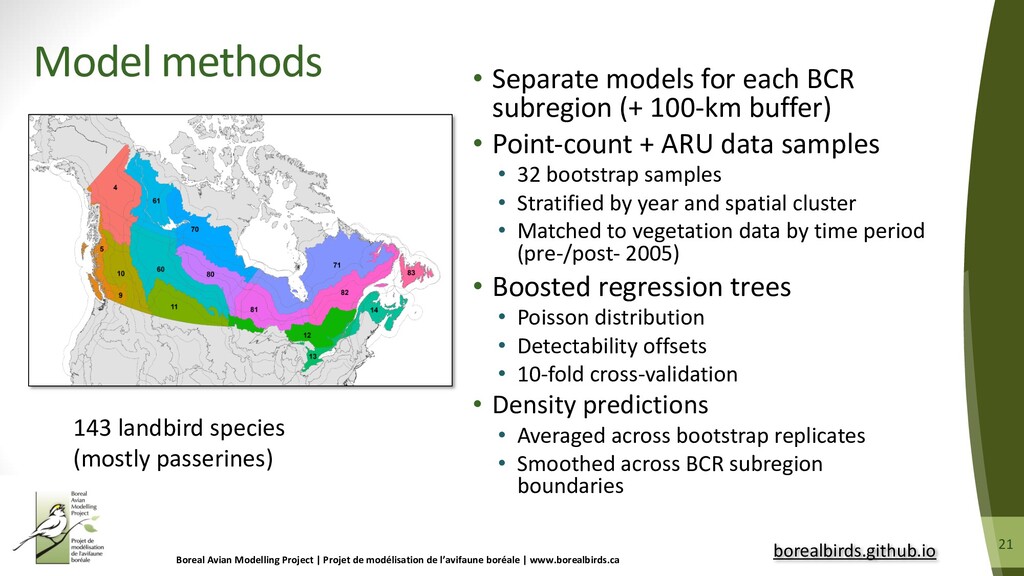
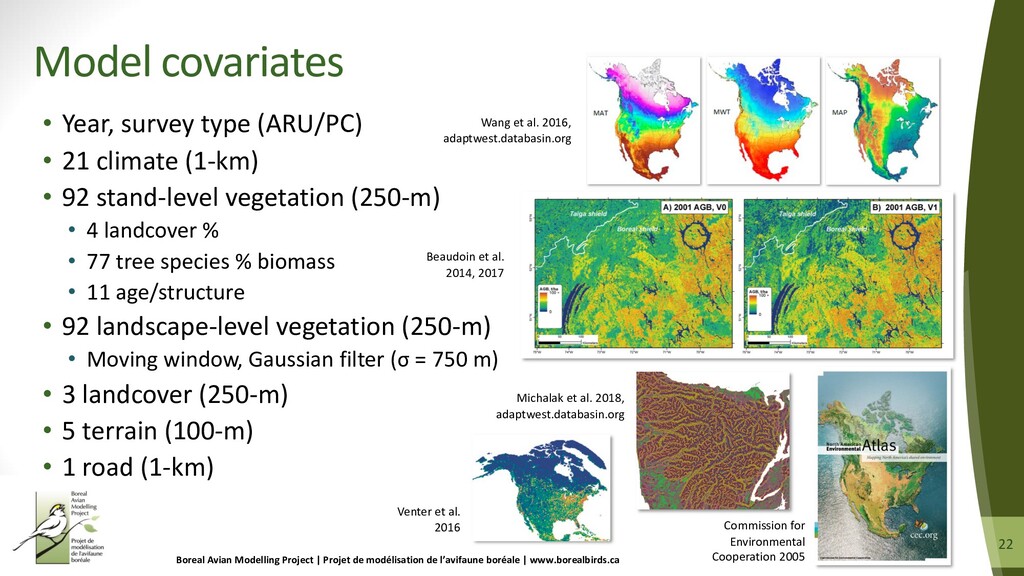
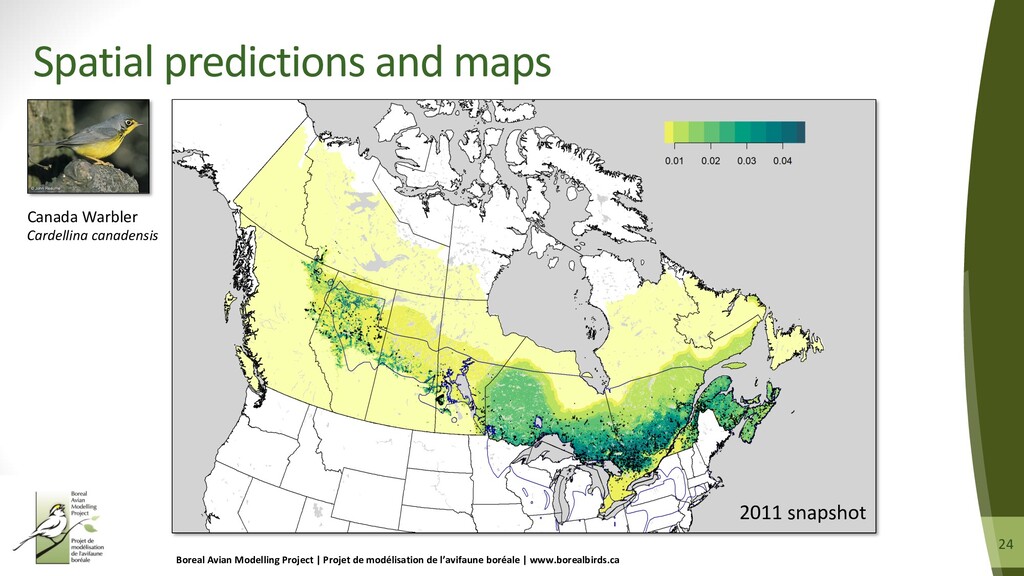
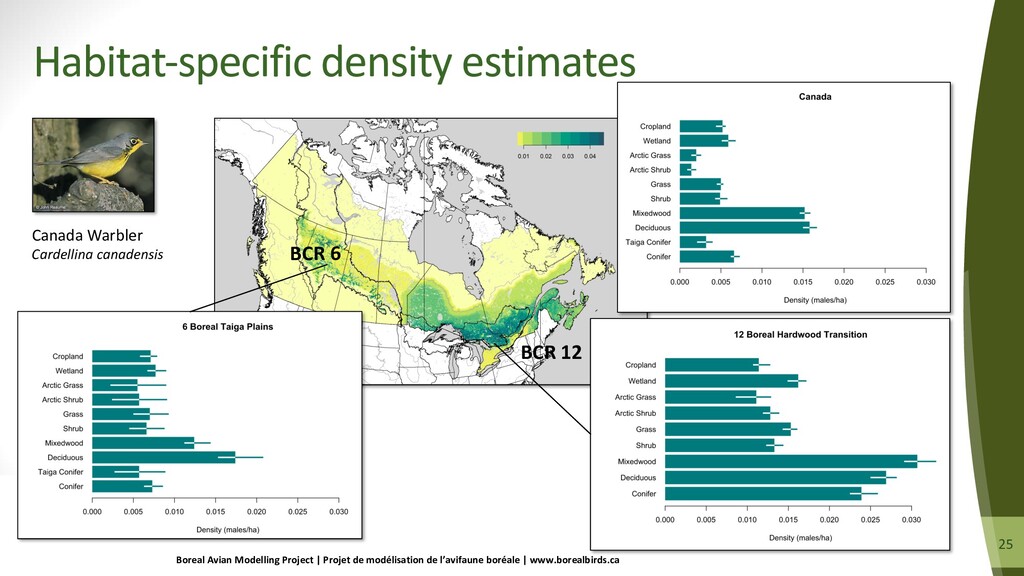
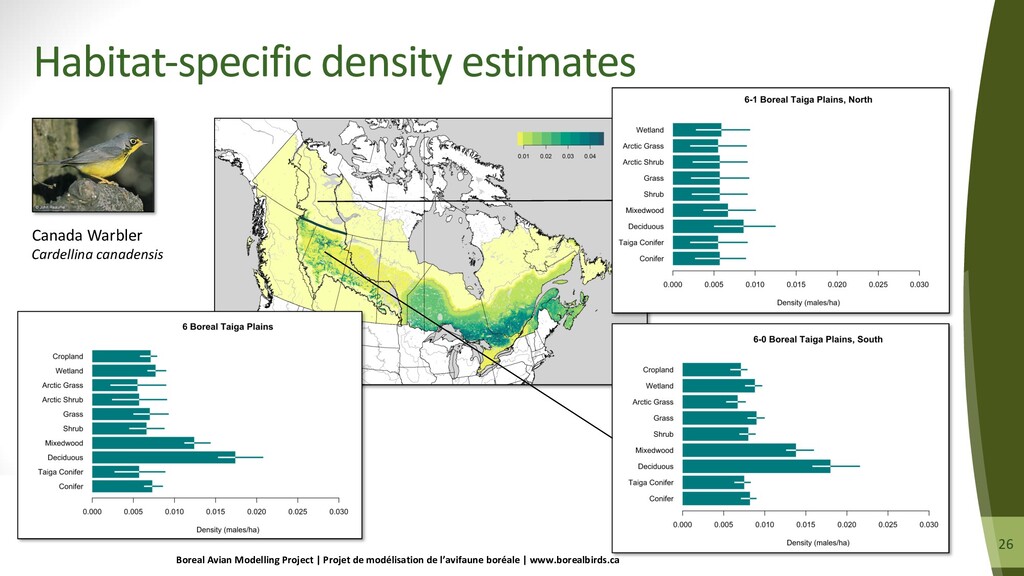
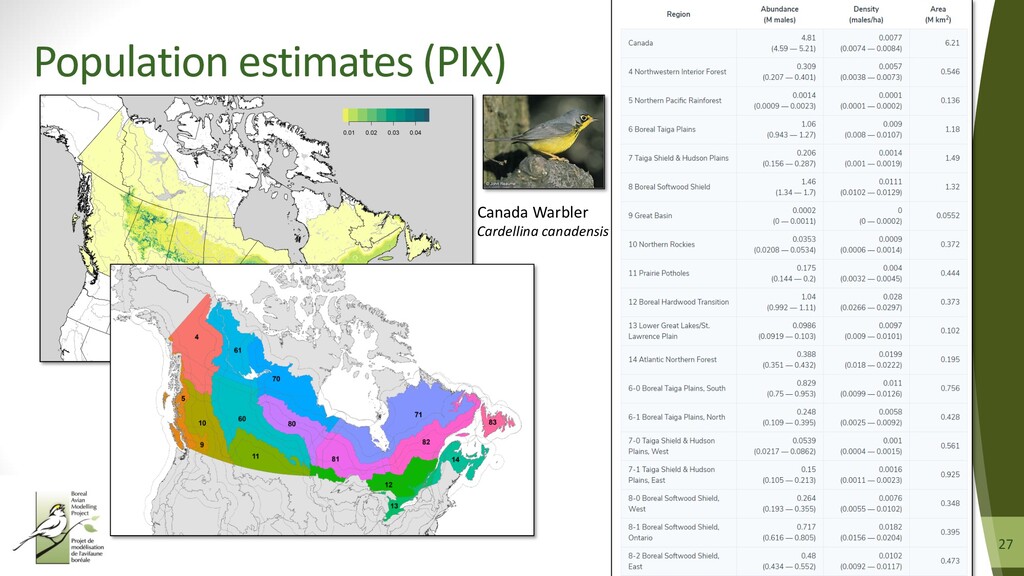
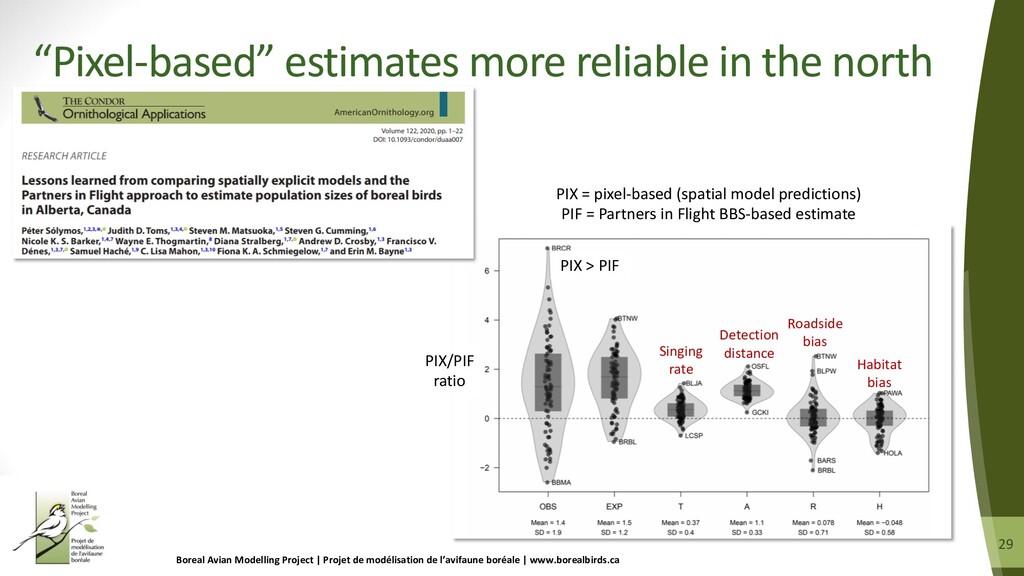
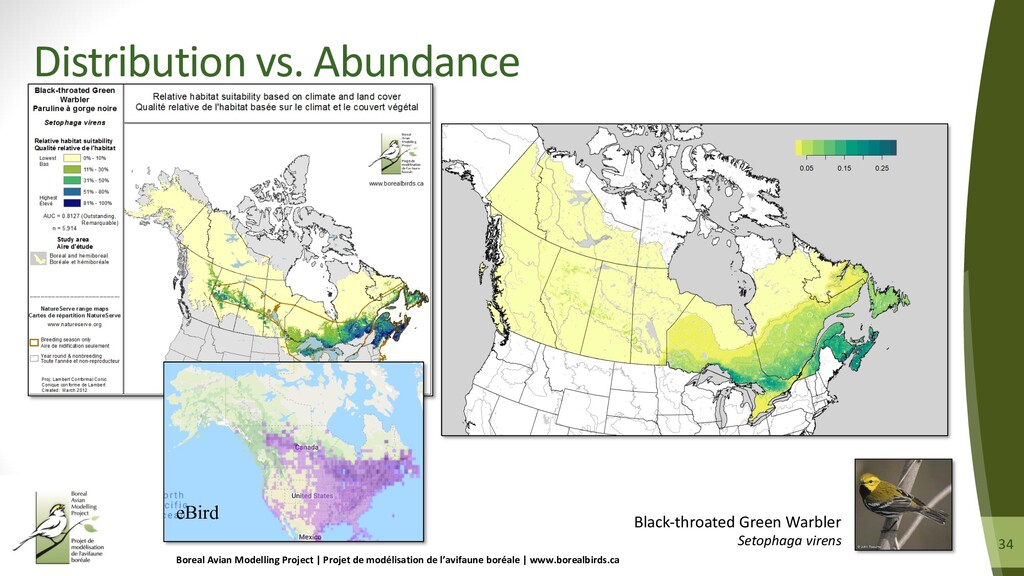
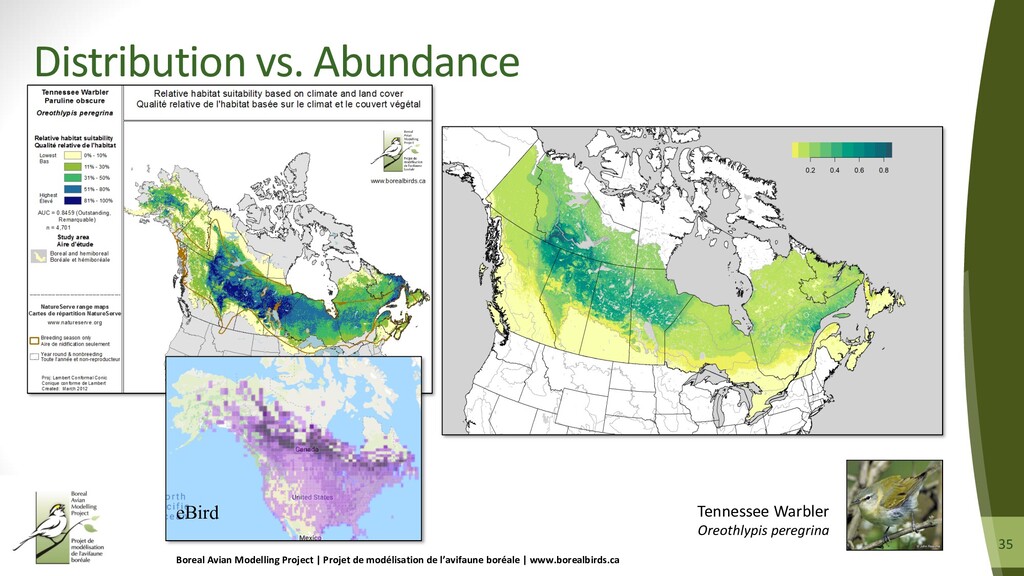
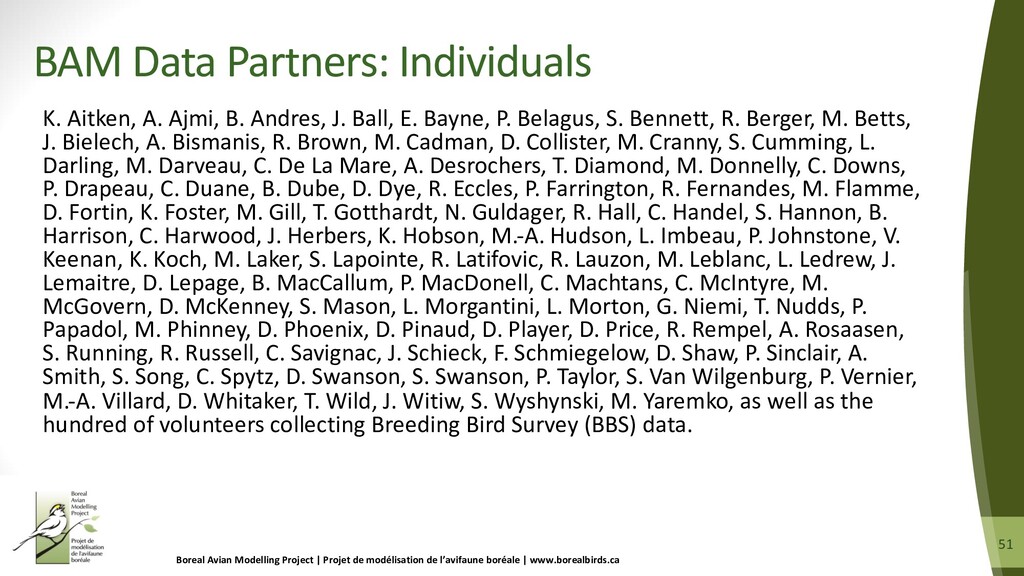
Reliable information on species’ population sizes, trends, habitat associations, and distributions is important for status assessment, Bird Conservation Region (BCR) planning, broader conservation planning, and recovery planning and action for Species at Risk. The Boreal Avian Modelling Project (BAM) has developed a generalized analytical approach to model species densities in relation to environmental covariates. We used the BAM database (surveys up to 2018) and built models for 143 species. We modelled density independently in each region (portions of BCRs separated by provincial boundaries) using tree species biomass, stand age, topography, land use, and climate as predictors. We provide our density results as 1 km^2 resolution raster layers, which are used to calculate population sizes and regional habitat associations (mean densities by land cover type). Results are available at https://borealbirds.github.io

Peter Solymos

October 08, 2020
Tweet

More Decks by Peter Solymos

Other Decks in Science

Transcript

  1. 1 1 New spatial abundance models inform distribution, population, and

    trends for forest birds in Canada Diana Stralberg1,2 and Péter Sólymos1,3 Boreal Avian Modelling Project 1 University of Alberta 2 Canadian Forest Service 3 Alberta Biodiversity Monitoring Institute
  2. 2 2 Boreal Avian Modelling Project | Project de modélisation

    de l’avifaune boréale | www.borealbirds.ca borealbirds.github.io 10.5281/zenodo.4018336
  3. 3 3 •Population estimation •Habitat-specific density estimates •Canada-wide distribution maps

    capturing: - Broad-scale gradients - Stand-level habitat differences •Trend estimates Boreal Avian Modelling Project | Project de modélisation de l’avifaune boréale | www.borealbirds.ca Population assessment objectives
  4. 4 4 Boreal Avian Modelling Project | Project de modélisation

    de l’avifaune boréale | www.borealbirds.ca Importance of population estimation boreal boreal
  5. 5 5 Boreal Avian Modelling Project | Project de modélisation

    de l’avifaune boréale | www.borealbirds.ca Roadless = under-surveyed BBS routes (USGS)
  6. 6 6 1. Lack of coordinated monitoring; sparse data in

    remote northern regions 2. Existing data collected with a variety of different protocols 3. Complex species’ responses to environmental factors 4. Rapidly changing landscape conditions 5. Regional variation in species-habitat relationships Boreal Avian Modelling Project | Project de modélisation de l’avifaune boréale | www.borealbirds.ca Challenges for abundance models in Canada
  7. 7 7 Boreal Avian Modelling Project | Project de modélisation

    de l’avifaune boréale | www.borealbirds.ca Boreal Avian Modelling Project borealbirds.ca Cumming et al. 2010 Barker et al. 2014
  8. 8 8 Boreal Avian Modelling Project | Project de modélisation

    de l’avifaune boréale | www.borealbirds.ca Combined data coverage of environmental space Percentiles of sampling effort Surveys/km2 modeled as a function of 117 covariates: • Climate • Terrain • Vegetation • Landcover
  9. 9 9 Boreal Avian Modelling Project | Project de modélisation

    de l’avifaune boréale | www.borealbirds.ca Combined data coverage of environmental space Environmental Similarity Low High Multivariate environmental similarity surface (MESS) based on 117 covariates: • Climate • Terrain • Vegetation • Landcover
  10. 10 10 Boreal Avian Modelling Project | Project de modélisation

    de l’avifaune boréale | www.borealbirds.ca Easier to model distribution than abundance Maxent models (Stralberg et al. 2012, unpublished)
  11. 11 11 1. Lack of coordinated monitoring; sparse data in

    remote northern regions 2. Existing data collected with a variety of different protocols 3. Complex species’ responses to environmental factors 4. Rapidly changing landscape conditions 5. Regional variation in species-habitat relationships Boreal Avian Modelling Project | Project de modélisation de l’avifaune boréale | www.borealbirds.ca Challenges for abundance models in Canada
  12. 13 13 Detectability-based correction factors p(t): probability of an individual

    singing within time interval t. 0–3 3–5 p 0 1 p(t=3) p(t=5) p(t=10) Time (minutes) 5–10 min Sólymos et al. 2013 (MEE) + updates singing rate q(r): probability of detecting a singing individual within a circle of radius r. q 0 1 q(r=50) q(r=100) q(r=∞) Distance (m) 0–50 50–100 >100 m effective detection radius D = N/(A*p*q) density count area detectability components
  13. 14 14 1. Lack of coordinated monitoring; sparse data in

    remote northern regions 2. Existing data collected with a variety of different protocols 3. Complex species’ responses to environmental factors 4. Rapidly changing landscape conditions 5. Regional variation in species-habitat relationships Boreal Avian Modelling Project | Projet de modélisation de l’avifaune boréale | www.borealbirds.ca Challenges for abundance models in Canada
  14. 15 15 Boreal Avian Modelling Project | Projet de modélisation

    de l’avifaune boréale | www.borealbirds.ca Spatial density models à “pixel-based” estimates Machine learning: multiple species over large region GLM : single species or region
  15. 16 16 1. Lack of coordinated monitoring; sparse data in

    remote northern regions 2. Existing data collected with a variety of different protocols 3. Complex species’ responses to environmental factors 4. Rapidly changing landscape conditions 5. Regional variation in species-habitat relationships Boreal Avian Modelling Project | Projet de modélisation de l’avifaune boréale | www.borealbirds.ca Data challenges for abundance models in Canada
  16. 17 17 Boreal Avian Modelling Project | Projet de modélisation

    de l’avifaune boréale | www.borealbirds.ca Frequent natural and human disturbance Forest disturbance, 1985-2010 White et al. 2017 (Remote Sensing of Environment) gif courtesy of T. Micheletti
  17. 18 18 1. Lack of coordinated monitoring; sparse data in

    remote northern regions 2. Existing data collected with a variety of different protocols 3. Complex species’ responses to environmental factors 4. Rapidly changing landscape conditions 5. Regional variation in species-habitat relationships Boreal Avian Modelling Project | Projet de modélisation de l’avifaune boréale | www.borealbirds.ca Challenges for abundance models in Canada
  18. 19 19 Boreal Avian Modelling Project | Projet de modélisation

    de l’avifaune boréale | www.borealbirds.ca Differential habitat selection Canada Warbler
  19. 20 20 Generalized National Model Approach – Key Components Boreal

    Avian Modelling Project | Projet de modélisation de l’avifaune boréale | www.borealbirds.ca Machine learning Many continuous covariates Regional Submodels •Complex interactions •Non-linear habitat responses •Automated fitting •Nuanced habitat associations •Better temporal matching of avian and environmental data •Differential habitat selection •Minimize out-of-range prediction •Balanced sampling
  20. 21 21 • Separate models for each BCR subregion (+

    100-km buffer) • Point-count + ARU data samples • 32 bootstrap samples • Stratified by year and spatial cluster • Matched to vegetation data by time period (pre-/post- 2005) • Boosted regression trees • Poisson distribution • Detectability offsets • 10-fold cross-validation • Density predictions • Averaged across bootstrap replicates • Smoothed across BCR subregion boundaries Boreal Avian Modelling Project | Projet de modélisation de l’avifaune boréale | www.borealbirds.ca Model methods 143 landbird species (mostly passerines) borealbirds.github.io
  21. 22 22 • Year, survey type (ARU/PC) • 21 climate

    (1-km) • 92 stand-level vegetation (250-m) • 4 landcover % • 77 tree species % biomass • 11 age/structure • 92 landscape-level vegetation (250-m) • Moving window, Gaussian filter (σ = 750 m) • 3 landcover (250-m) • 5 terrain (100-m) • 1 road (1-km) Boreal Avian Modelling Project | Projet de modélisation de l’avifaune boréale | www.borealbirds.ca Model covariates Beaudoin et al. 2014, 2017 Wang et al. 2016, adaptwest.databasin.org Commission for Environmental Cooperation 2005 Michalak et al. 2018, adaptwest.databasin.org Venter et al. 2016
  22. 23 23 • 1-km pixel-level density predictions (males/ha) • 250-m

    predictions for individual subregions upon request • Habitat-specific density estimates via “post-hoc binning” • “Rolled up” population estimates for any spatial unit • Annual predictions and trends (in progress) Boreal Avian Modelling Project | Projet de modélisation de l’avifaune boréale | www.borealbirds.ca Model outputs Prediction Landcover classes of interest Region Landcover class Mean density . . . . . . . . . . . . . . .
  23. 24 24 Boreal Avian Modelling Project | Projet de modélisation

    de l’avifaune boréale | www.borealbirds.ca Spatial predictions and maps 2011 snapshot Canada Warbler Cardellina canadensis
  24. 25 25 Boreal Avian Modelling Project | Projet de modélisation

    de l’avifaune boréale | www.borealbirds.ca Habitat-specific density estimates BCR 12 BCR 6 Canada Warbler Cardellina canadensis
  25. 26 26 Boreal Avian Modelling Project | Projet de modélisation

    de l’avifaune boréale | www.borealbirds.ca Habitat-specific density estimates Canada Warbler Cardellina canadensis
  26. 28 28 Boreal Avian Modelling Project | Projet de modélisation

    de l’avifaune boréale | www.borealbirds.ca Website demo
  27. 29 29 Boreal Avian Modelling Project | Projet de modélisation

    de l’avifaune boréale | www.borealbirds.ca “Pixel-based” estimates more reliable in the north PIX/PIF ratio PIX = pixel-based (spatial model predictions) PIF = Partners in Flight BBS-based estimate PIX > PIF Singing rate Detection distance Roadside bias Habitat bias
  28. 30 30 Boreal Avian Modelling Project | Projet de modélisation

    de l’avifaune boréale | www.borealbirds.ca Canada-wide PIF vs. PIX comparison NPIX ~ 2x NPIF (1.4 – 3.4)
  29. 31 31 •Density offsets developed for passerines à • Population

    numbers may be overestimated for some species • Different behavior • Aggregation • Overlapping home ranges • à calibration using independent estimates Boreal Avian Modelling Project | Projet de modélisation de l’avifaune boréale | www.borealbirds.ca Limitations and trade-offs
  30. 32 32 Regional modeling approach + data gaps à •

    Cons: • Hard boundaries between BCR subunits • Range limits difficult to capture Pros: Reduced out-of-range overprediction Differential habitat selection Meaningful for regional scale management Easier updates based on locally available best predictors Boreal Avian Modelling Project | Projet de modélisation de l’avifaune boréale | www.borealbirds.ca Limitations and trade-offs
  31. 33 33 Boreal Avian Modelling Project | Projet de modélisation

    de l’avifaune boréale | www.borealbirds.ca Regional vs. National 16 regional models mosaiced together Single models with all Canadian data Hard edges vs. overprediction trade-off Canada Warbler Cardellina canadensis
  32. 34 34 Boreal Avian Modelling Project | Projet de modélisation

    de l’avifaune boréale | www.borealbirds.ca Distribution vs. Abundance eBird Black-throated Green Warbler Setophaga virens
  33. 35 35 Boreal Avian Modelling Project | Projet de modélisation

    de l’avifaune boréale | www.borealbirds.ca Distribution vs. Abundance Tennessee Warbler Oreothlypis peregrina eBird
  34. 36 36 Regional modeling approach + data gaps à •

    Cons: • Hard boundaries between BCR subunits • Range limits difficult to capture • Pros: • Reduced out-of-range overprediction • Differential habitat selection • Meaningful for regional scale management • Easier updates based on locally available best predictors Limitations and trade-offs Boreal Avian Modelling Project | Projet de modélisation de l’avifaune boréale | www.borealbirds.ca
  35. 37 37 •Identification of key biodiversity areas •Multi-species conservation priorities

    •Climate and landscape change simulation •Species at risk habitat identification •Integrated trend estimation Boreal Avian Modelling Project | Projet de modélisation de l’avifaune boréale | www.borealbirds.ca Conservation applications
  36. 38 38 Identification of key biodiversity areas Combined human footprint

    Analyses by P. Vernier Boreal Avian Modelling Project | Projet de modélisation de l’avifaune boréale | www.borealbirds.ca Biotic intactness index PRELIMINARY J. Zuloaga, A. Gonzalez, J. Ray et al.
  37. 39 39 Boreal Avian Modelling Project | Projet de modélisation

    de l’avifaune boréale | www.borealbirds.ca Multi-species conservation priorities B. Stewart, A. Camfield et al. Conservation synergies and gaps between boreal birds and caribou
  38. 40 40 Boreal Avian Modelling Project | Projet de modélisation

    de l’avifaune boréale | www.borealbirds.ca Multi-species conservation priorities Analysis by B. Robinson (CWS) Models from Barker et al. (2014)
  39. 41 41 Climate and landscape change simulation T. Micheletti et

    al. SpaDES Land cover change Species change Expanded study area S. Haché E. McIntire T. Micheletti et al.
  40. 42 42 Species-at-Risk Critical Habitat Identification Canada Warbler Cardellina canadensis

    F. Dénes Boreal Avian Modelling Project | Projet de modélisation de l’avifaune boréale | www.borealbirds.ca
  41. 43 43 Integrated trend estimation *Larger circles = more years

    of data Migration counts Stable Isotopes *Collected from each station Regional Trend Estimates National Trend Estimates BAM density maps used to weight regional trends in national analysis Relative Abundance Continental Abundance D. Iles (CWS) BLPW
  42. 44 44 •BAM v. 6 dataset • Additional data •

    More years of BBS • ARU data Next versions of the models Boreal Avian Modelling Project | Projet de modélisation de l’avifaune boréale | www.borealbirds.ca
  43. 45 45 •BAM v. 6 dataset •Annual climate and landcover

    covariates • Better matching predictors and surveys • Captures trends in landscape change Next versions of the models Boreal Avian Modelling Project | Projet de modélisation de l’avifaune boréale | www.borealbirds.ca
  44. 46 46 •BAM v. 6 dataset •Annual climate and landcover

    covariates •U.S. regions • Incorporate U.S. data • Extend regions to full boreal-hemiboreal Next versions of the models Boreal Avian Modelling Project | Projet de modélisation de l’avifaune boréale | www.borealbirds.ca
  45. 47 47 •BAM v. 6 dataset •Annual climate and landcover

    covariates •U.S. regions Future versions • Smaller subregions (data gaps are an issue) • Unclassified spectral data inputs Next versions of the models Boreal Avian Modelling Project | Projet de modélisation de l’avifaune boréale | www.borealbirds.ca
  46. 48 48 • “Pixel-based” population estimation is an improvement over

    sample- based methods when sample is biased with respect to habitat • BAM density models generate predictions from “messy” data that can be “rolled up” into population estimates, due to: • Point-count detectability offsets to standardize across different methods • Machine learning to predict in unsampled areas • Many current applications and probably more in the future. Boreal Avian Modelling Project | Projet de modélisation de l’avifaune boréale | www.borealbirds.ca Take-home messages
  47. 49 49 Boreal Avian Modelling Projet | Project de modélisation

    de l’avifaune boréale | www.borealbirds.ca BAM Funding Partners Grants & Contributions • Environment and Climate Change Canada • Canada|Alberta Joint Oil Sands Monitoring Institutional/Infrastructure Support • University of Alberta • Université Laval Past & Current Funders Alberta Biodiversity Monitoring Institute, Alberta Conservation Association, Alberta Innovates Technology Futures, Alberta Land-use Framework (Gov. Alberta), Alberta Research Council Inc., Alberta Pacific Forest Industries Inc., Boreal Ecosystems Assessment for Conservation Networks (BEACONs), Canada Foundation for Innovation, Canada Research Chairs, Canadian Boreal Initiative, Canada Foundation for Innovation, Canfor, Climate Change and Emissions Management Corporation, Ducks Unlimited Canada, EC Habitat Stewardship Funds, Environmental Studies Research Fund, Fonds Québécois de la recherche sur la nature et les technologies, Forest Products Association of Canada, Geomatics for Informed Decisions (GEOIDE), Killam Trusts, Ministère des Ressources naturelles et de la Faune (MRNF) Quebec, Mitacs, National Fish & Wildlife Foundation, NSERC, Sustainable Forestry Initiative, Sustainable Forest Management Network, US Landscape Conservation Cooperatives, USFWS Neotropical Migratory Bird Conservation Act Grants Program, Vanier Canada Graduate Scholarships, West Fraser Timber
  48. 50 50 Acadia University; Alaska Bird Observatory; Alaska Natural Heritage

    Program; Alberta Biodiversity Monitoring Institute; Alberta Pacific Forest Industries Inc.; AMEC Earth & Environmental; AREVA Resources Canada Inc.; Avian Knowledge Network; AXYS Environmental Consulting Ltd.; Bighorn Wildlife Technologies Ltd.; Bird Studies Canada; Breeding Bird Survey (coordinated in Canada by Environment Canada); BC Breeding Bird Atlas; Canadian Natural Resources Ltd.; Canfor Corporation; Daishowa Marubeni International Ltd; Canada Centre for Remote Sensing and Canadian Forest Service, Natural Resources Canada; Canadian Wildlife Service and Science & Technology Branch, Environment Canada; Global Land Cover Facility; Golder Associates Ltd.; Government of British Columbia; Government of Yukon; Hinton Wood Products; Hydro-Québec Équipement; Kluane Ecosystem Monitoring Project; Komex International Ltd.; Louisiana Pacific Canada Ltd.; Manitoba Breeding Bird Atlas; Manitoba Hydro; Manitoba Model Forest Inc.; Manning Diversified Forest Products Ltd.; Maritimes Breeding Bird Atlas; Matrix Solutions Inc. Environment & Engineering; MEG Energy Corp.; Mirkwood Ecological Consultants Ltd.; NatureCounts; Nature Serve; Numerical Terradynamic Simulation Group; Ontario Breeding Bird Atlas; Ontario Ministry of Natural Resources; OPTI Canada Inc.; PanCanadian Petroleum Limited; Parks Canada (Mountain National Parks Avian Monitoring Database); Petro Canada; Principal Wildlife Resource Consulting; Regroupement QuébecOiseaux; Rio Alto Resources International Inc.; Saskatchewan Environment; Shell Canada Ltd.; Suncor Energy Inc.; Tembec Industries Inc.; Tolko Industries Ltd.; U.S. Army; U.S. Fish and Wildlife Service; U.S. Geological Survey, Alaska Science Center; U.S. National Park Service; Université de Moncton; Université du Québec à Montréal; Université du Québec en Abitibi-Témiscamingue; Université Laval; University of Alaska, Fairbanks; University of Alberta; University of British Columbia; University of Guelph; University of New Brunswick; University of Northern British Columbia; URSUS Ecosystem Management Ltd.; West Fraser Timber Co. Ltd.; Weyerhaeuser Company Ltd.; Wildlife Resource Consulting Services MB Inc. Boreal Avian Modelling Project | Projet de modélisation de l’avifaune boréale | www.borealbirds.ca BAM Data Partners: Institutions
  49. 51 51 K. Aitken, A. Ajmi, B. Andres, J. Ball,

    E. Bayne, P. Belagus, S. Bennett, R. Berger, M. Betts, J. Bielech, A. Bismanis, R. Brown, M. Cadman, D. Collister, M. Cranny, S. Cumming, L. Darling, M. Darveau, C. De La Mare, A. Desrochers, T. Diamond, M. Donnelly, C. Downs, P. Drapeau, C. Duane, B. Dube, D. Dye, R. Eccles, P. Farrington, R. Fernandes, M. Flamme, D. Fortin, K. Foster, M. Gill, T. Gotthardt, N. Guldager, R. Hall, C. Handel, S. Hannon, B. Harrison, C. Harwood, J. Herbers, K. Hobson, M.-A. Hudson, L. Imbeau, P. Johnstone, V. Keenan, K. Koch, M. Laker, S. Lapointe, R. Latifovic, R. Lauzon, M. Leblanc, L. Ledrew, J. Lemaitre, D. Lepage, B. MacCallum, P. MacDonell, C. Machtans, C. McIntyre, M. McGovern, D. McKenney, S. Mason, L. Morgantini, L. Morton, G. Niemi, T. Nudds, P. Papadol, M. Phinney, D. Phoenix, D. Pinaud, D. Player, D. Price, R. Rempel, A. Rosaasen, S. Running, R. Russell, C. Savignac, J. Schieck, F. Schmiegelow, D. Shaw, P. Sinclair, A. Smith, S. Song, C. Spytz, D. Swanson, S. Swanson, P. Taylor, S. Van Wilgenburg, P. Vernier, M.-A. Villard, D. Whitaker, T. Wild, J. Witiw, S. Wyshynski, M. Yaremko, as well as the hundred of volunteers collecting Breeding Bird Survey (BBS) data. Boreal Avian Modelling Project | Projet de modélisation de l’avifaune boréale | www.borealbirds.ca BAM Data Partners: Individuals
  50. 52 52 Boreal Avian Modelling Project | Projet de modélisation

    de l’avifaune boréale | www.borealbirds.ca BAM Team Technical Committee •Marcel Darveau, Université Laval •André Desrochers, Université Laval •Pierre Drapeau, Université du Québec à Montréal •Charles Francis, CWS •Colleen Handel, USGS •Keith Hobson, University of Western Ontario •Craig Machtans, CWS Northern •Julienne Morissette, CFS, Northern Forestry Centre •Gerald Niemi, University of Minnesota – Duluth •Rob Rempel, OMNRF / Lakehead University •Stuart Slattery, DUC •Phil Taylor, Acadia University •Lisa Venier, CFS, Great Lakes Forestry Centre •Pierre Vernier, University of British Columbia •Marc-André Villard, Université du Québec à Rimouski The Team Members shown here are those leading or contributing to one or more studies on BAM’s workplan, and are also active, ongoing contributors to the scientific development and implementation of BAM. BAM’s research work plan and administration is largely developed by the Core Team, overseen by the Steering Committee. Staff & Postdocs Core Team Steering Committee Fiona Schmiegelow Samantha Song Steve Cumming Erin Bayne Teegan Docherty, Coordinating Scientist Péter Sólymos Statistical Ecologist Mélina Houle Spatial Analyst Lionel Leston Postdoctoral Fellow Tati Micheletti, CFS Andy Crosby Postdoctoral Fellow Hedwig Lankau Avian Database Manager Contributing Scientists Diana Stralberg, CFS Steve Matsuoka, USGS Lisa Mahon, CWS Judith Toms, CWS Junior Tremblay, ECCC, S&T Steve Van Wilgenburg CWS Samuel Haché, CWS Brendan Casey U.Alberta Isolde Lane Shaw U.Laval Ana Raymundo U.Laval Elly Knight U.Alberta Grad Students Tara Stehelin U.Alberta Antoine Adde U.Laval The BAM Team is comprised of academic researchers, government scientists, project staff and post-docs, and graduate students.