Upgrade to PRO for Only $50/Year—Limited-Time Offer! 🔥

Parul Sethi | Visual Analysis of Topic Models

Parul Sethi | Visual Analysis of Topic Models

I will talk about how to interactively explore Topic models and it's entities: documents, topics and words for aiding the downstream NLP applications.

Avatar for PyData London

PyData London

November 07, 2017
Tweet

More Decks by PyData London

Other Decks in Technology

Transcript

  1. What do we look for? What is in them? How

    to navigate through them Too much textual data.
  2. How are the labels inferred Topic model gives us a

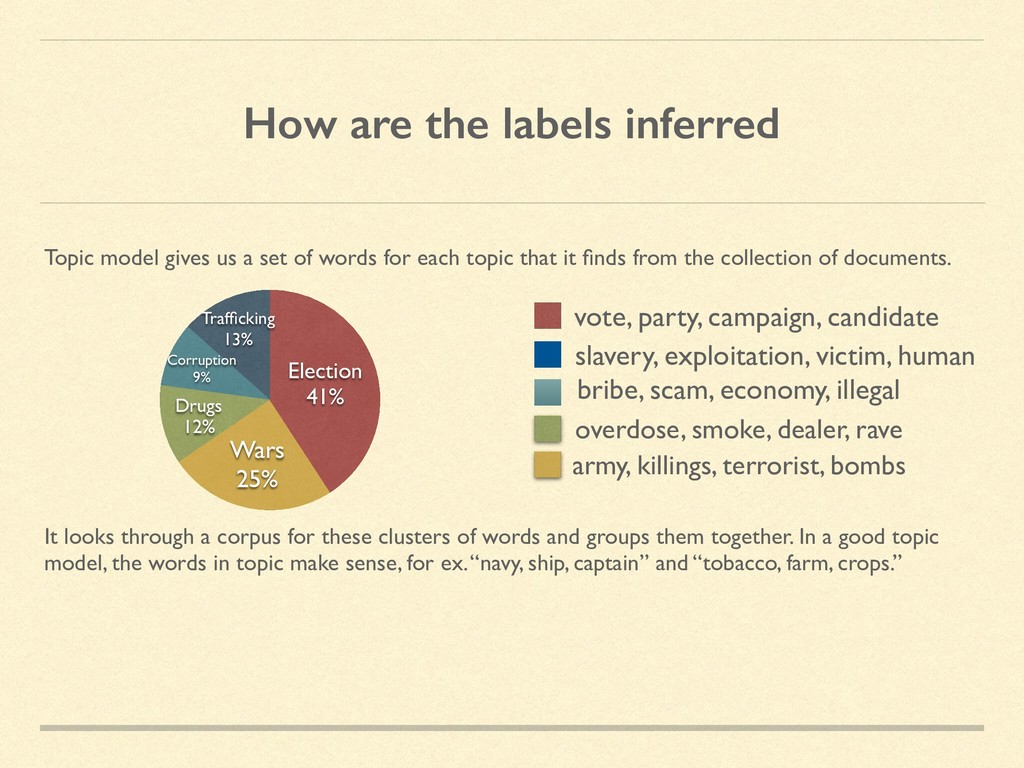
    set of words for each topic that it finds from the collection of documents. It looks through a corpus for these clusters of words and groups them together. In a good topic model, the words in topic make sense, for ex. “navy, ship, captain” and “tobacco, farm, crops.” army, killings, terrorist, bombs Trafficking 13% Corruption 9% Drugs 12% Wars 25% Election 41% overdose, smoke, dealer, rave bribe, scam, economy, illegal vote, party, campaign, candidate slavery, exploitation, victim, human
  3. Topic Model Visualizations • pyLDAvis • Topic Difference • Topic

    Networks • Topic Dendrogram • LDA projections
  4. pyLDAvis •Left panel represents the topics which are positioned according

    to their inter-topic distances •Right panel represents the list of terms that are most useful in interpreting the selected topic
  5. Topic Difference •Heatmap represent the difference between the topics of

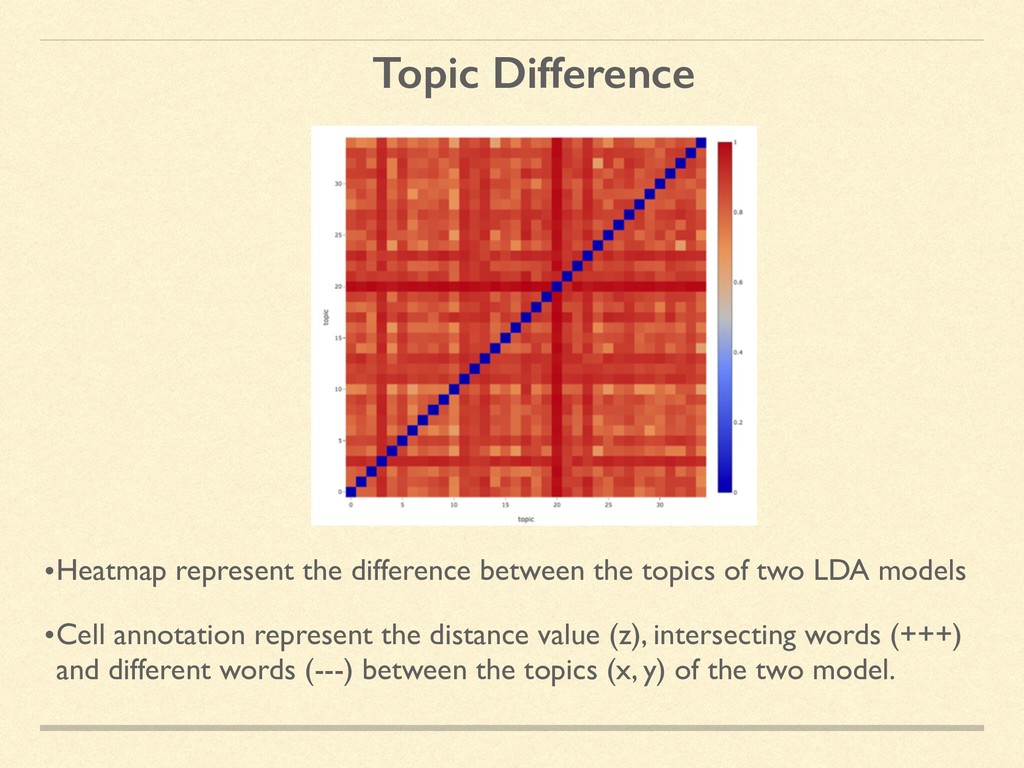
    two LDA models •Cell annotation represent the distance value (z), intersecting words (+++) and different words (---) between the topics (x, y) of the two model.
  6. Topic networks •The nodes represent topic •Edges represent connections between

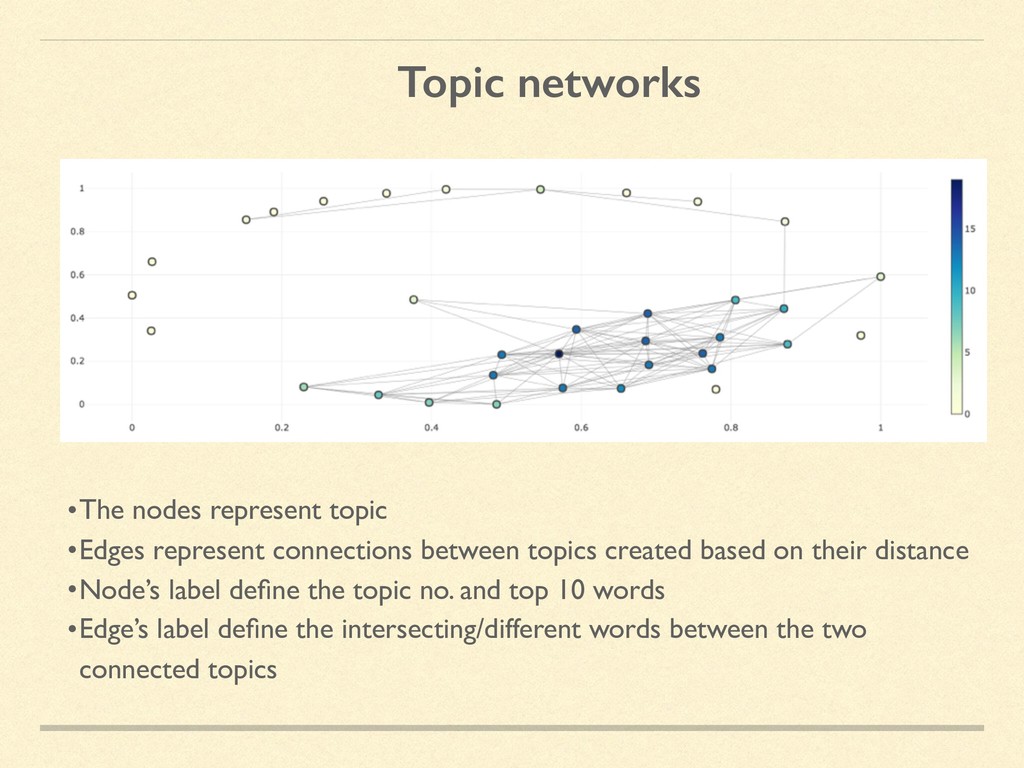
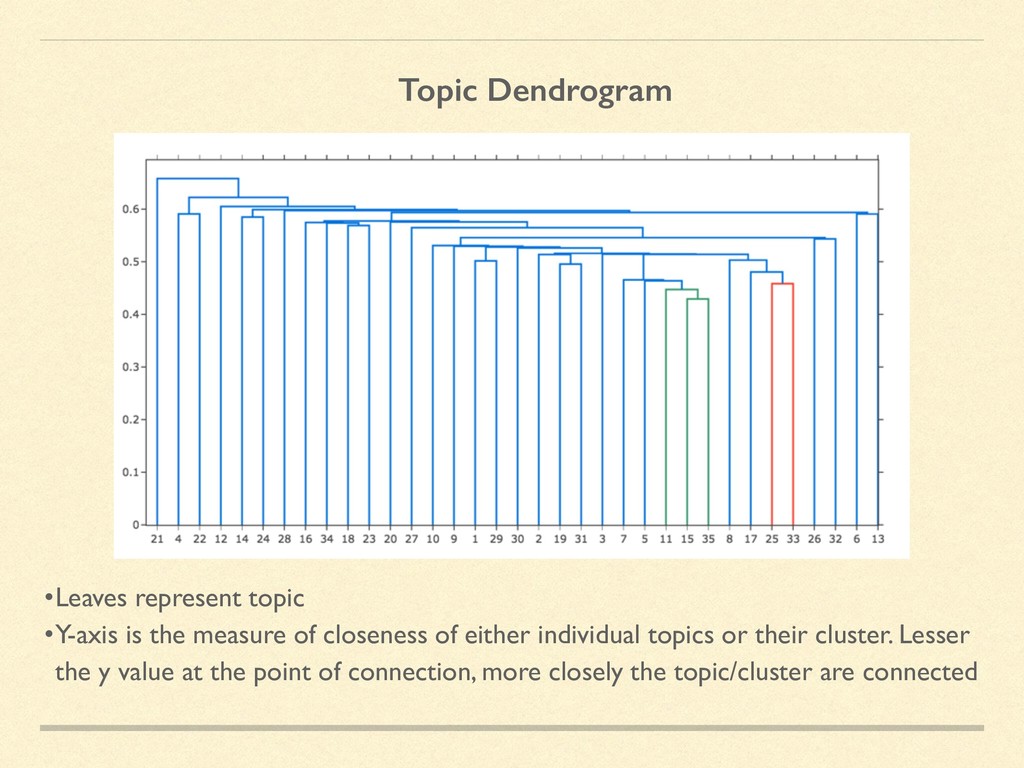
    topics created based on their distance •Node’s label define the topic no. and top 10 words •Edge’s label define the intersecting/different words between the two connected topics
  7. Topic Dendrogram •Leaves represent topic •Y-axis is the measure of

    closeness of either individual topics or their cluster. Lesser the y value at the point of connection, more closely the topic/cluster are connected
  8. But what about documents? • Which topics a document belong

    to • Which documents belong to this topic
  9. LDA Projections •Each point represent a document •Distances are based

    on difference of topic distribution of documents •We can also discover document clusters using t-sne