Upgrade to Pro — share decks privately, control downloads, hide ads and more …

Social Network Retention Analysis

Qize Le
January 22, 2017

Social Network Retention Analysis

Qize Le

January 22, 2017
Tweet

More Decks by Qize Le

Other Decks in Technology

Transcript

  1. How are New Users Look Like? 1/21/2017 2 Page Views

    Follows Search Likes Re-blogs 89% 65% 28% 16% 6.6 3 Average Median* 7.5 5 3.9 3 4.5 4 * Exclude users that do not exhibit such behaviors when displayed median value 50% 5.9 6 Information Receiver Information Sharer
  2. How are New Users Look Like?- Continue 1/21/2017 3 Original

    Post Received Engagement Un-follow Retention Email Verification 18% 0.7 1 Average Median* 16% 0.4 1 9% 0.6 2 36% * Exclude users that do not exhibit such behaviors when displayed median value 34% Creator Popular User
  3. How are New Users Look Like?- Continue 1/21/2017 4 Register

    Time Devices Source 40% 36% 23% web android iphone api yahoo 16% 7% 6% 3% 8% 60% login no referer google follow page others unknown 29% 23% 28% 20% morning afternoon night late night
  4. Differences between Active and Inactive Users 1/21/2017 5 0.3 1.1

    non-active active 282% Received Engagement 4.2 10.9 non-active active 163% Page Views 0.4 1.1 non-active active 157% Original Post 2.2 6.9 non-active active 214% Likes • Active users showed 113% lift compared with non-active user in unfollows • Active users showed 113% lift compared with non-active user in searches • Active users showed 55% lift compared with non-active user in email verification
  5. Indentify Factors correlated with Users Retention - Methodology 1/21/2017 6

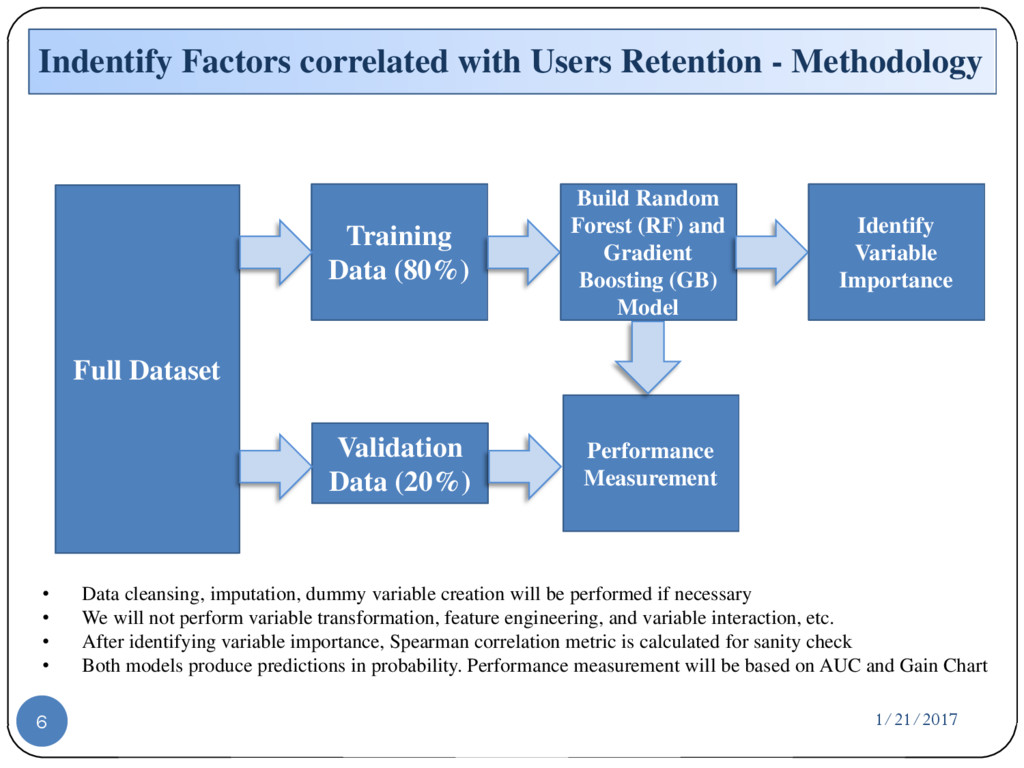
    Full Dataset Training Data (80%) Validation Data (20%) Build Random Forest (RF) and Gradient Boosting (GB) Model Identify Variable Importance Performance Measurement • Data cleansing, imputation, dummy variable creation will be performed if necessary • We will not perform variable transformation, feature engineering, and variable interaction, etc. • After identifying variable importance, Spearman correlation metric is calculated for sanity check • Both models produce predictions in probability. Performance measurement will be based on AUC and Gain Chart
  6. Indentify Factors correlated with Users Retention - Results 1/21/2017 7

    High Correlation (RF Imp>10%, GB Imp>8%, Corr>20%) • Pageviews • Follows • Searches • Registration Time* Medium Correlation (RF Imp>2%, GB Imp>3%, Corr>10%) • Likes • Original Posts • Reblogs • Is_verified • Receive_engagement • Unfollows** * Registration Time showed >20% importance in RF Model and >10% in GB Model, but only 5% Spearman correlation (further explained using univariate chart) ** Unfollows has 2.8% importance in GB Model, marginally meet the criteria
  7. Indentify Factors Affecting Users Retention - Validation 1/21/2017 8 Core

    Model – Use only 4 highly correlated variables Extended Model – Use both highly and medium correlated variables Random Forest Gradient Boosting 65.2% 71.5% AUC Random Forest Gradient Boosting 68.6% 73.1% AUC • Full Model (with all variables) measured 71.1% AUC in RF model, and 74.2% AUC in GB model • Both Core Model and Extended Model performed reasonably well 0% 20% 40% 60% 80% 100% 1 2 3 4 5 6 7 8 9 10 Cumulative Gain Chart RF Model GB Model 0% 20% 40% 60% 80% 100% 1 2 3 4 5 6 7 8 9 10 Cumulative Gain Chart RF Model GB Model
  8. Business Strategy - Users Retention Early Indicator 1/21/2017 9 New

    Users Page View<5 5<=Page View<=10 Page View>10 Follows<=3 Follows>3 Low Retention Med Retention High Retention 50% 34% 15% 0% 20% 40% 60% Low Med High % of Users 24% 42% 69% 0% 20% 40% 60% 80% Low Med High Retention Rate
  9. Proposed Actionable Marketing Strategy 1/21/2017 10 View Pages (if never)

    Follow Others (if never) Search a Topic (if never) Like a Post (if never) Write a Post (if never) Share other’s Post (if never) • Target low/medium retention users segment after 24 hours • Depends if users login or not, communications can be delivered on-site, or through emails • Key Metric can be retention rate, # of login, etc. Test Group Control Group No Communications
  10. Univariate Plot – Page Views 1/21/2017 12 • Empirical Logit

    is defined as: log((n_event+alpha)/(n_nonevent+alpha)), where alpha=0.5 0 500 1000 1500 2000 2500 3000 -2 -1.5 -1 -0.5 0 0.5 1 1.5 0 1 2 3 4 5 6 9 12 18 52 Volume Empirical Logit Variable Mean Volume Empirical Logit
  11. Univariate Plot – Follows 1/21/2017 13 • Empirical Logit is

    defined as: log((n_event+alpha)/(n_nonevent+alpha)), where alpha=0.5 0 500 1000 1500 2000 2500 3000 3500 4000 4500 5000 -1.4 -1.2 -1 -0.8 -0.6 -0.4 -0.2 0 0.2 0.4 0.6 0.8 0 1 2 3 5 6 7 10 14 23 68 Volume Empirical Logit Variable Mean Volume Empirical Logit
  12. Univariate Plot – Searches 1/21/2017 14 • Empirical Logit is

    defined as: log((n_event+alpha)/(n_nonevent+alpha)), where alpha=0.5 0 1000 2000 3000 4000 5000 6000 -1.2 -1 -0.8 -0.6 -0.4 -0.2 0 0.2 0.4 0 1 2 3 4 6 9 13 20 52 Volume Empirical Logit Variable Mean Volume Empirical Logit
  13. Univariate Plot – Registration Time 1/21/2017 15 • Empirical Logit

    is defined as: log((n_event+alpha)/(n_nonevent+alpha)), where alpha=0.5 555 560 565 570 575 580 585 590 -1 -0.9 -0.8 -0.7 -0.6 -0.5 -0.4 -0.3 -0.2 -0.1 0 0 1 2 3 5 6 8 9 10 12 13 14 15 16 17 18 19 20 21 22 Volume Empirical Logit Variable Mean Volume Empirical Logit Possible Explanation: Internet bots register during mid-night