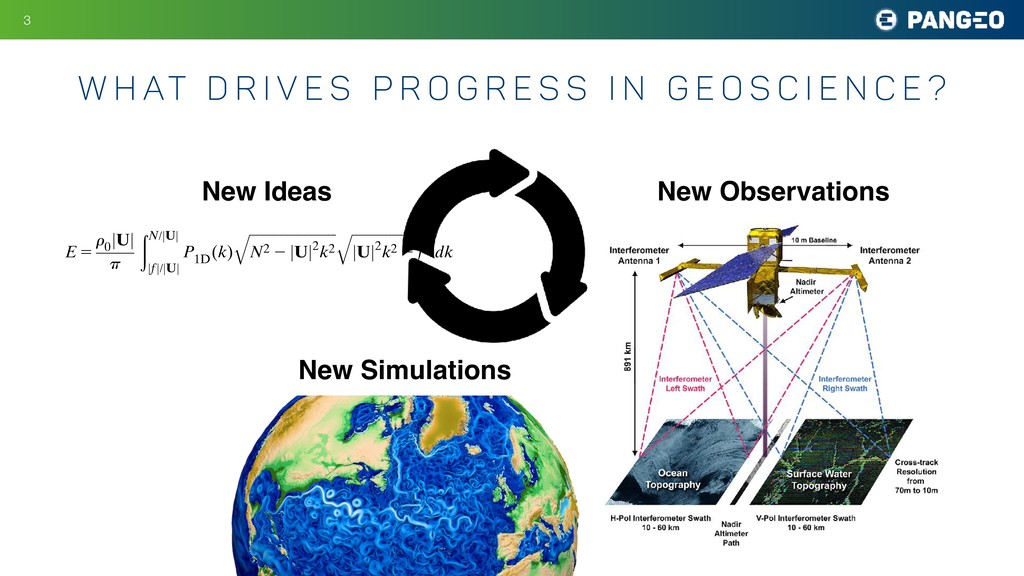
P r o g r e s s i n G E O S c i e n c e ? New Ideas New Observations New Simulations E 5 r 0 jUj p ðN/jUj jfj/jUj P 1D (k) ffiffiffiffiffiffiffiffiffiffiffiffiffiffiffiffiffiffiffiffiffiffiffiffiffi ffi N2 2 jUj2k2 q ffiffiffiffiffiffiffiffiffiffiffiffiffiffiffiffiffiffiffiffiffiffiffiffi jUj2k2 2 f2 q dk, (3) where k 5 (k, l) is now the wavenumber in the reference frame along and across the mean flow U and P 1D (k) 5 1 2p ð1‘ 2‘ jkj jkj P 2D (k, l) dl (4) is the effective one-dimensional (1D) topographic spectrum. Hence, the wave radiation from 2D topogra- phy reduces to an equivalent problem of wave radiation from 1D topography with the effective spectrum given by P1D (k). The effective 1D spectrum captures the effects of 2D c. Bottom topography Simulations are configured with multiscale topogra- phy characterized by small-scale abyssal hills a few ki- lometers wide based on multibeam observations from Drake Passage. The topographic spectrum associated with abyssal hills is well described by an anisotropic parametric representation proposed by Goff and Jordan (1988): P 2D (k, l) 5 2pH2(m 2 2) k 0 l 0 1 1 k2 k2 0 1 l2 l2 0 !2m/2 , (5) where k0 and l0 set the wavenumbers of the large hills, m is the high-wavenumber spectral slope, related to the pa- FIG. 3. Averaged profiles of (left) stratification (s21) and (right) flow speed (m s21) in the bottom 2 km from observations (gray), initial condition in the simulations (black), and final state in 2D (blue) and 3D (red) simulations.
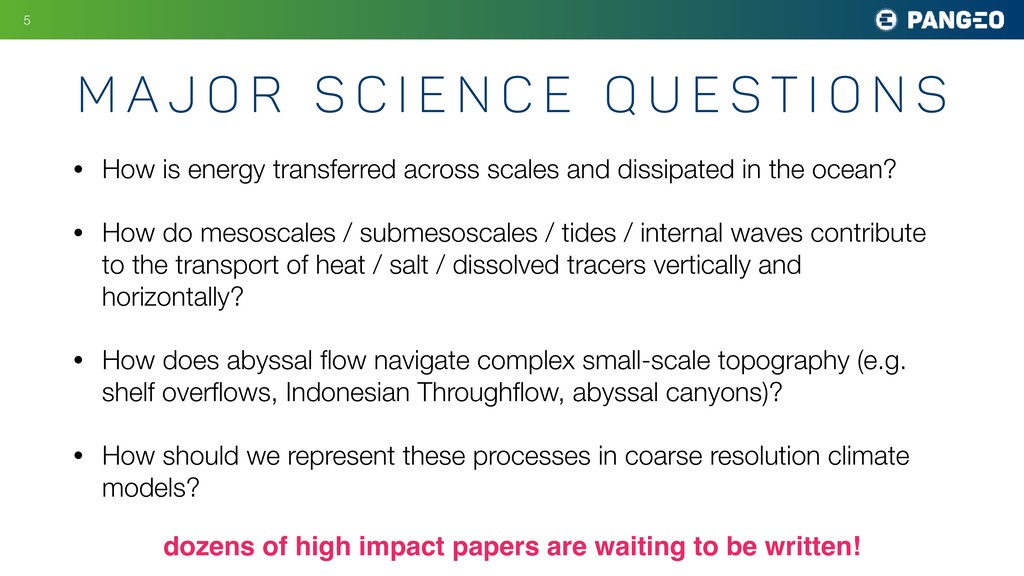
the ocean? • How do mesoscales / submesoscales / tides / internal waves contribute to the transport of heat / salt / dissolved tracers vertically and horizontally? • How does abyssal flow navigate complex small-scale topography (e.g. shelf overflows, Indonesian Throughflow, abyssal canyons)? • How should we represent these processes in coarse resolution climate models? !5 M a j o r S c i e n c e Q u e s t i o n s dozens of high impact papers are waiting to be written!
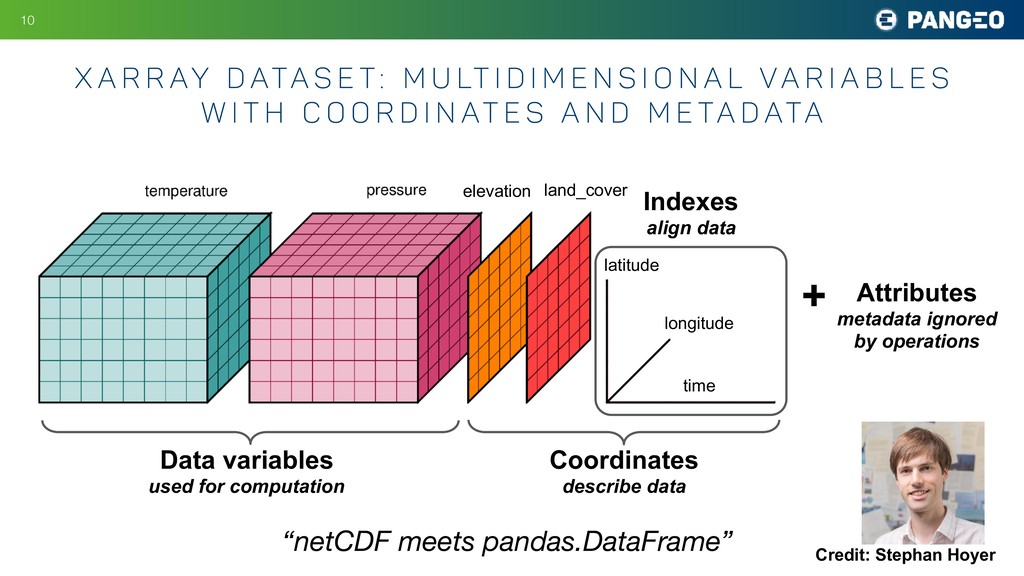
M u lt i d i m e n s i o n a l Va r i a b l e s w i t h c o o r d i n at e s a n d m e ta d ata !10 time longitude latitude elevation Data variables used for computation Coordinates describe data Indexes align data Attributes metadata ignored by operations + land_cover “netCDF meets pandas.DataFrame” Credit: Stephan Hoyer
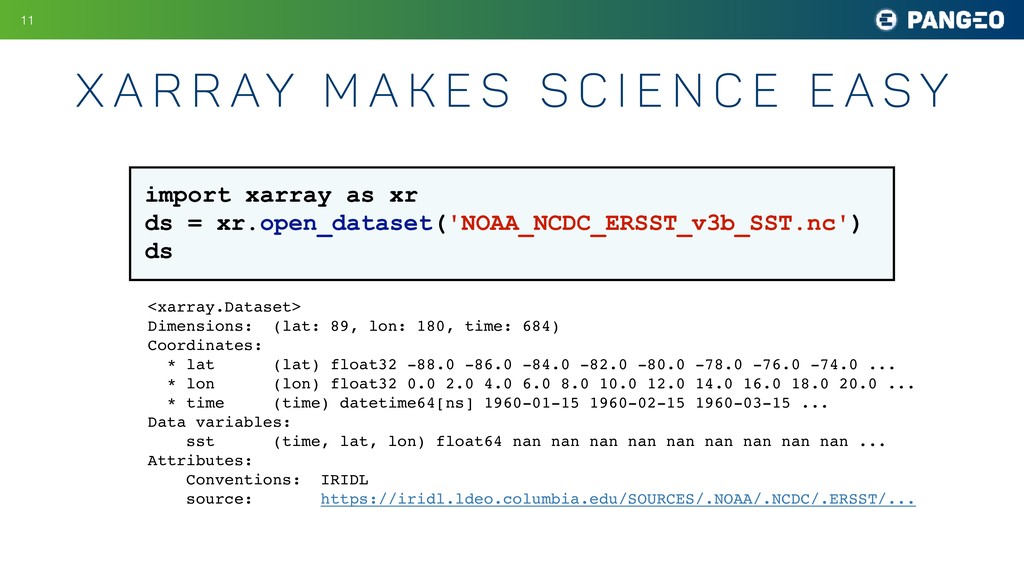
s c i e n c e e a s y !11 import xarray as xr ds = xr.open_dataset('NOAA_NCDC_ERSST_v3b_SST.nc') ds <xarray.Dataset> Dimensions: (lat: 89, lon: 180, time: 684) Coordinates: * lat (lat) float32 -88.0 -86.0 -84.0 -82.0 -80.0 -78.0 -76.0 -74.0 ... * lon (lon) float32 0.0 2.0 4.0 6.0 8.0 10.0 12.0 14.0 16.0 18.0 20.0 ... * time (time) datetime64[ns] 1960-01-15 1960-02-15 1960-03-15 ... Data variables: sst (time, lat, lon) float64 nan nan nan nan nan nan nan nan nan ... Attributes: Conventions: IRIDL source: https://iridl.ldeo.columbia.edu/SOURCES/.NOAA/.NCDC/.ERSST/...
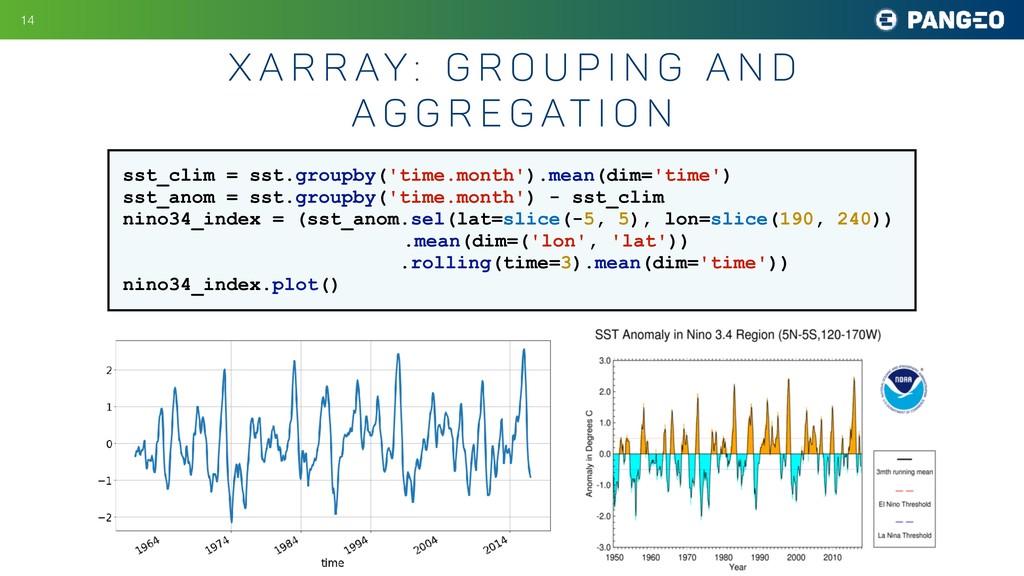
p i n g a n d a g g r e g at i o n !14 sst_clim = sst.groupby('time.month').mean(dim='time') sst_anom = sst.groupby('time.month') - sst_clim nino34_index = (sst_anom.sel(lat=slice(-5, 5), lon=slice(190, 240)) .mean(dim=('lon', 'lat')) .rolling(time=3).mean(dim='time')) nino34_index.plot()
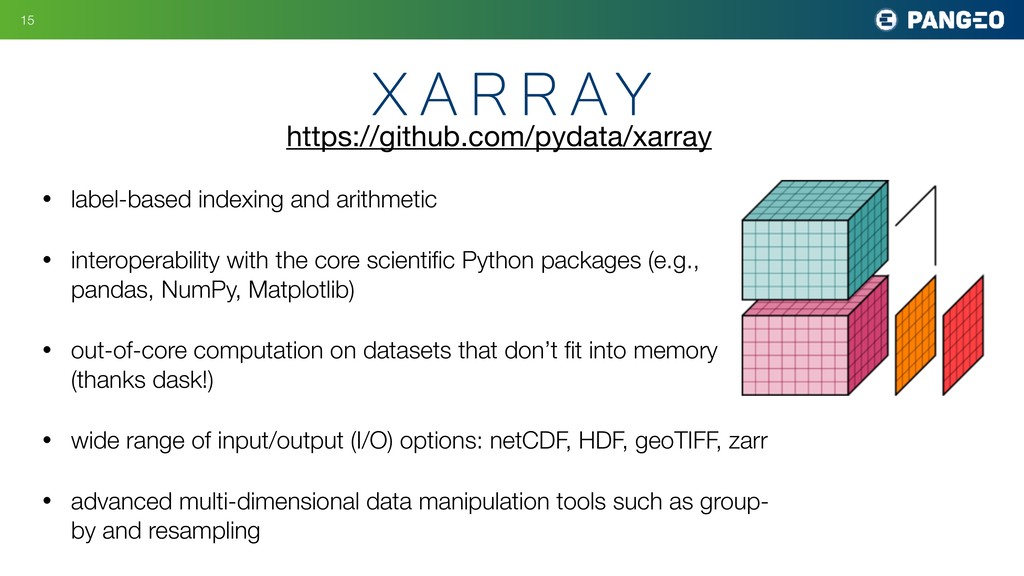
scientific Python packages (e.g., pandas, NumPy, Matplotlib) • out-of-core computation on datasets that don’t fit into memory (thanks dask!) • wide range of input/output (I/O) options: netCDF, HDF, geoTIFF, zarr • advanced multi-dimensional data manipulation tools such as group- by and resampling !15 x a r r ay https://github.com/pydata/xarray
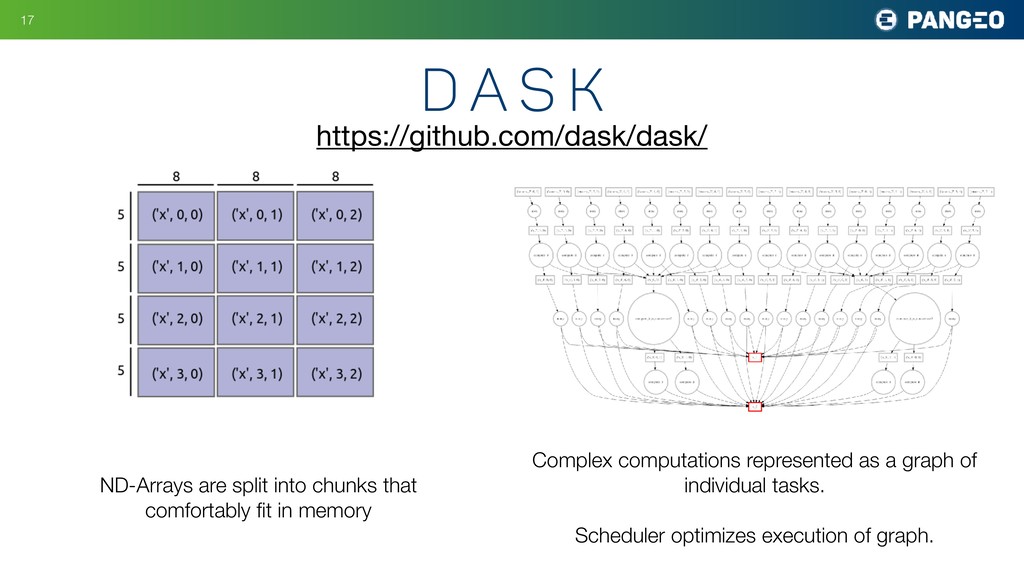
graph of individual tasks. Scheduler optimizes execution of graph. https://github.com/dask/dask/ ND-Arrays are split into chunks that comfortably fit in memory
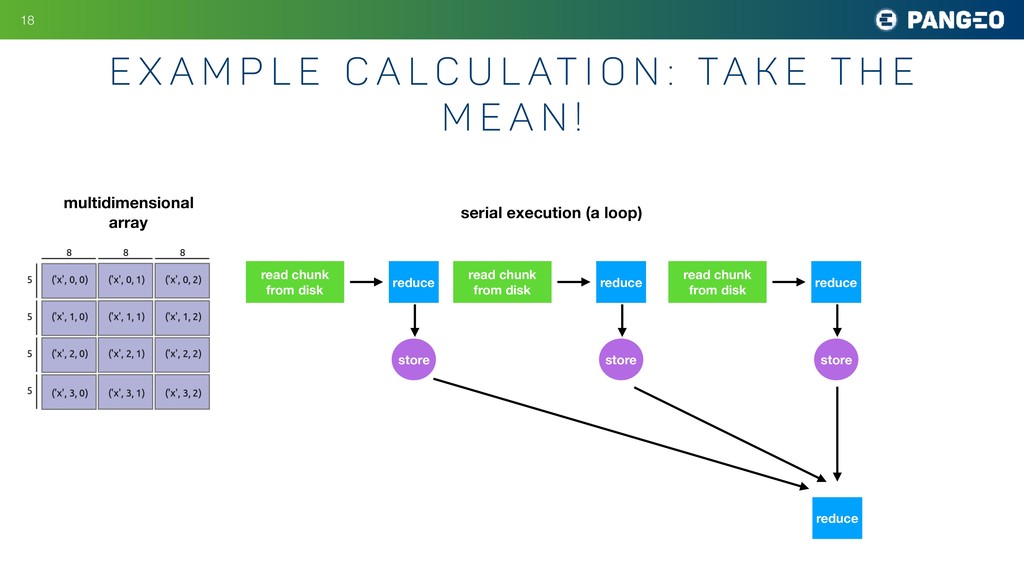
l c u l at i o n : Ta k e t h e M e a n ! multidimensional array read chunk from disk reduce store read chunk from disk reduce store read chunk from disk reduce store serial execution (a loop) reduce
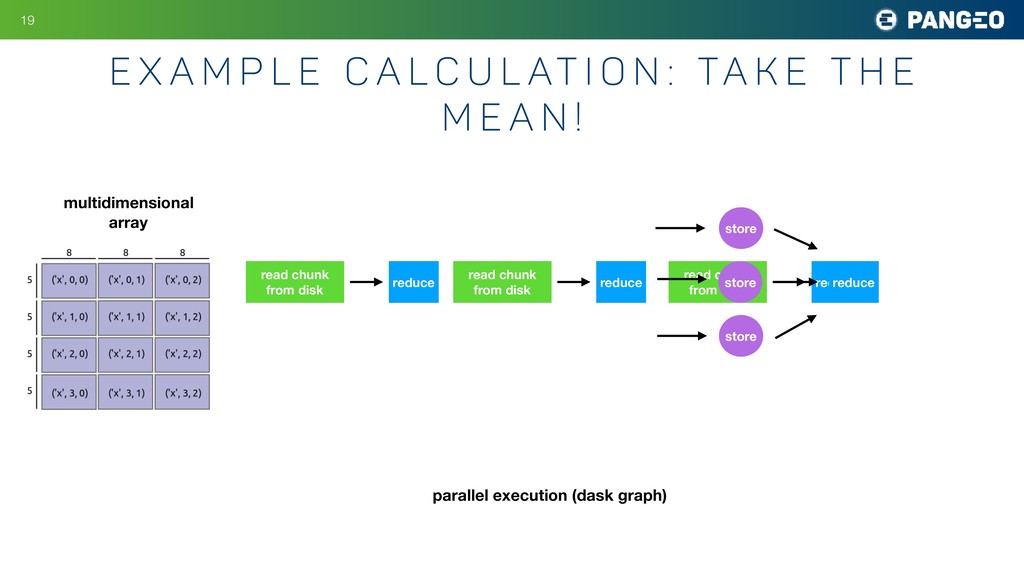
l c u l at i o n : Ta k e t h e M e a n ! multidimensional array read chunk from disk reduce read chunk from disk reduce read chunk from disk reduce store store store reduce parallel execution (dask graph)
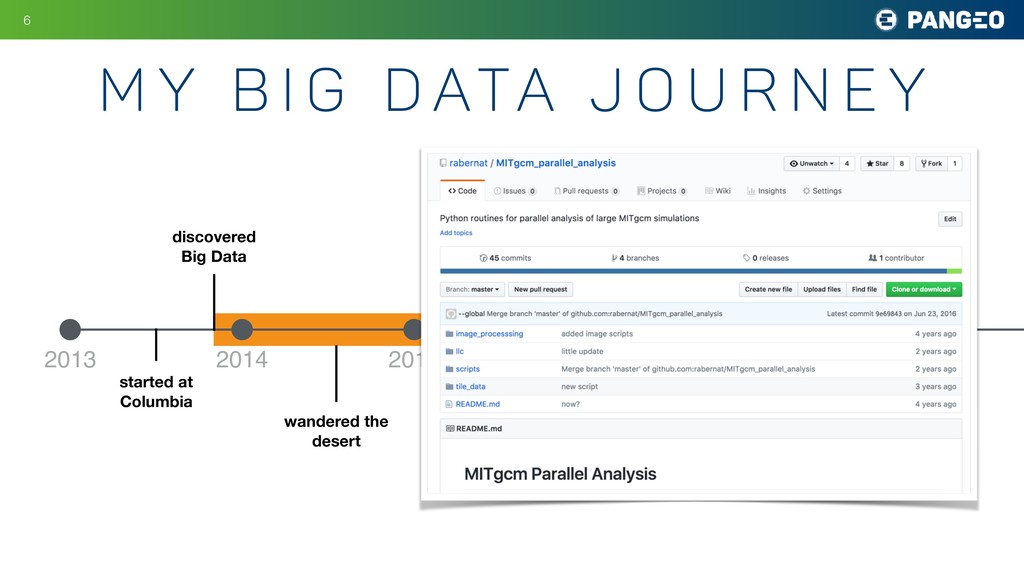
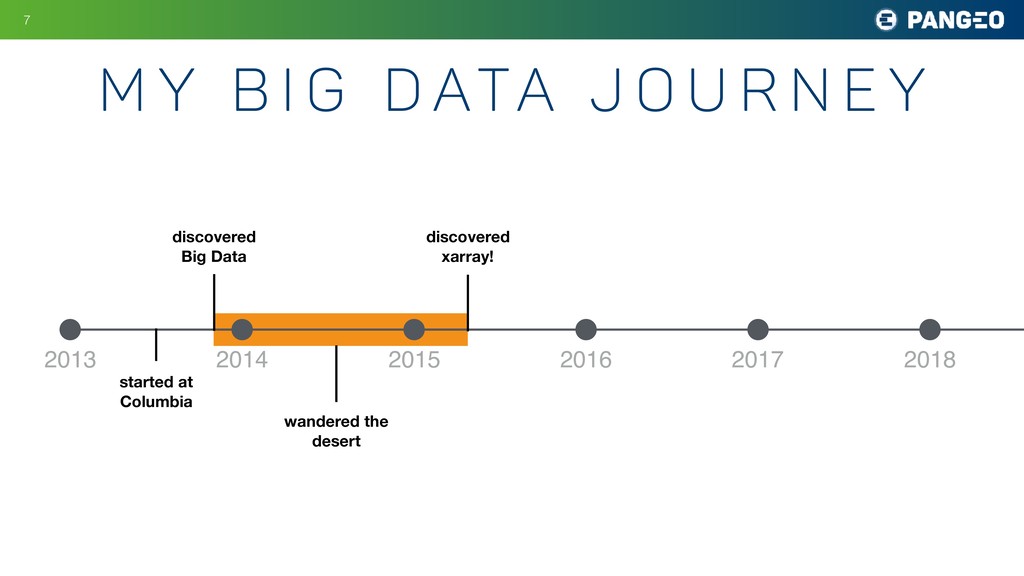
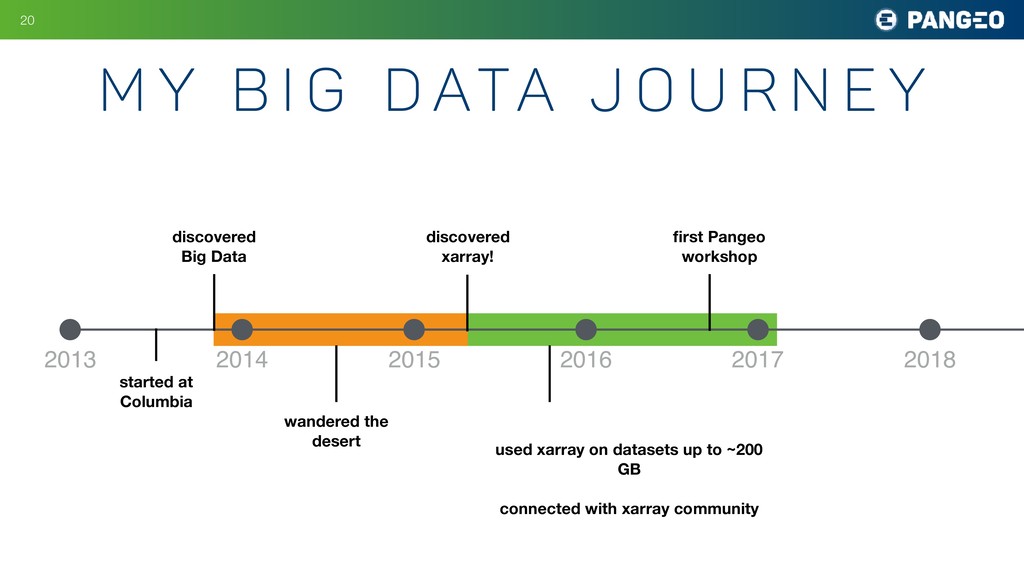
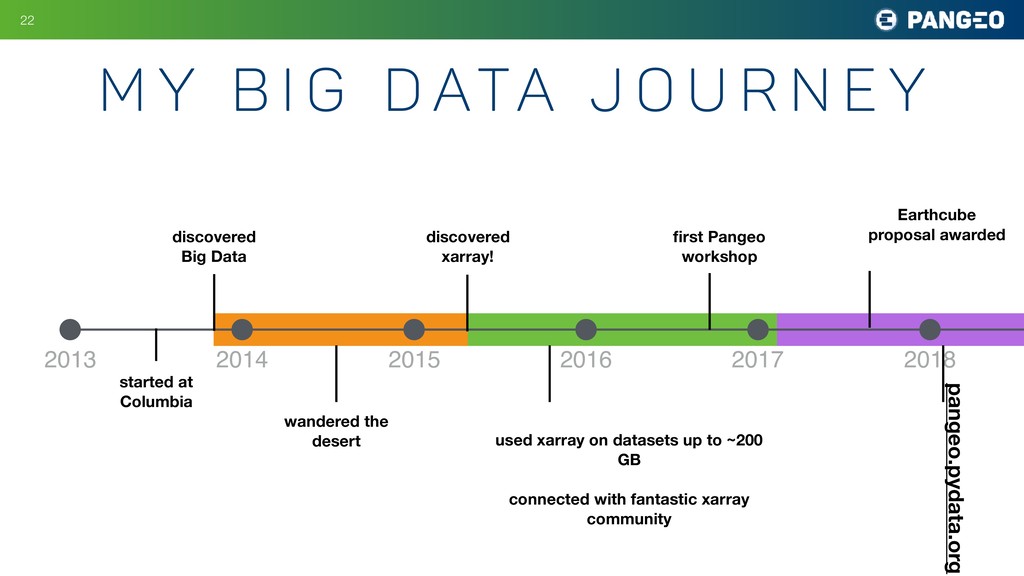
r n e y !20 2013 2014 2015 2016 2017 2018 discovered Big Data started at Columbia wandered the desert discovered xarray! used xarray on datasets up to ~200 GB connected with xarray community first Pangeo workshop
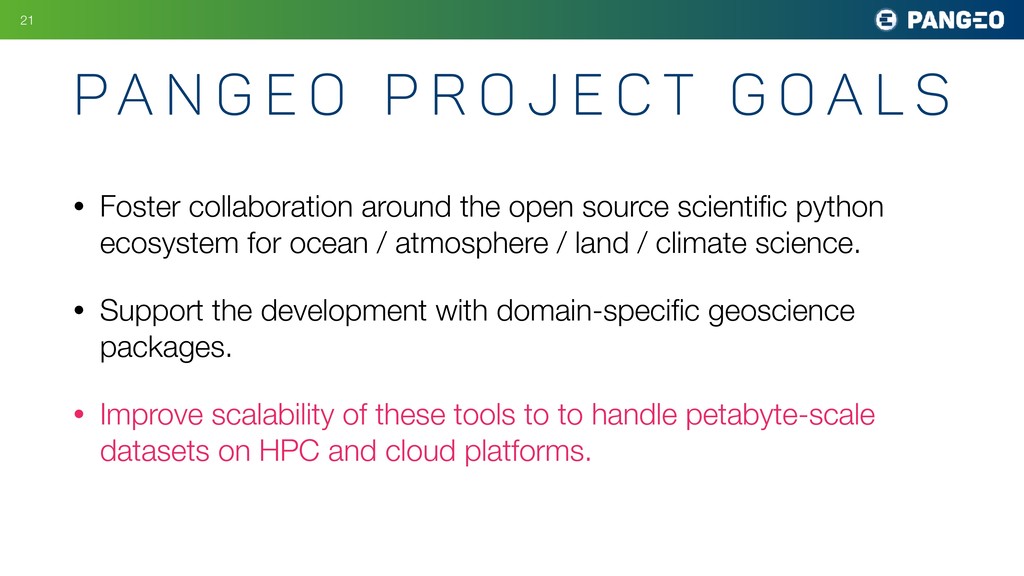
for ocean / atmosphere / land / climate science. • Support the development with domain-specific geoscience packages. • Improve scalability of these tools to to handle petabyte-scale datasets on HPC and cloud platforms. !21 Pa n g e o P r o j e c t g o a l s
r n e y !22 2013 2014 2015 2016 2017 2018 discovered Big Data started at Columbia wandered the desert discovered xarray! used xarray on datasets up to ~200 GB connected with fantastic xarray community first Pangeo workshop Earthcube proposal awarded pangeo.pydata.org
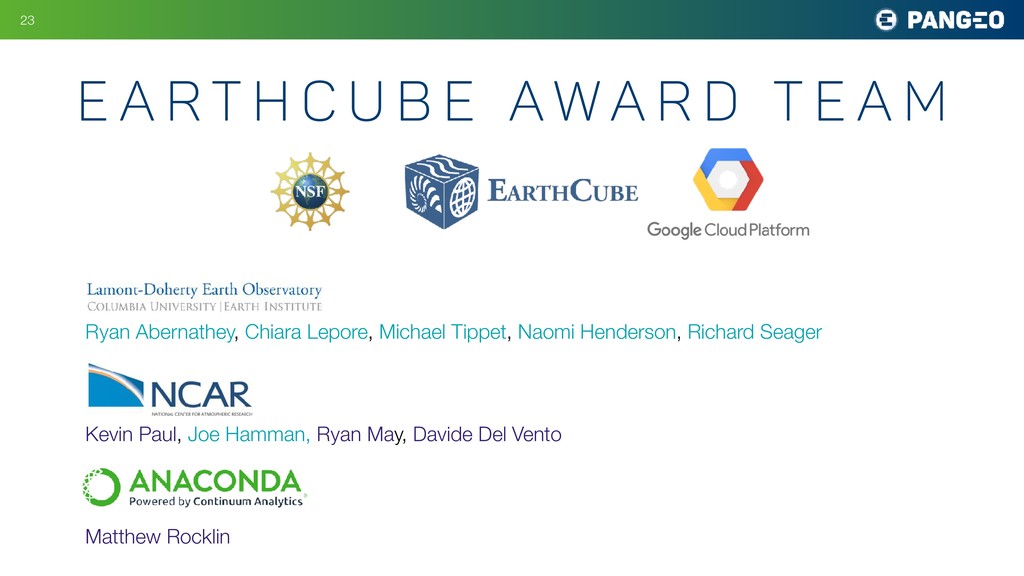
w a r d T e a m !23 Ryan Abernathey, Chiara Lepore, Michael Tippet, Naomi Henderson, Richard Seager Kevin Paul, Joe Hamman, Ryan May, Davide Del Vento Matthew Rocklin
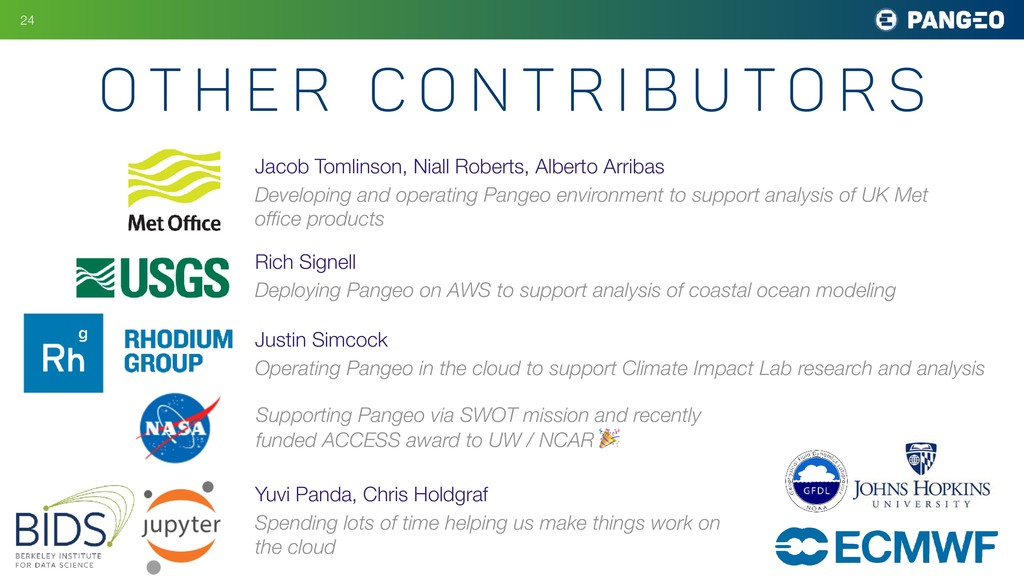
i b u t o r s !24 Jacob Tomlinson, Niall Roberts, Alberto Arribas Developing and operating Pangeo environment to support analysis of UK Met office products Rich Signell Deploying Pangeo on AWS to support analysis of coastal ocean modeling Justin Simcock Operating Pangeo in the cloud to support Climate Impact Lab research and analysis Supporting Pangeo via SWOT mission and recently funded ACCESS award to UW / NCAR Yuvi Panda, Chris Holdgraf Spending lots of time helping us make things work on the cloud
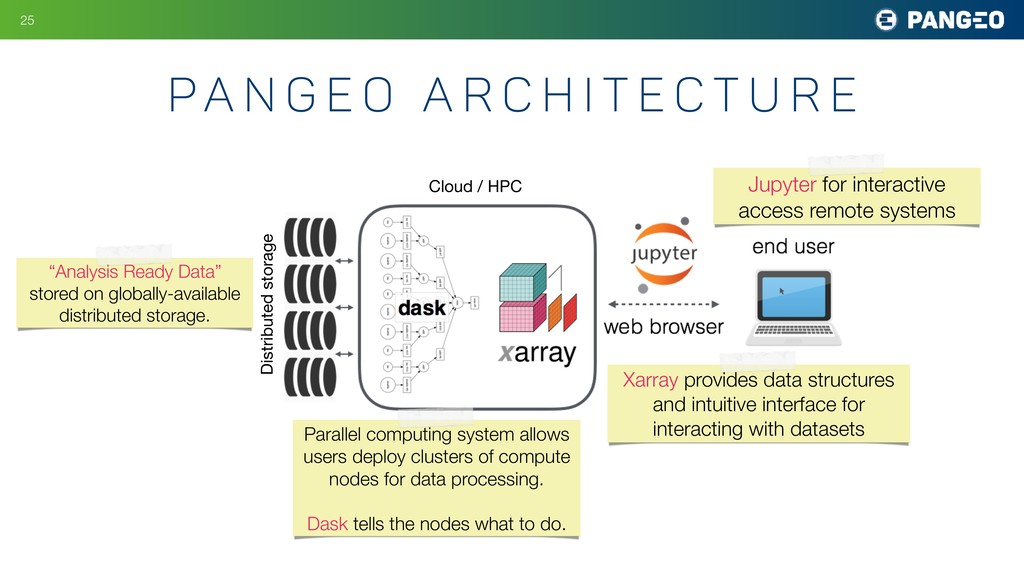
i t e c t u r e Jupyter for interactive access remote systems Cloud / HPC Xarray provides data structures and intuitive interface for interacting with datasets Parallel computing system allows users deploy clusters of compute nodes for data processing. Dask tells the nodes what to do. Distributed storage “Analysis Ready Data” stored on globally-available distributed storage.
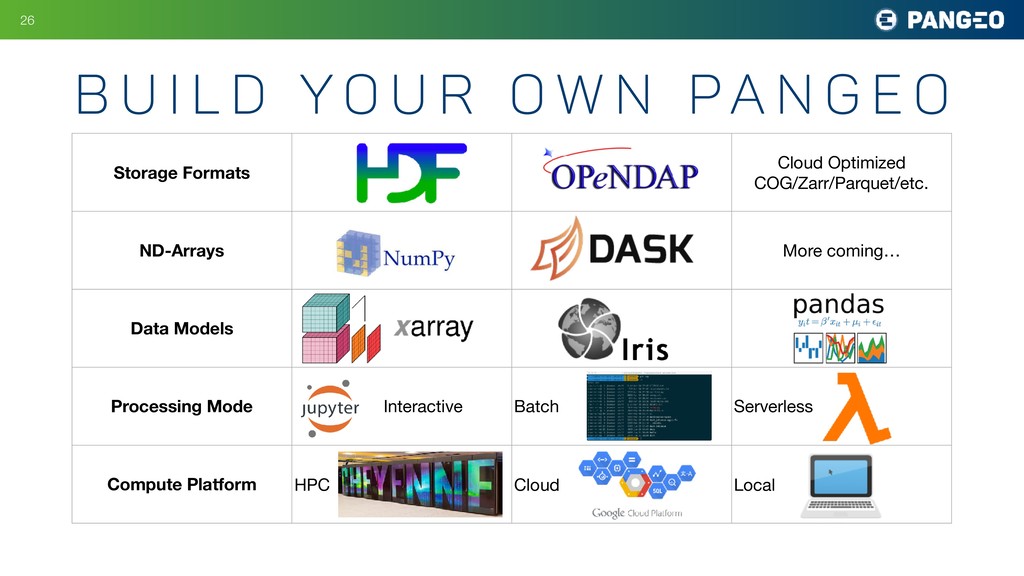
o w n pa n g e o Storage Formats Cloud Optimized COG/Zarr/Parquet/etc. ND-Arrays More coming… Data Models Processing Mode Interactive Batch Serverless Compute Platform HPC Cloud Local
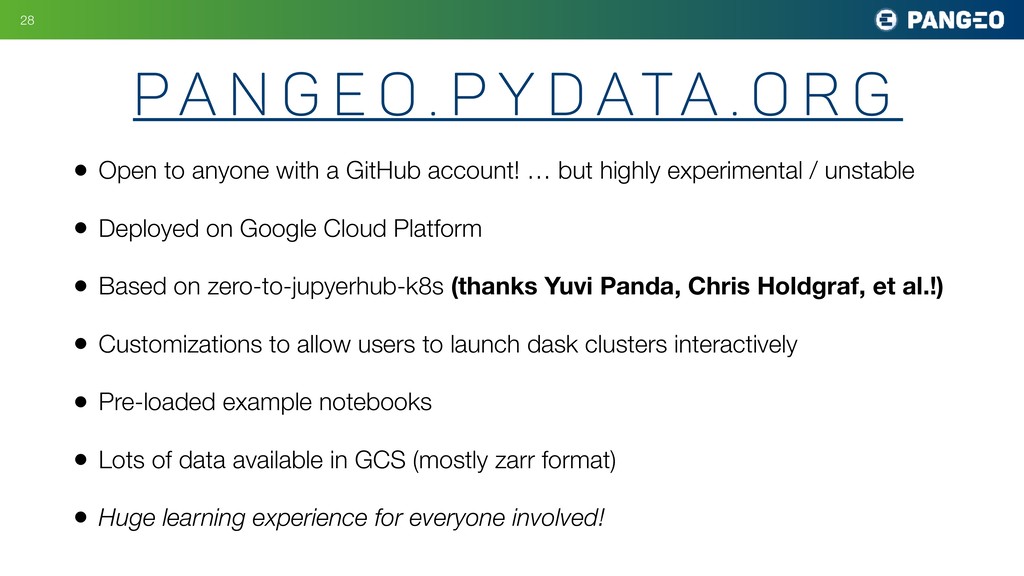
highly experimental / unstable • Deployed on Google Cloud Platform • Based on zero-to-jupyerhub-k8s (thanks Yuvi Panda, Chris Holdgraf, et al.!) • Customizations to allow users to launch dask clusters interactively • Pre-loaded example notebooks • Lots of data available in GCS (mostly zarr format) • Huge learning experience for everyone involved! !28 pa n g e o . p y d ata . o r g
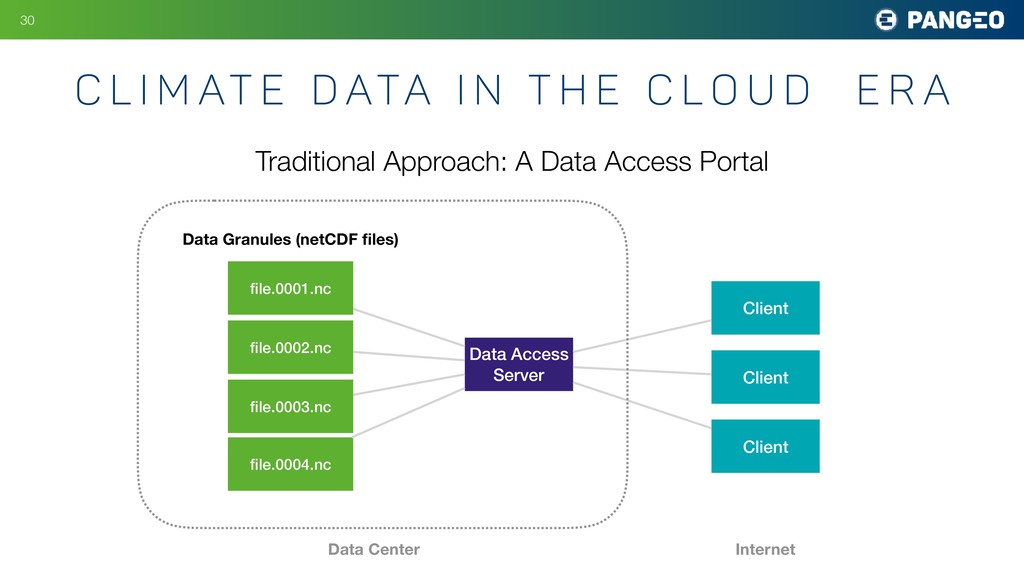
t h e C l o u d E R A !30 Traditional Approach: A Data Access Portal Data Access Server file.0001.nc file.0002.nc file.0003.nc file.0004.nc Data Granules (netCDF files) Client Client Client Data Center Internet
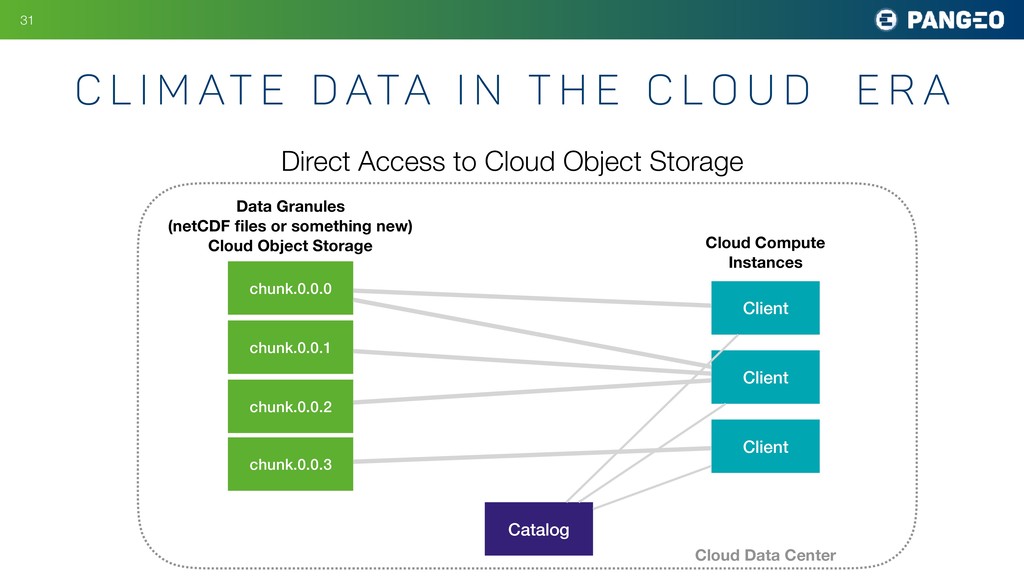
t h e C l o u d E R A !31 Direct Access to Cloud Object Storage Catalog chunk.0.0.0 chunk.0.0.1 chunk.0.0.2 chunk.0.0.3 Data Granules (netCDF files or something new) Cloud Object Storage Client Client Client Cloud Data Center Cloud Compute Instances
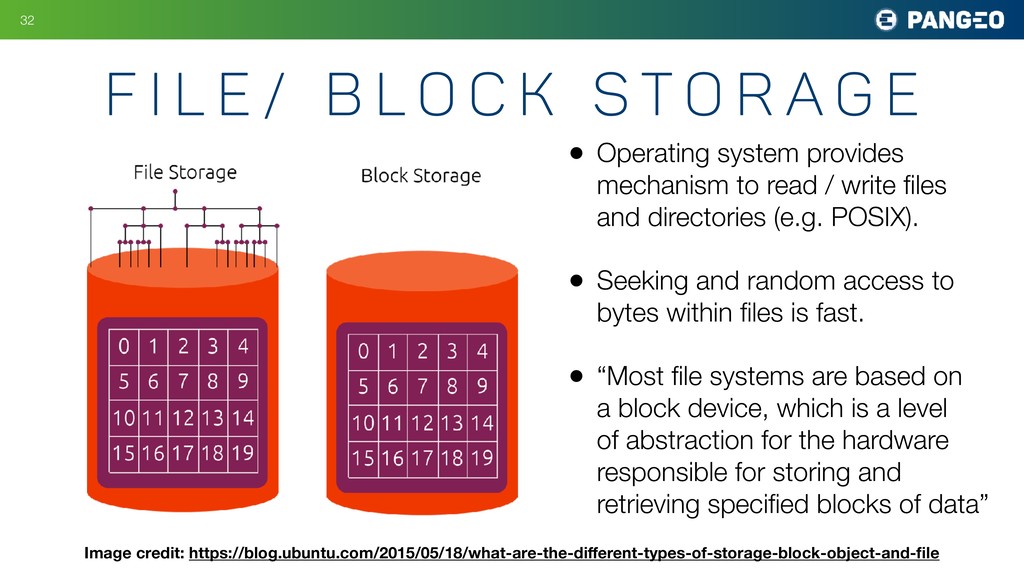
k s t o r a g e Image credit: https://blog.ubuntu.com/2015/05/18/what-are-the-different-types-of-storage-block-object-and-file • Operating system provides mechanism to read / write files and directories (e.g. POSIX). • Seeking and random access to bytes within files is fast. • “Most file systems are based on a block device, which is a level of abstraction for the hardware responsible for storing and retrieving specified blocks of data”
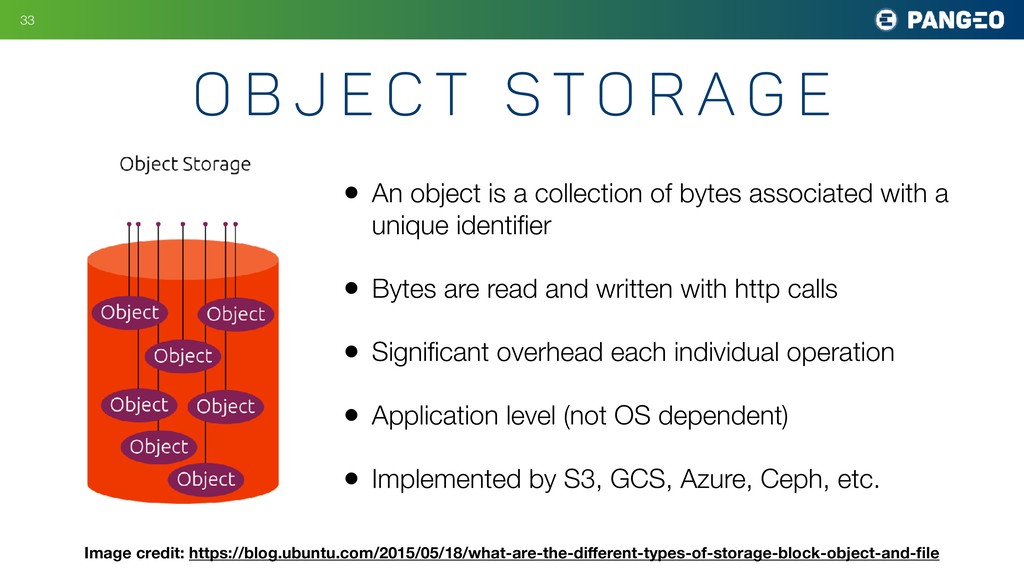
r a g e Image credit: https://blog.ubuntu.com/2015/05/18/what-are-the-different-types-of-storage-block-object-and-file • An object is a collection of bytes associated with a unique identifier • Bytes are read and written with http calls • Significant overhead each individual operation • Application level (not OS dependent) • Implemented by S3, GCS, Azure, Ceph, etc.
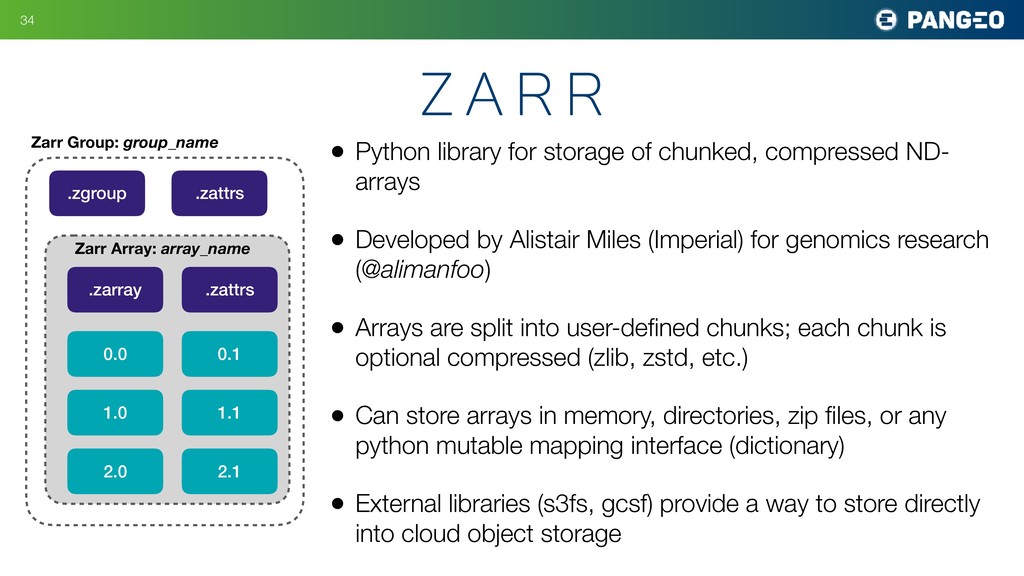
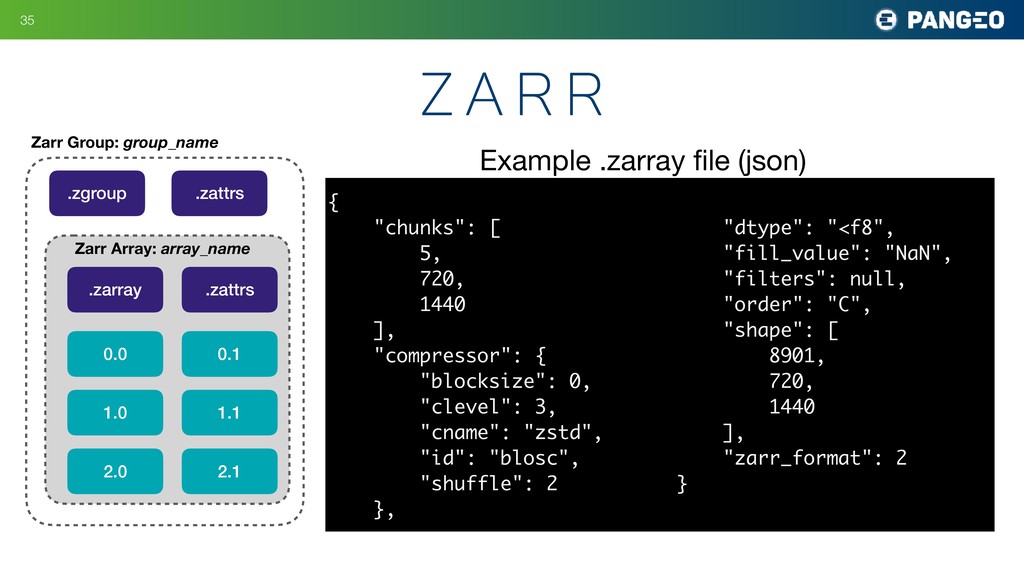
• Developed by Alistair Miles (Imperial) for genomics research (@alimanfoo) • Arrays are split into user-defined chunks; each chunk is optional compressed (zlib, zstd, etc.) • Can store arrays in memory, directories, zip files, or any python mutable mapping interface (dictionary) • External libraries (s3fs, gcsf) provide a way to store directly into cloud object storage !34 z a r r Zarr Group: group_name .zgroup .zattrs .zarray .zattrs Zarr Array: array_name 0.0 0.1 2.0 1.0 1.1 2.1
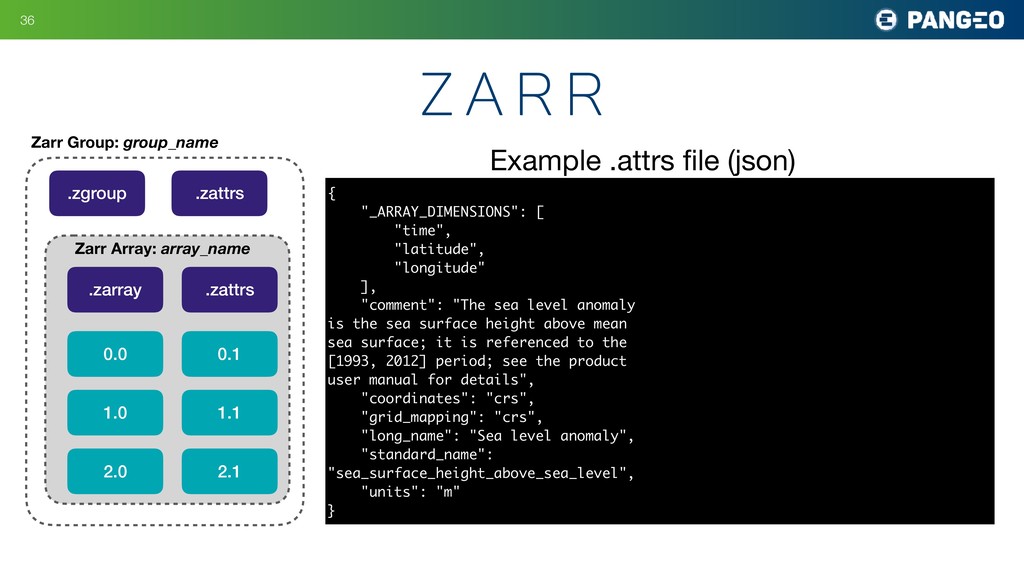
.zarray .zattrs Zarr Array: array_name 0.0 0.1 2.0 1.0 1.1 2.1 { "_ARRAY_DIMENSIONS": [ "time", "latitude", "longitude" ], "comment": "The sea level anomaly is the sea surface height above mean sea surface; it is referenced to the [1993, 2012] period; see the product user manual for details", "coordinates": "crs", "grid_mapping": "crs", "long_name": "Sea level anomaly", "standard_name": "sea_surface_height_above_sea_level", "units": "m" } Example .attrs file (json)
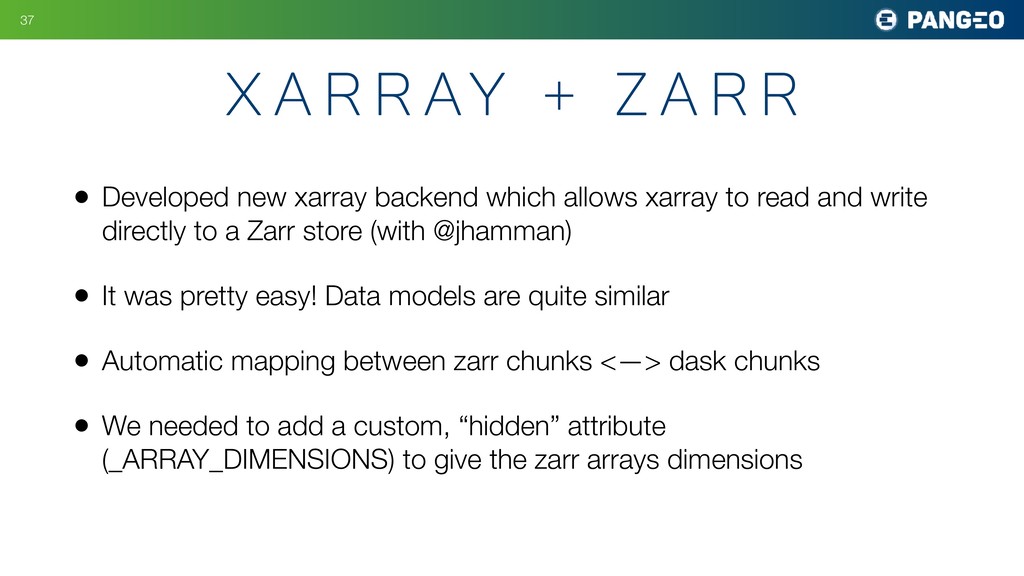
and write directly to a Zarr store (with @jhamman) • It was pretty easy! Data models are quite similar • Automatic mapping between zarr chunks <—> dask chunks • We needed to add a custom, “hidden” attribute (_ARRAY_DIMENSIONS) to give the zarr arrays dimensions !37 X a r r ay + z a r r
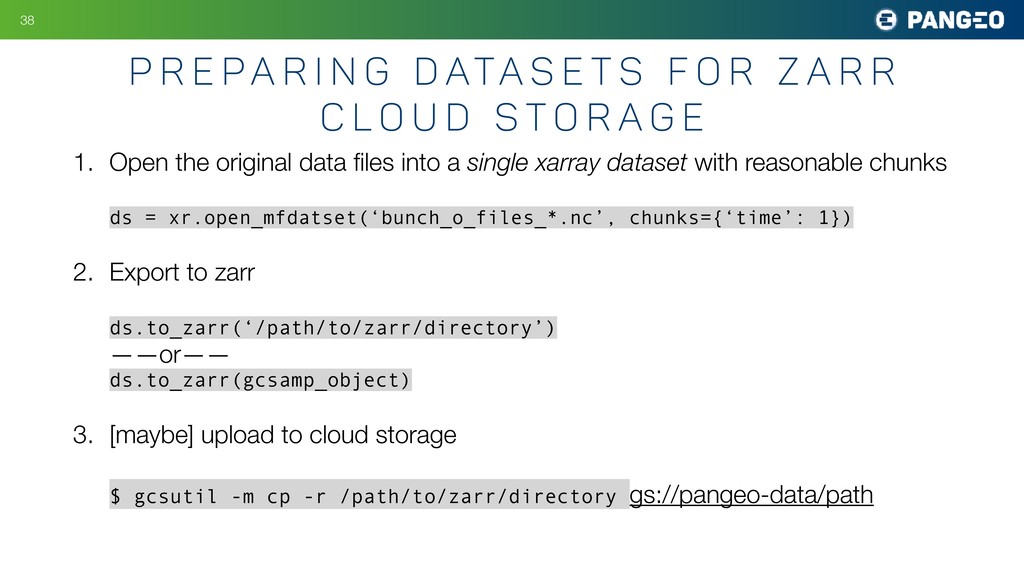
dataset with reasonable chunks ds = xr.open_mfdatset(‘bunch_o_files_*.nc’, chunks={‘time’: 1}) 2. Export to zarr ds.to_zarr(‘/path/to/zarr/directory’) ——or—— ds.to_zarr(gcsamp_object) 3. [maybe] upload to cloud storage $ gcsutil -m cp -r /path/to/zarr/directory gs://pangeo-data/path !38 P r e pa r i n g d ata s e t s f o r z a r r c l o u d s t o r a g e
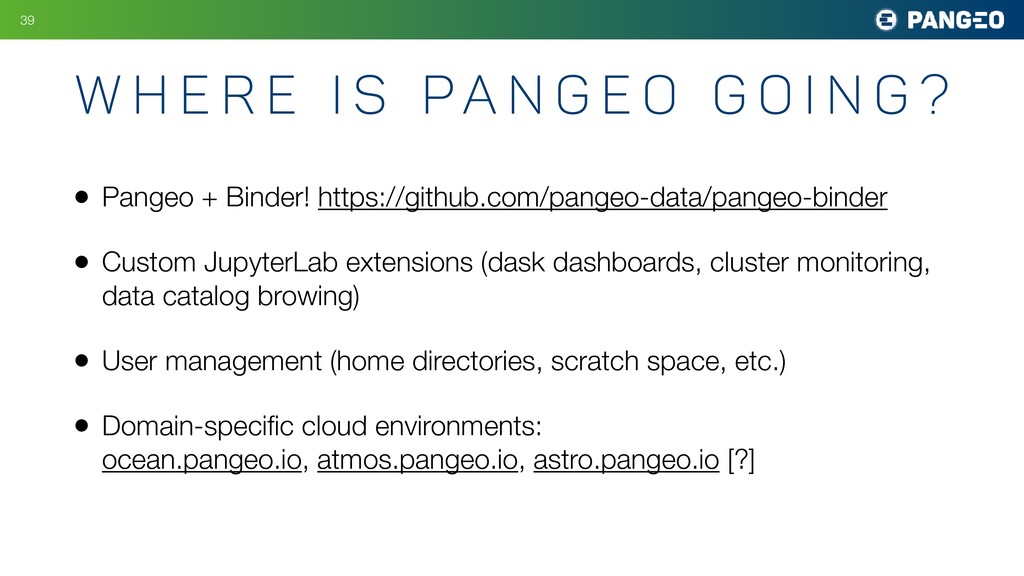
dashboards, cluster monitoring, data catalog browing) • User management (home directories, scratch space, etc.) • Domain-specific cloud environments: ocean.pangeo.io, atmos.pangeo.io, astro.pangeo.io [?] !39 W h e r e i s Pa n g e o G o i n g ?
an existing Pangeo deployment on an HPC cluster, or cloud resources (eg. pangeo.pydata.org) • Adapt Pangeo elements to meet your projects needs (data portals, etc.) and give feedback via github: github.com/pangeo-data/pangeo !40 H o w t o g e t i n v o lv e d http://pangeo.io


 rabernat
 inesmontani
 kevinliebholz
 techseoconnect
 morganepeng
 katarinadahlin
 cassininazir
.jpg) cargoodrich
cargoodrich
 aleyda
 ryanjones
 seathinner
 axbom
axbom