Presentation for my M.S. Thesis defense, in which I attempted to quantify the impact of Test-Driven Development on internal code quality using Object-Oriented metrics
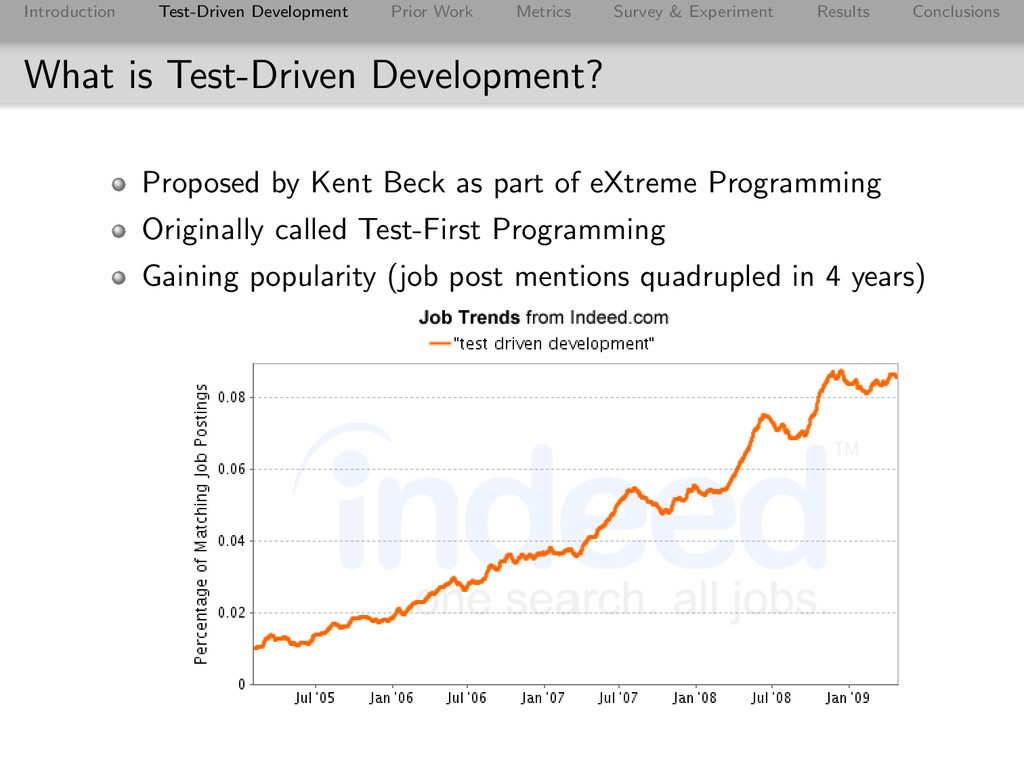
Conclusions What is Test-Driven Development? Proposed by Kent Beck as part of eXtreme Programming Originally called Test-First Programming Gaining popularity (job post mentions quadrupled in 4 years)
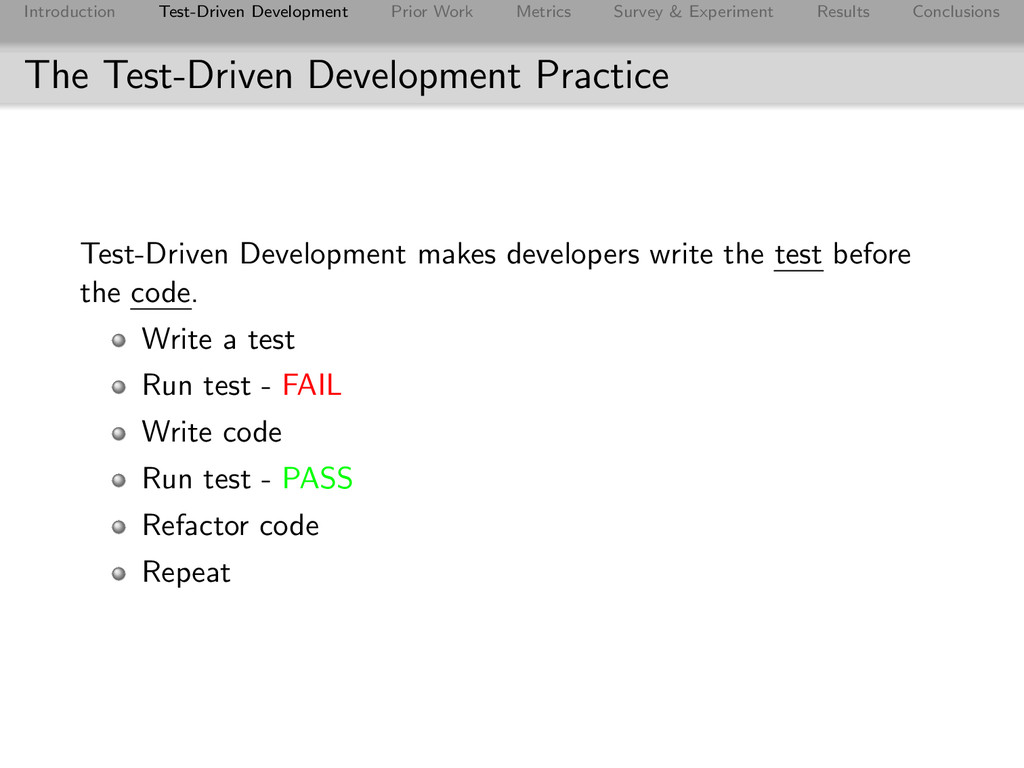
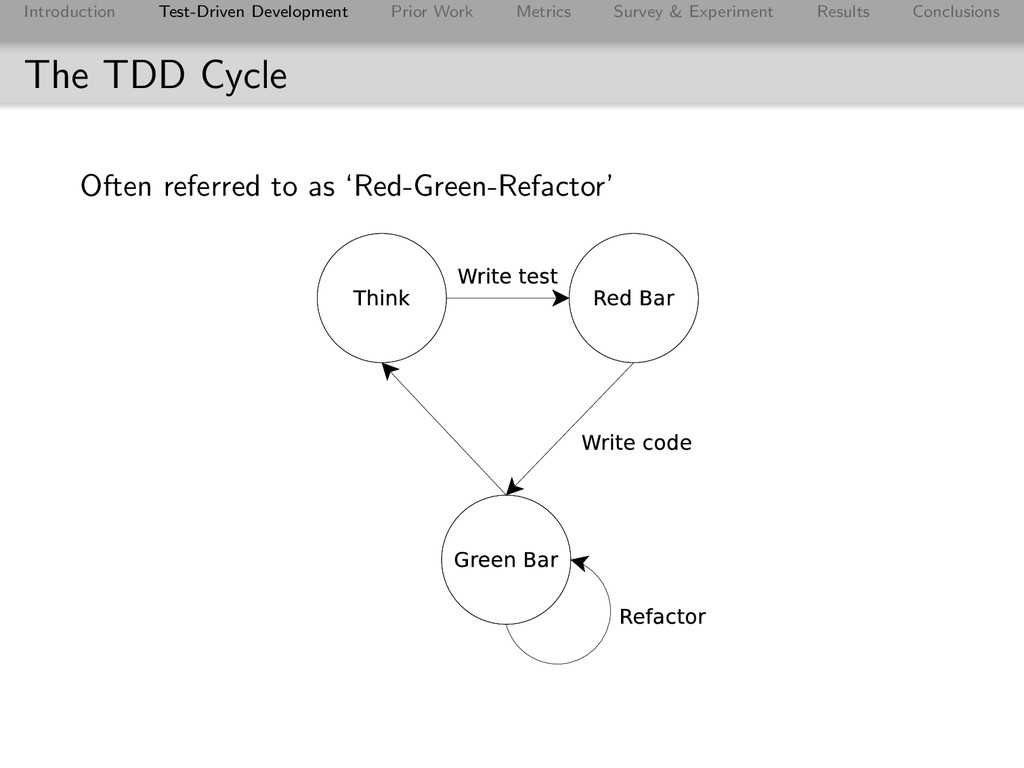
Conclusions The Test-Driven Development Practice Test-Driven Development makes developers write the test before the code. Write a test Run test - FAIL Write code Run test - PASS Refactor code Repeat
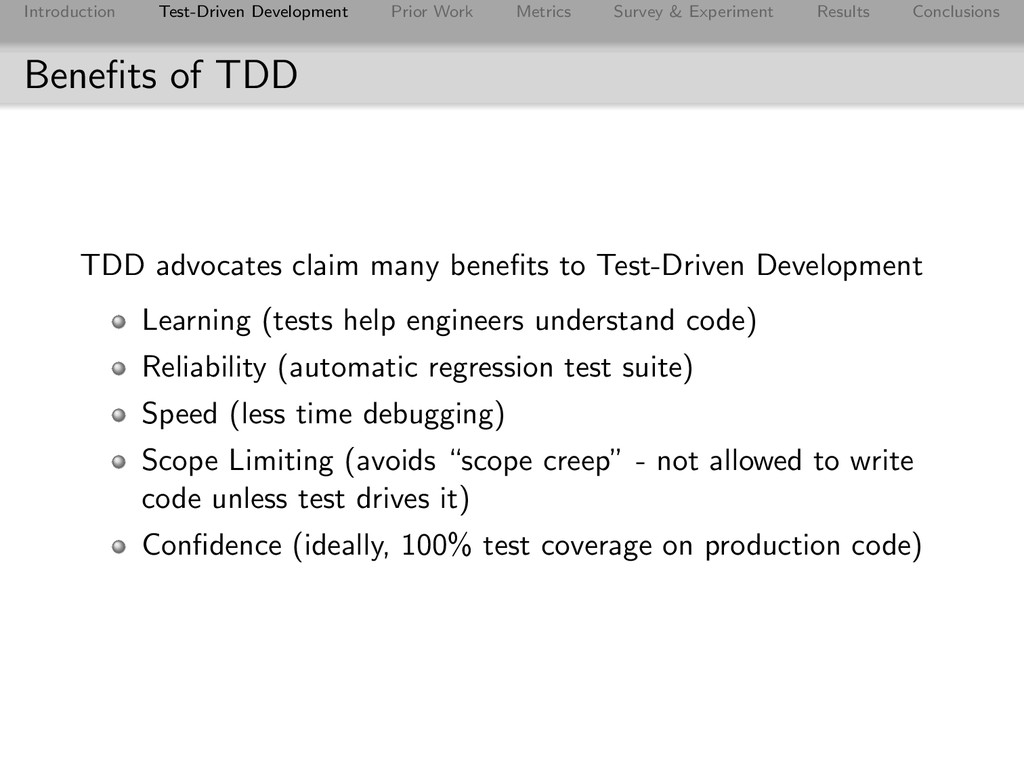
Conclusions Benefits of TDD TDD advocates claim many benefits to Test-Driven Development Learning (tests help engineers understand code) Reliability (automatic regression test suite) Speed (less time debugging) Scope Limiting (avoids “scope creep” - not allowed to write code unless test drives it) Confidence (ideally, 100% test coverage on production code)
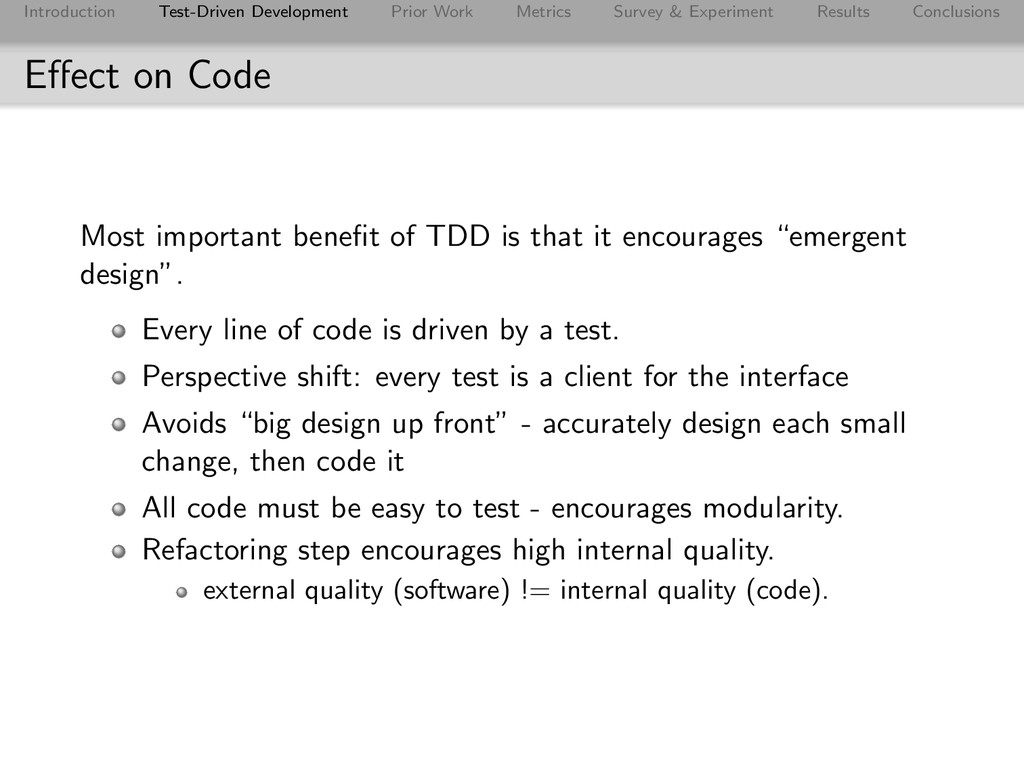
Conclusions Effect on Code Most important benefit of TDD is that it encourages “emergent design”. Every line of code is driven by a test. Perspective shift: every test is a client for the interface Avoids “big design up front” - accurately design each small change, then code it All code must be easy to test - encourages modularity. Refactoring step encourages high internal quality. external quality (software) != internal quality (code).
Conclusions Academic Studies Many studies are done in an academic setting, as a controlled experiment with students. The University of Karlsruhe Study The Bethel College Study ...many more
Conclusions Academic Study Issues Academic studies suffer from two main problems Students wouldn’t have to maintain code. Not real-world TDD usage Students typically learn TDD for the study. Newcomers struggle.
Conclusions The IBM Case Study Joint effort by IBM and researchers from North Carolina State University. 10 years developing device drivers: 7 releases 1st release: No TDD (with manual testing) 7th release: TDD Quality determined by functional test system
Conclusions The IBM Case Study Results Result: TDD increased quality TDD group test cases found 1.8x the defects (better test cases) TDD group defects per lines of code 40% reduced (fewer defects) Productivity the same for both teams
Conclusions The IBM Case Study Issues Measures external quality rather than internal quality Software, not code External quality refers to quality of what users see, internal quality refers to quality of what developers see. TDD promises better CODE, so internal quality must be studied.
Conclusions The Janzen Studies David Janzen’s PhD thesis performs code quality analysis on code written as part of an industrial experiment 4 industrial studies Training seminar (given a program to write, measured) Real-world code: No-Tests/TDD Real-world code: Test-Last/TDD Real-world code: TDD/Test-Last Applied many object oriented metrics to code produced
Conclusions The Janzen Studies Results TDD effective, but not very much. TDD decreased code complexity Only among seasoned developers. Newer developers wrote worse code with TDD Increased dependencies and amount of code, but that counts test code Most results not statistically significant - for the most part code was the same.
Conclusions The Janzen Studies Issues In-depth study of TDD on internal quality, but begs for additional work Counting test code in metrics artificially inflated dependencies and size “John Henry Effect”/Observer Effect Control and experimental groups knew they were control and experimental groups Knew that could would be measured according to code quality metrics Behavior may have been altered to try and increase internal quality beyond what they would do naturally May help explain lack of difference between two groups in industrial setting
Conclusions Summary Still a great deal to learn about TDD Most studies measure external quality, not internal quality. Good to know, but TDD is sold as a way to improve code quality, and should be measured accordingly Many studies are academic, not industrial. Not “real-world” - students don’t have to maintain code. Why write clean code? Doesn’t test how well TDD works after its been used for some time The studies that are both measuring internal quality and measuring industrial code may suffer from observer effect
Conclusions Next Steps Need to measure TDD in a manner more consistent with its supposed benefits. Problem: measuring defects doesn’t speak to internal quality Solution: use object oriented code metrics. Problem: academic setting doesn’t test real-world TDD Solution: measure real-world code used in production Problem: experimental apparatus may skew results Solution: measure code written without the knowledge that it would be measured Next Steps: apply object-oriented metrics to Open Source projects.
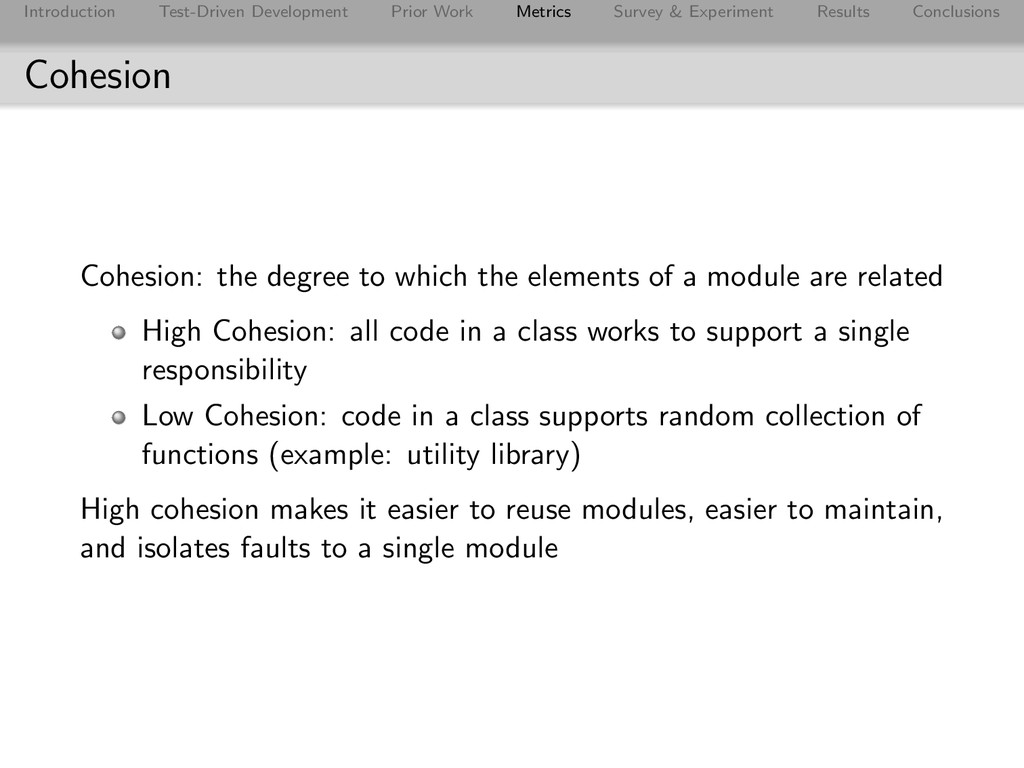
Conclusions Cohesion Cohesion: the degree to which the elements of a module are related High Cohesion: all code in a class works to support a single responsibility Low Cohesion: code in a class supports random collection of functions (example: utility library) High cohesion makes it easier to reuse modules, easier to maintain, and isolates faults to a single module
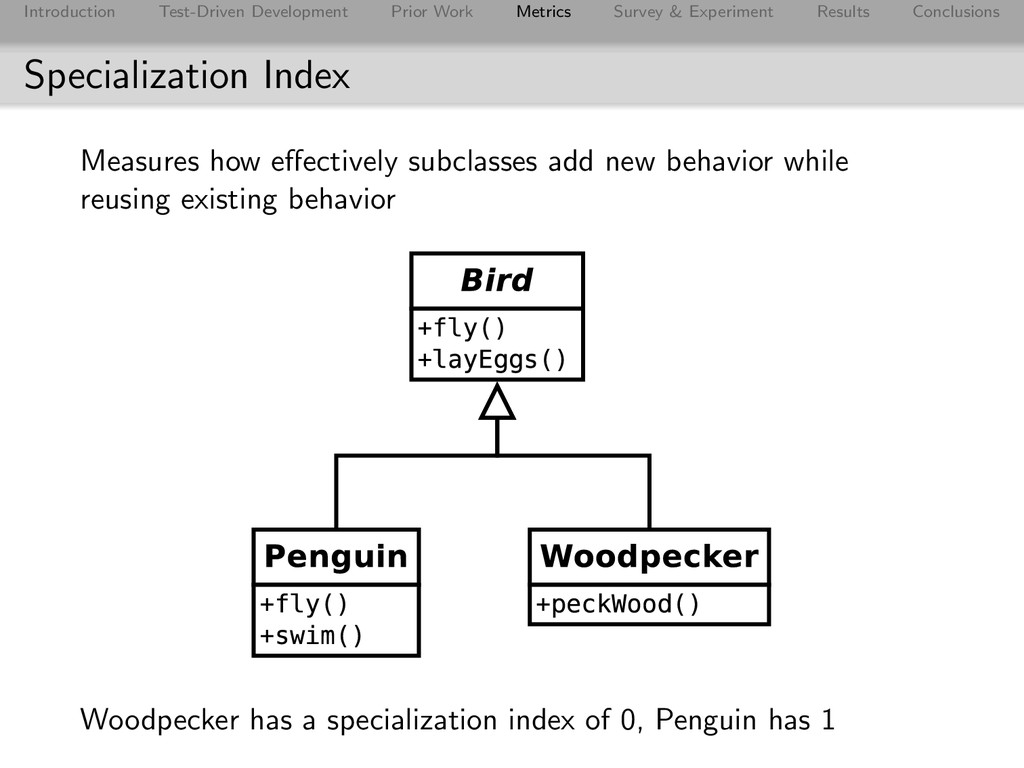
Conclusions Specialization Index Measures how effectively subclasses add new behavior while reusing existing behavior Woodpecker has a specialization index of 0, Penguin has 1
Conclusions Number of Method Parameters Method arguments represent data that the method does not have access to. Disconnect between the operations a class can perform and the data it needs to do the operation: lack of cohesion A method that takes 2 parameters is like a method that accesses two attributes that no other methods access. Similar to LCOM.
Conclusions Number of Static Methods Static methods belong to classes that do not own the data needed by the methods. Similar to method parameters, an indicator that the data for a responsibility and the implementation of that responsibility are separated
Conclusions Coupling Coupling is the degree to which modules are dependent upon other modules. Low Coupling: modules pass messages to others High Coupling: one module depends on the inner-workings of another module High coupling is bad: modifying one module requires modifying another. Modules cannot be understood in isolation. Reuse is difficult; requires pulling in additional modules.
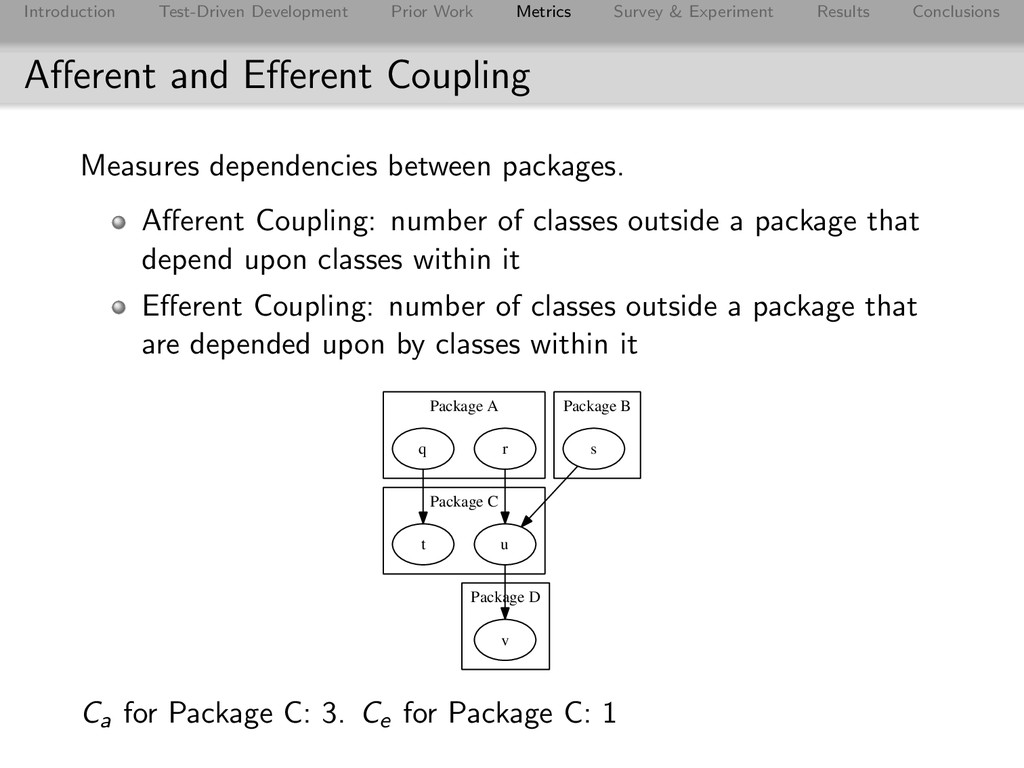
Conclusions Afferent and Efferent Coupling Measures dependencies between packages. Afferent Coupling: number of classes outside a package that depend upon classes within it Efferent Coupling: number of classes outside a package that are depended upon by classes within it Package A Package B Package C Package D q t r u s v Ca for Package C: 3. Ce for Package C: 1
Conclusions Instability and Abstractness Instability: the amount of work required to make a change (determined by a package’s afferent and efferent coupling) Stable package: many packages depend on it but it depends on few (hard to change, don’t need to) Instable package: few packages depend on it but it depends on many (easy to change, often need to) Abstractness: how easy a package is to extend Instability is okay: package should be as abstract as it is stable. Stable packages are difficult to change, so abstractness should make it easy to extend Instable packages are easy to change, so they should be concrete.
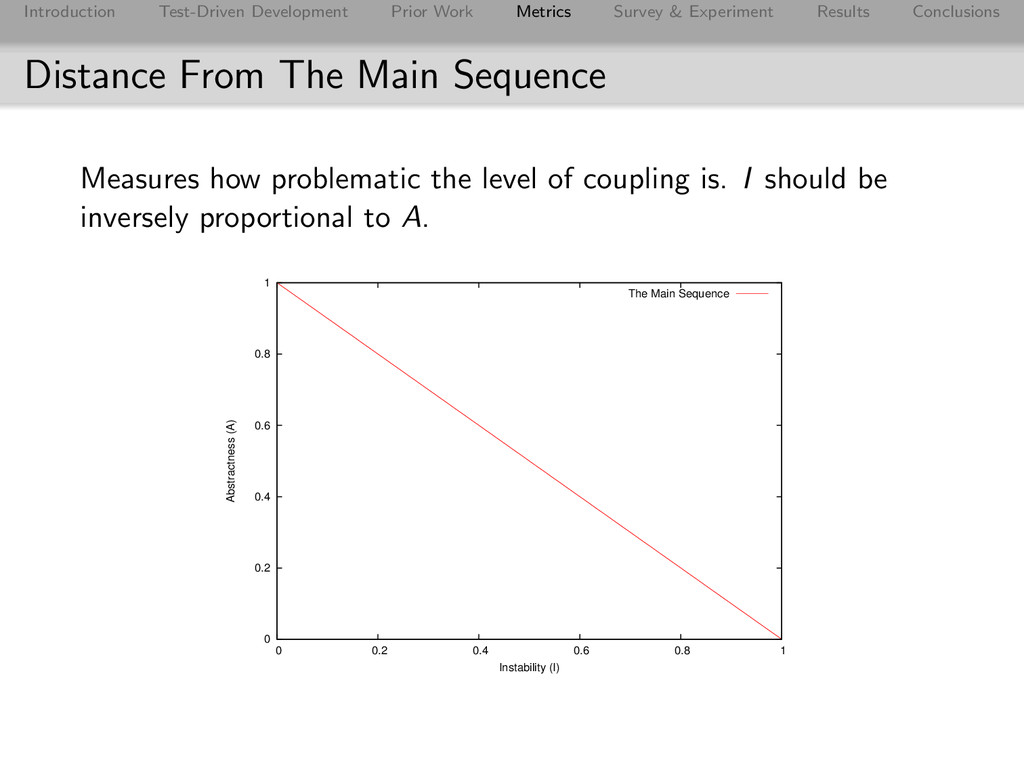
Conclusions Distance From The Main Sequence Measures how problematic the level of coupling is. I should be inversely proportional to A. 0 0.2 0.4 0.6 0.8 1 0 0.2 0.4 0.6 0.8 1 Abstractness (A) Instability (I) The Main Sequence
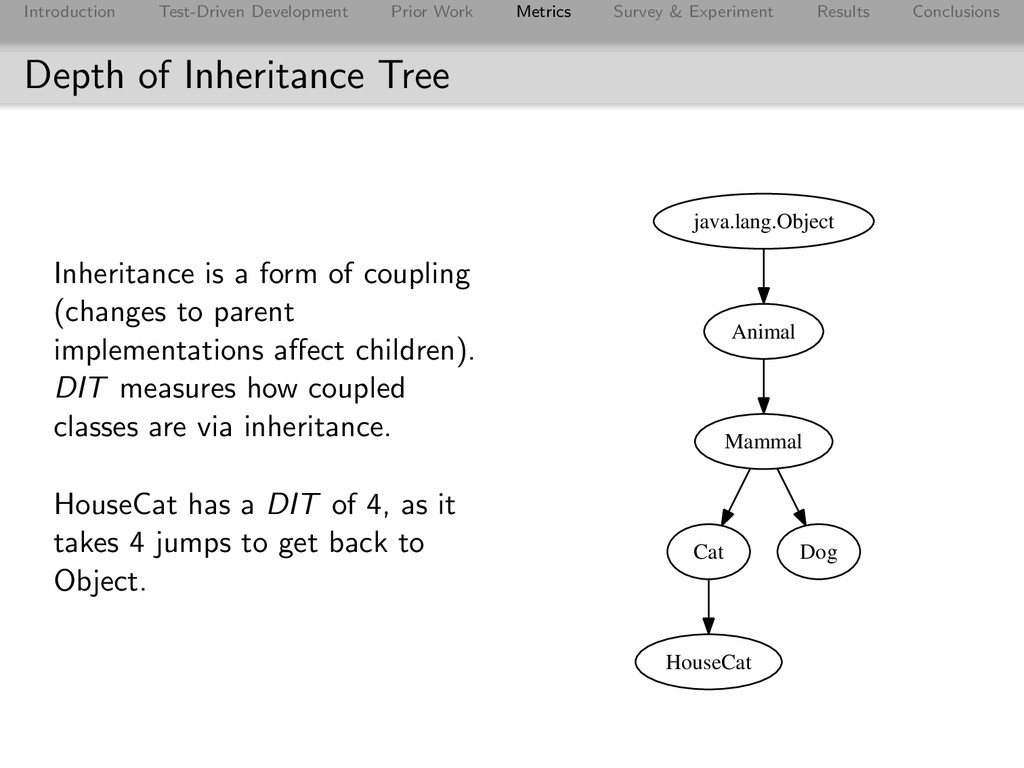
Conclusions Depth of Inheritance Tree Inheritance is a form of coupling (changes to parent implementations affect children). DIT measures how coupled classes are via inheritance. HouseCat has a DIT of 4, as it takes 4 jumps to get back to Object. java.lang.Object Animal Mammal Cat Dog HouseCat
Conclusions Complexity The effort needed to understand and modify the code. Low Complexity: classes are relatively easy to read, understand, and change. High Complexity: classes are confusing Low Complexity is better. Code is easier to understand.
Conclusions Size of Classes and Methods Long methods and large classes are difficult to understand. Lines of code are easy to measure (but don’t count comments or whitespace). Total Lines of Code not counted, as that is a measure of software complexity, not code complexity (more complex software will always have more code)
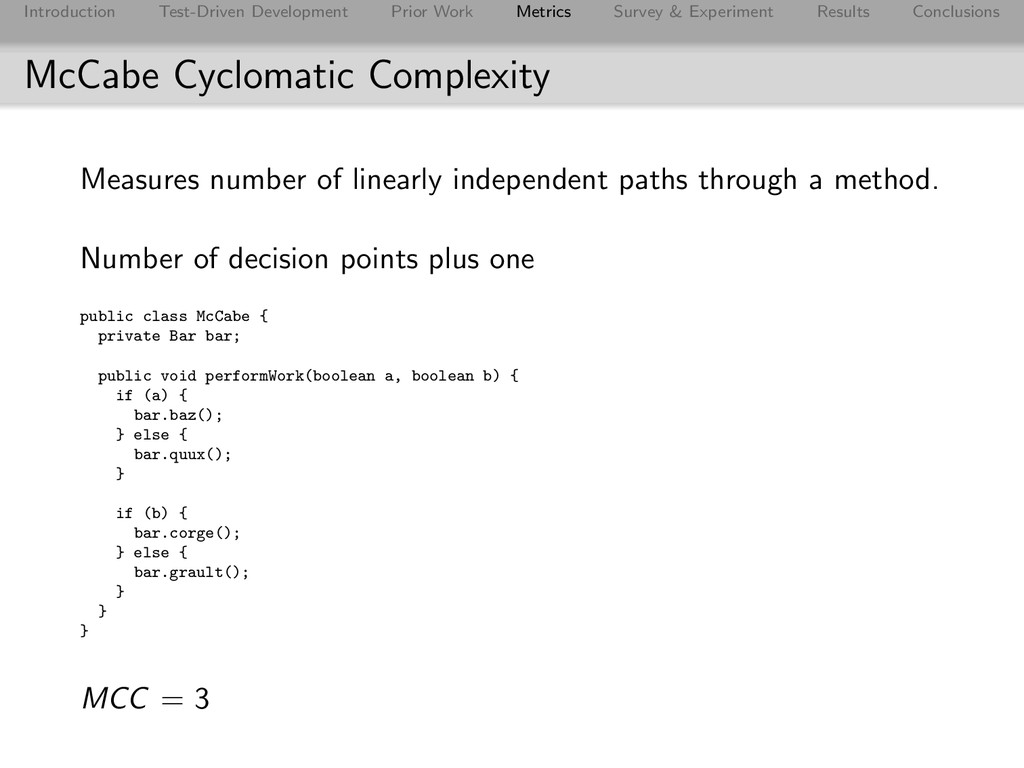
Conclusions McCabe Cyclomatic Complexity Measures number of linearly independent paths through a method. Number of decision points plus one public class McCabe { private Bar bar; public void performWork(boolean a, boolean b) { if (a) { bar.baz(); } else { bar.quux(); } if (b) { bar.corge(); } else { bar.grault(); } } } MCC = 3
Conclusions Creating Groups Created two groups of Open Source projects - one using TDD, one not. Sent surveys to dozens of projects asking people how often they used TDD and if they are committers or contributors Only results from committers used.
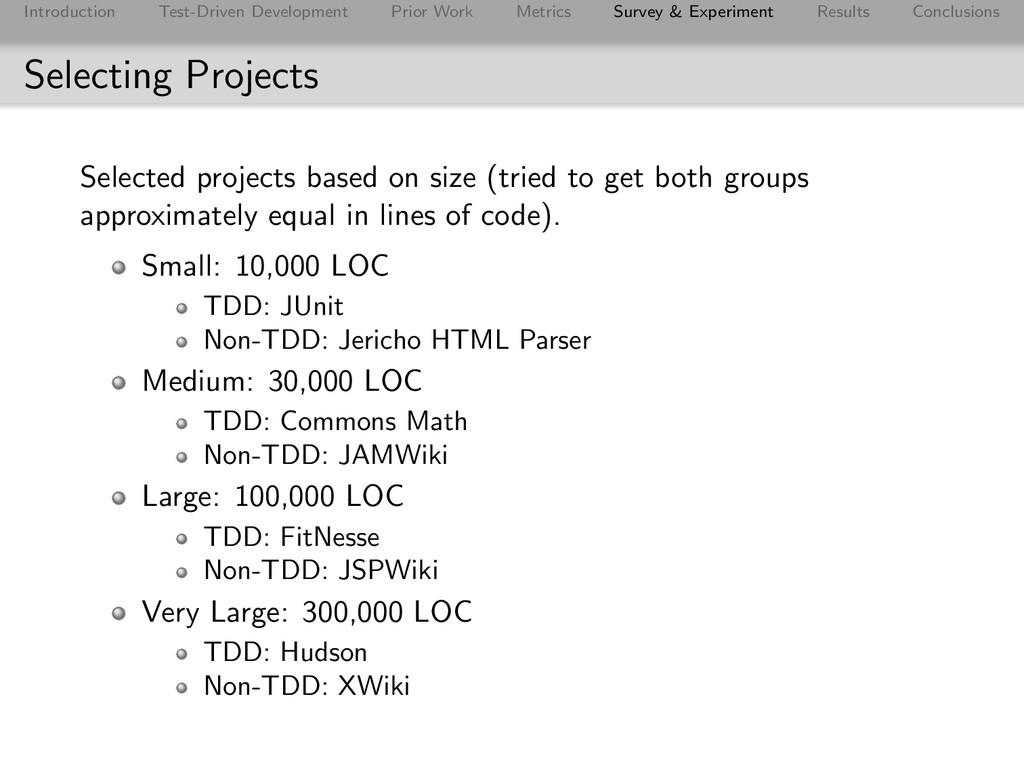
Conclusions Selecting Projects Selected projects based on size (tried to get both groups approximately equal in lines of code). Small: 10,000 LOC TDD: JUnit Non-TDD: Jericho HTML Parser Medium: 30,000 LOC TDD: Commons Math Non-TDD: JAMWiki Large: 100,000 LOC TDD: FitNesse Non-TDD: JSPWiki Very Large: 300,000 LOC TDD: Hudson Non-TDD: XWiki
Conclusions Measuring Internal Quality Eclipse Metrics tool used to track metrics previously discussed. Excluded from measurement: test code, generated code, example code.
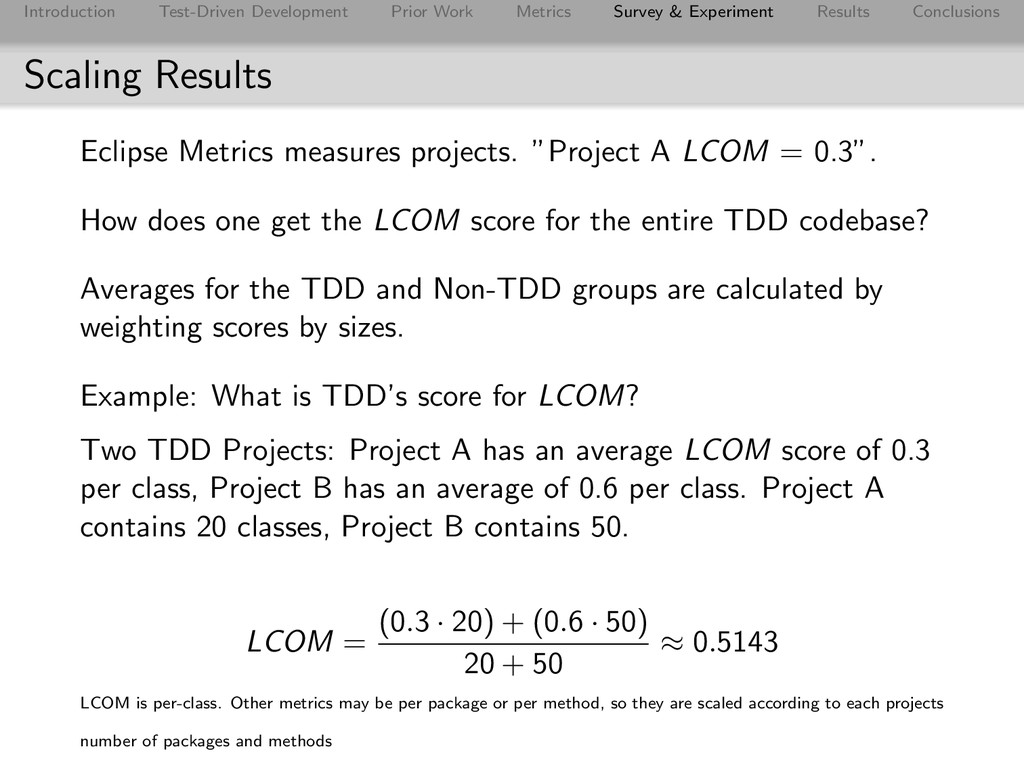
Conclusions Scaling Results Eclipse Metrics measures projects. ”Project A LCOM = 0.3”. How does one get the LCOM score for the entire TDD codebase? Averages for the TDD and Non-TDD groups are calculated by weighting scores by sizes. Example: What is TDD’s score for LCOM? Two TDD Projects: Project A has an average LCOM score of 0.3 per class, Project B has an average of 0.6 per class. Project A contains 20 classes, Project B contains 50. LCOM = (0.3 · 20) + (0.6 · 50) 20 + 50 ≈ 0.5143 LCOM is per-class. Other metrics may be per package or per method, so they are scaled according to each projects number of packages and methods
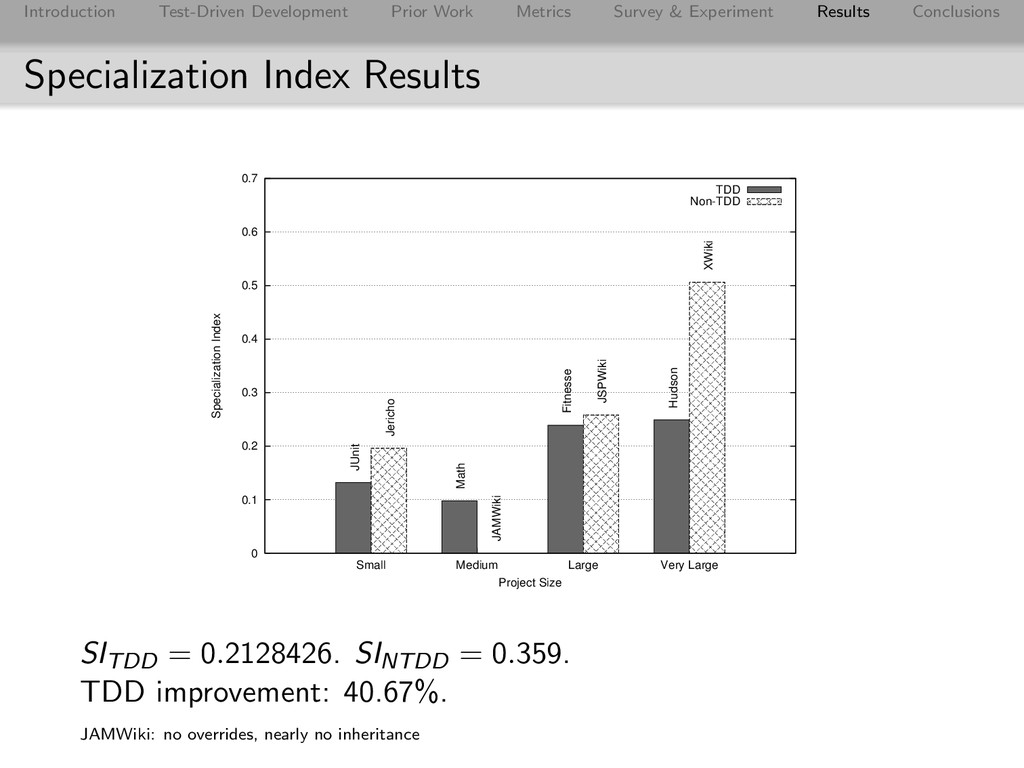
Conclusions Specialization Index Results 0 0.1 0.2 0.3 0.4 0.5 0.6 0.7 Small Medium Large Very Large Specialization Index Project Size TDD Non-TDD JUnit Math Fitnesse Hudson Jericho JAMWiki JSPWiki XWiki SITDD = 0.2128426. SINTDD = 0.359. TDD improvement: 40.67%. JAMWiki: no overrides, nearly no inheritance
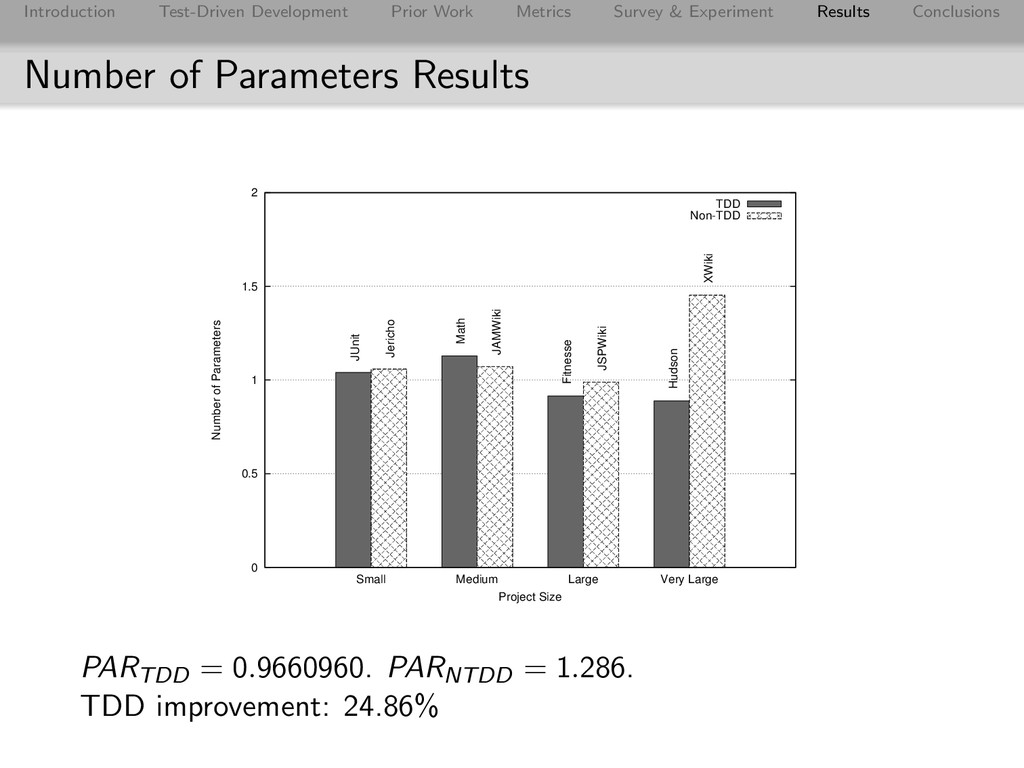
Conclusions Number of Parameters Results 0 0.5 1 1.5 2 Small Medium Large Very Large Number of Parameters Project Size TDD Non-TDD JUnit Math Fitnesse Hudson Jericho JAMWiki JSPWiki XWiki PARTDD = 0.9660960. PARNTDD = 1.286. TDD improvement: 24.86%
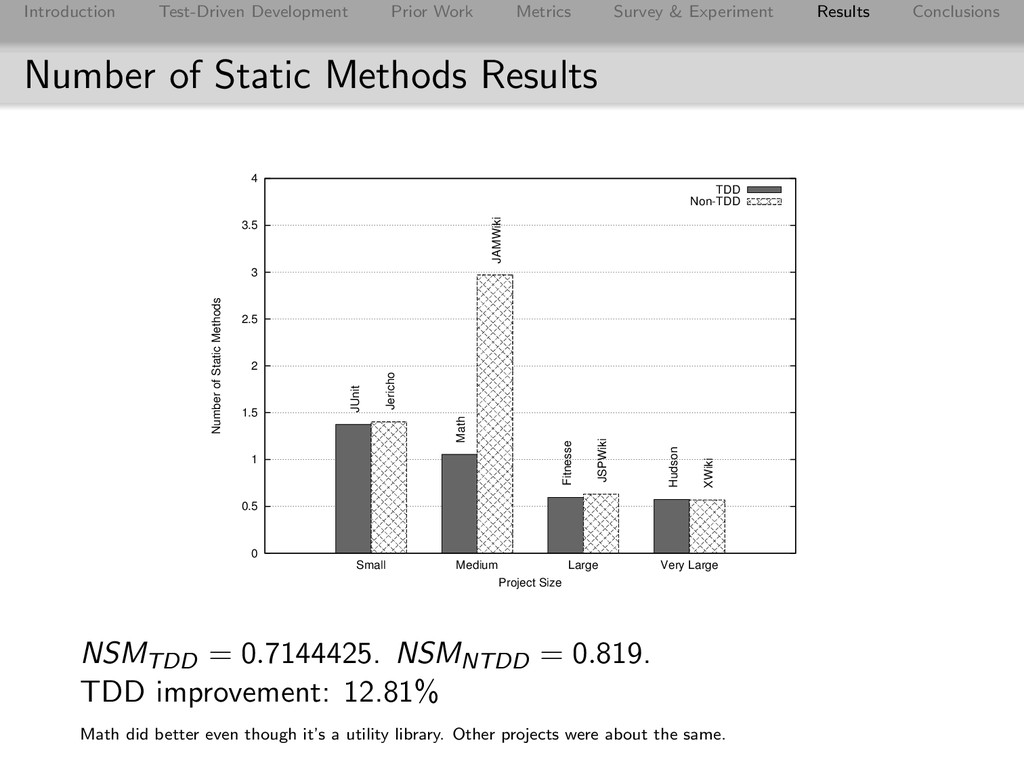
Conclusions Number of Static Methods Results 0 0.5 1 1.5 2 2.5 3 3.5 4 Small Medium Large Very Large Number of Static Methods Project Size TDD Non-TDD JUnit Math Fitnesse Hudson Jericho JAMWiki JSPWiki XWiki NSMTDD = 0.7144425. NSMNTDD = 0.819. TDD improvement: 12.81% Math did better even though it’s a utility library. Other projects were about the same.
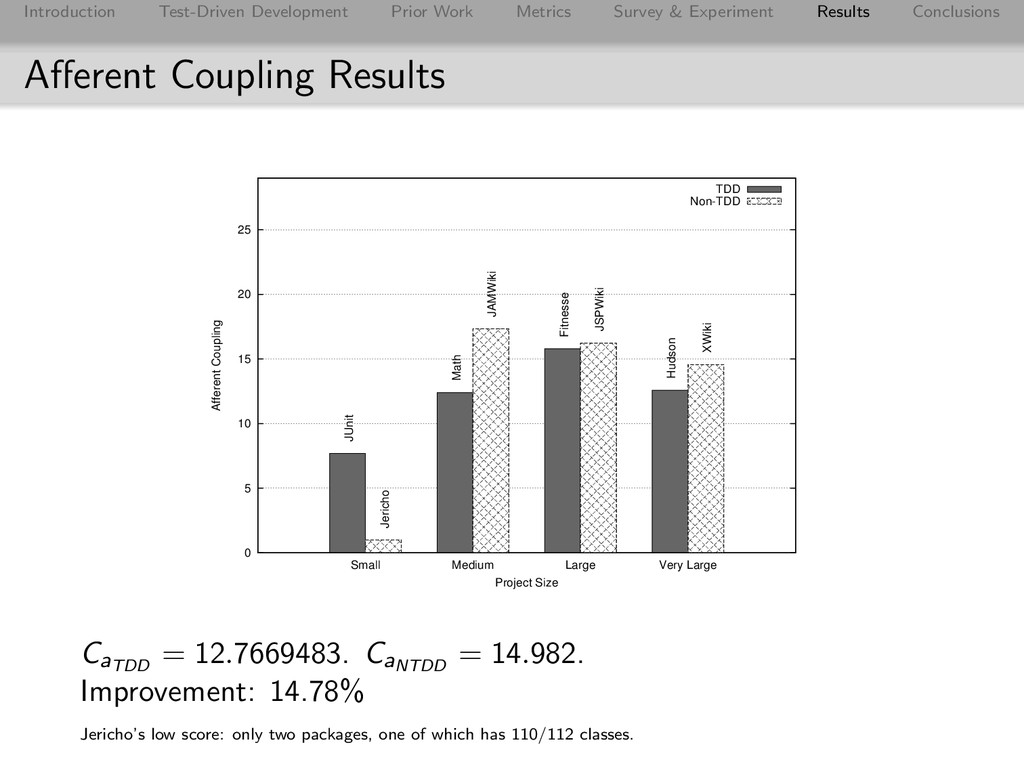
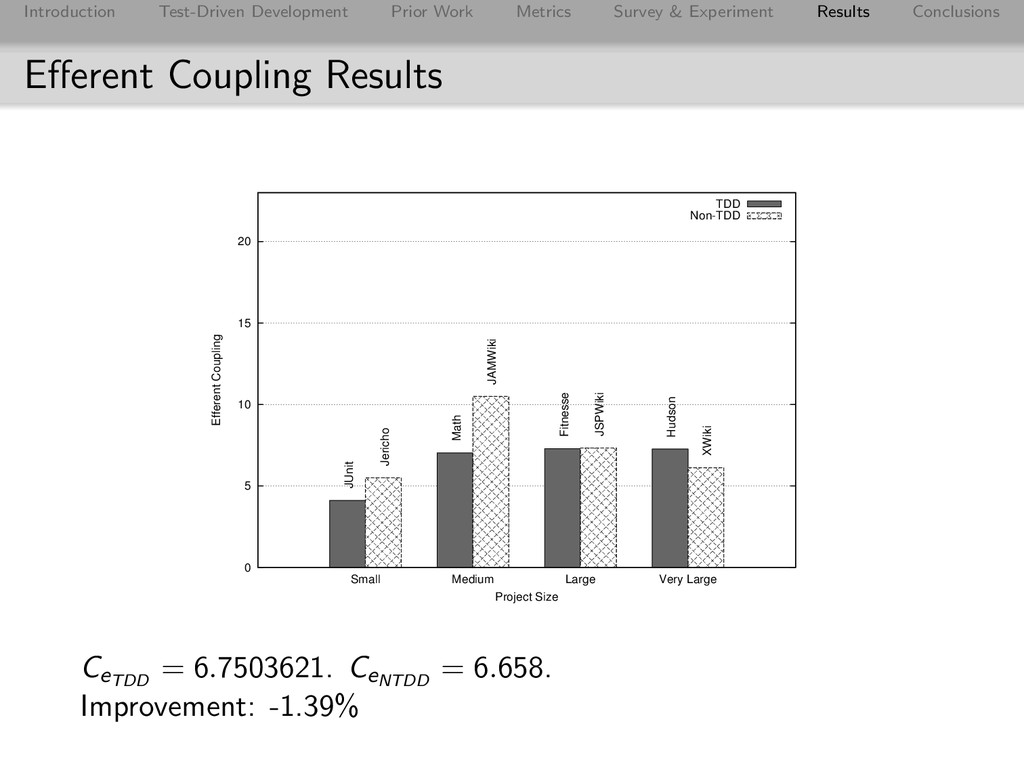
Conclusions Afferent Coupling Results 0 5 10 15 20 25 Small Medium Large Very Large Afferent Coupling Project Size TDD Non-TDD JUnit Math Fitnesse Hudson Jericho JAMWiki JSPWiki XWiki CaTDD = 12.7669483. CaNTDD = 14.982. Improvement: 14.78% Jericho’s low score: only two packages, one of which has 110/112 classes.
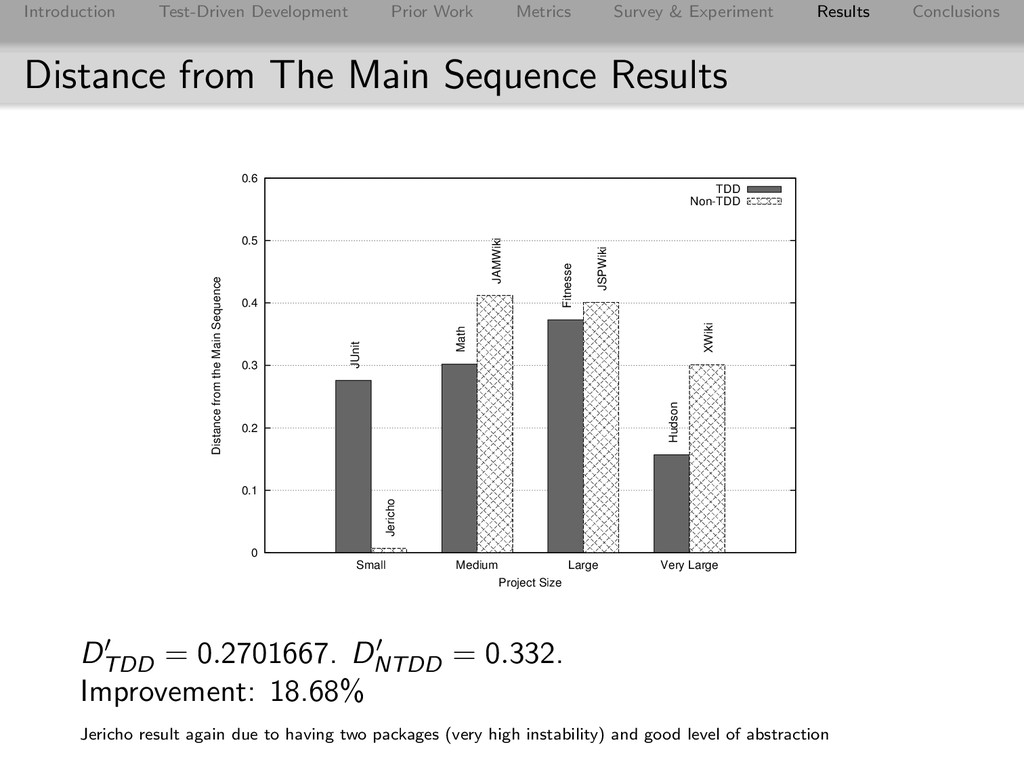
Conclusions Distance from The Main Sequence Results 0 0.1 0.2 0.3 0.4 0.5 0.6 Small Medium Large Very Large Distance from the Main Sequence Project Size TDD Non-TDD JUnit Math Fitnesse Hudson Jericho JAMWiki JSPWiki XWiki DTDD = 0.2701667. DNTDD = 0.332. Improvement: 18.68% Jericho result again due to having two packages (very high instability) and good level of abstraction
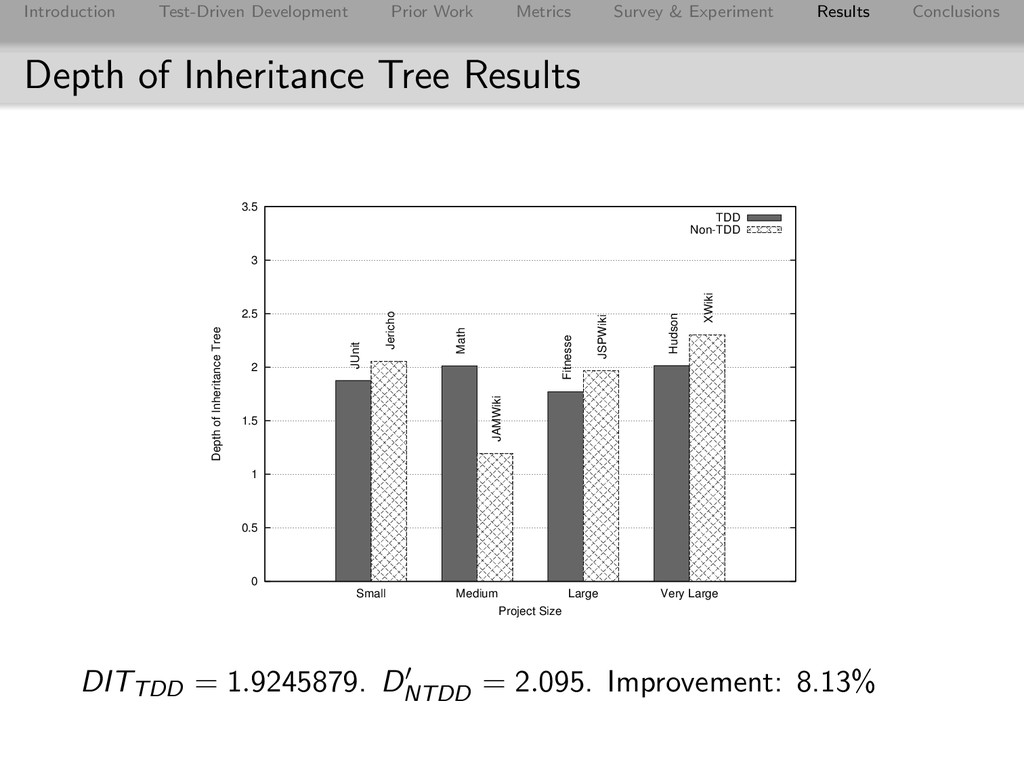
Conclusions Depth of Inheritance Tree Results 0 0.5 1 1.5 2 2.5 3 3.5 Small Medium Large Very Large Depth of Inheritance Tree Project Size TDD Non-TDD JUnit Math Fitnesse Hudson Jericho JAMWiki JSPWiki XWiki DITTDD = 1.9245879. DNTDD = 2.095. Improvement: 8.13%
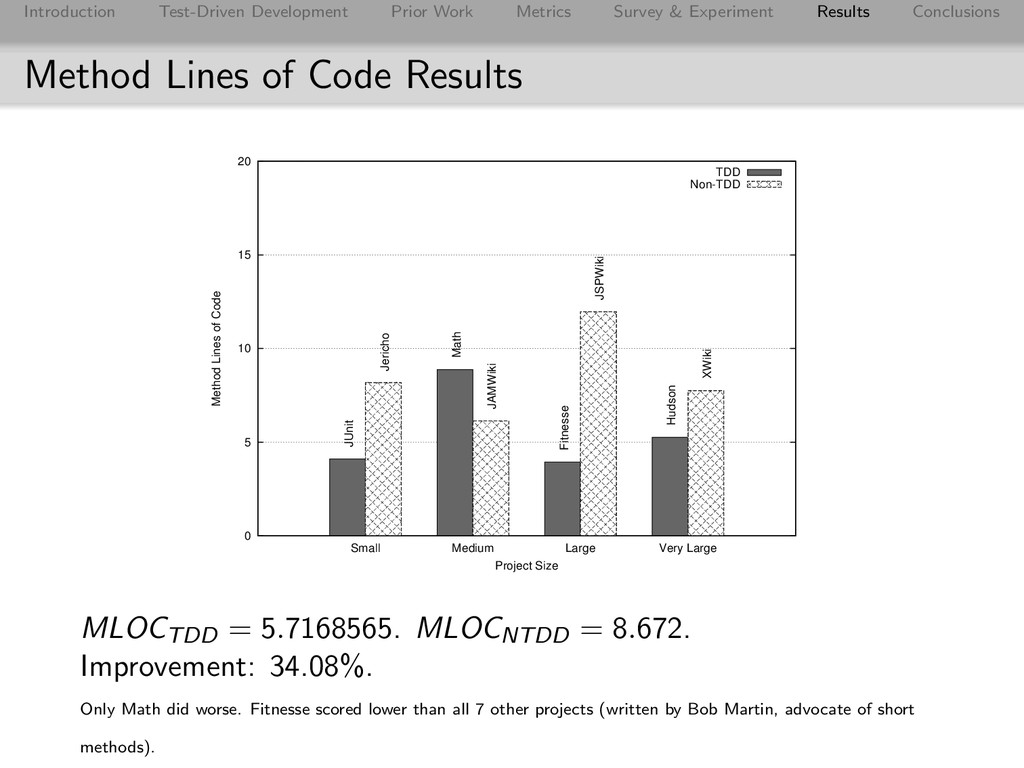
Conclusions Method Lines of Code Results 0 5 10 15 20 Small Medium Large Very Large Method Lines of Code Project Size TDD Non-TDD JUnit Math Fitnesse Hudson Jericho JAMWiki JSPWiki XWiki MLOCTDD = 5.7168565. MLOCNTDD = 8.672. Improvement: 34.08%. Only Math did worse. Fitnesse scored lower than all 7 other projects (written by Bob Martin, advocate of short methods).
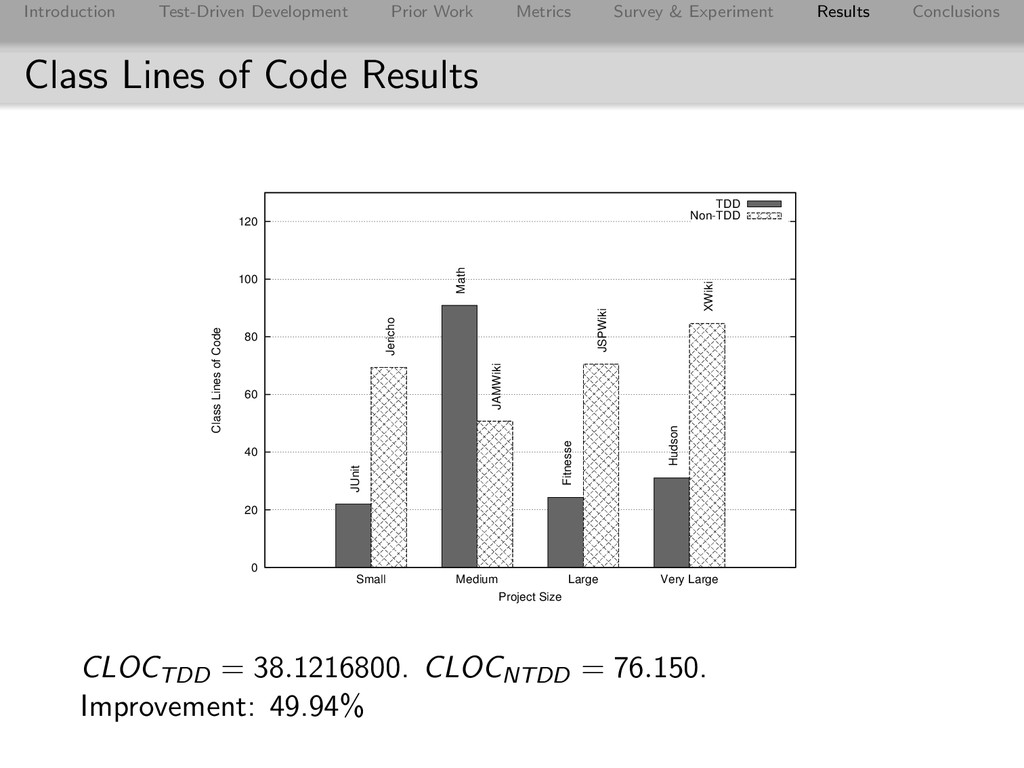
Conclusions Class Lines of Code Results 0 20 40 60 80 100 120 Small Medium Large Very Large Class Lines of Code Project Size TDD Non-TDD JUnit Math Fitnesse Hudson Jericho JAMWiki JSPWiki XWiki CLOCTDD = 38.1216800. CLOCNTDD = 76.150. Improvement: 49.94%
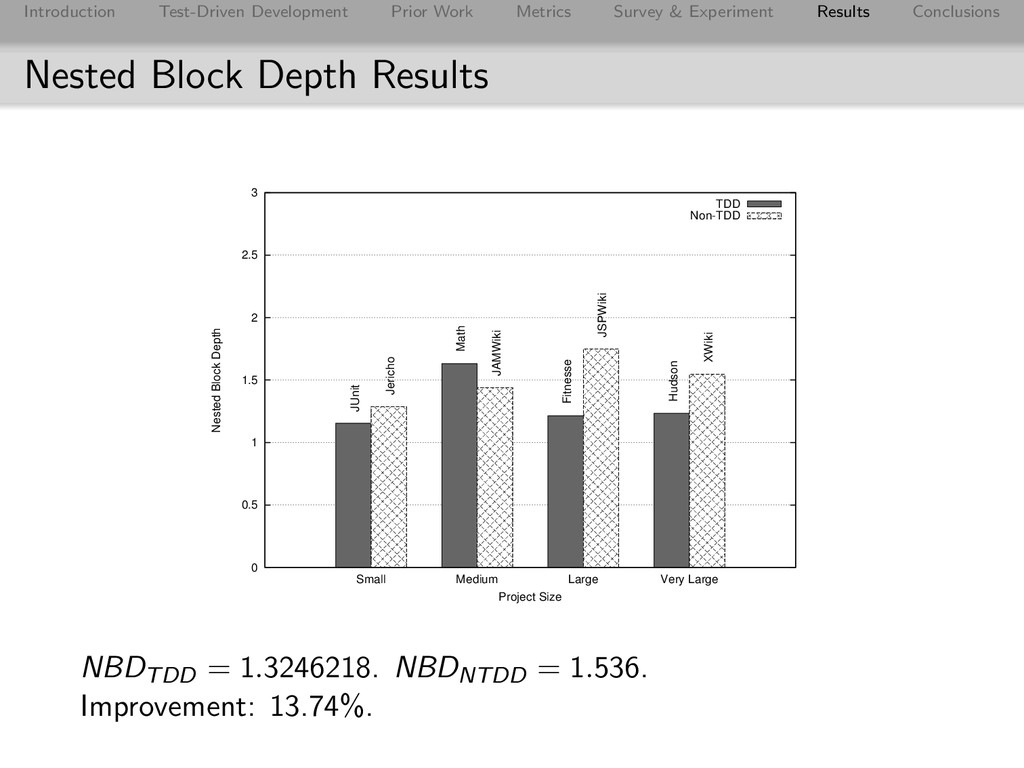
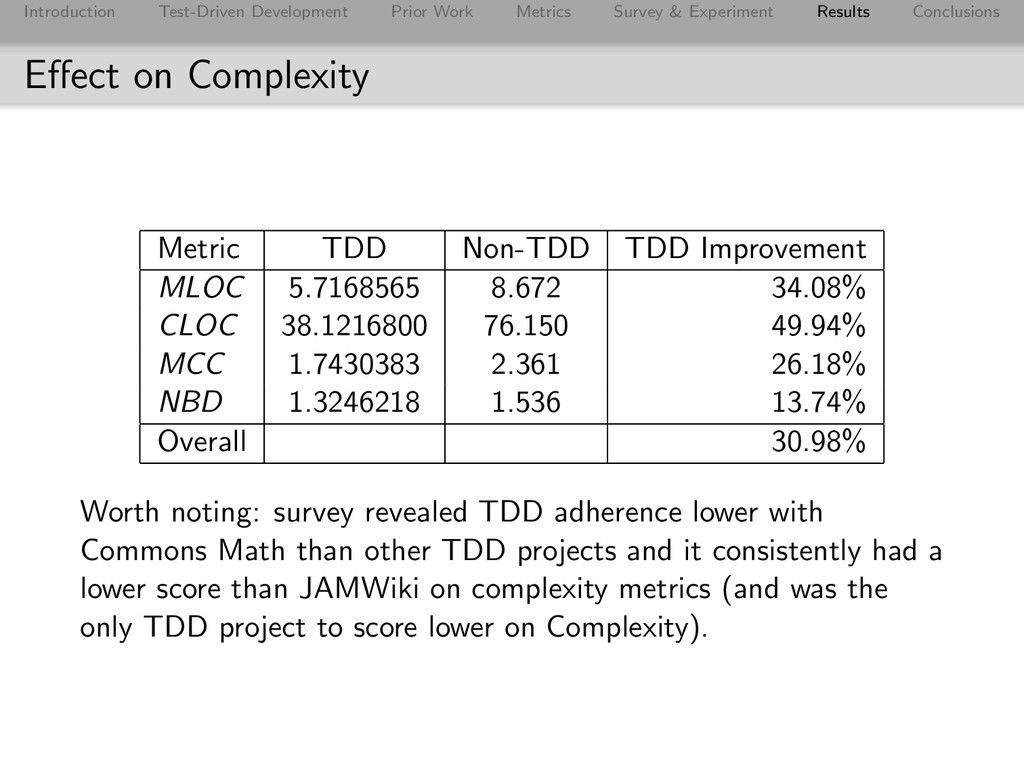
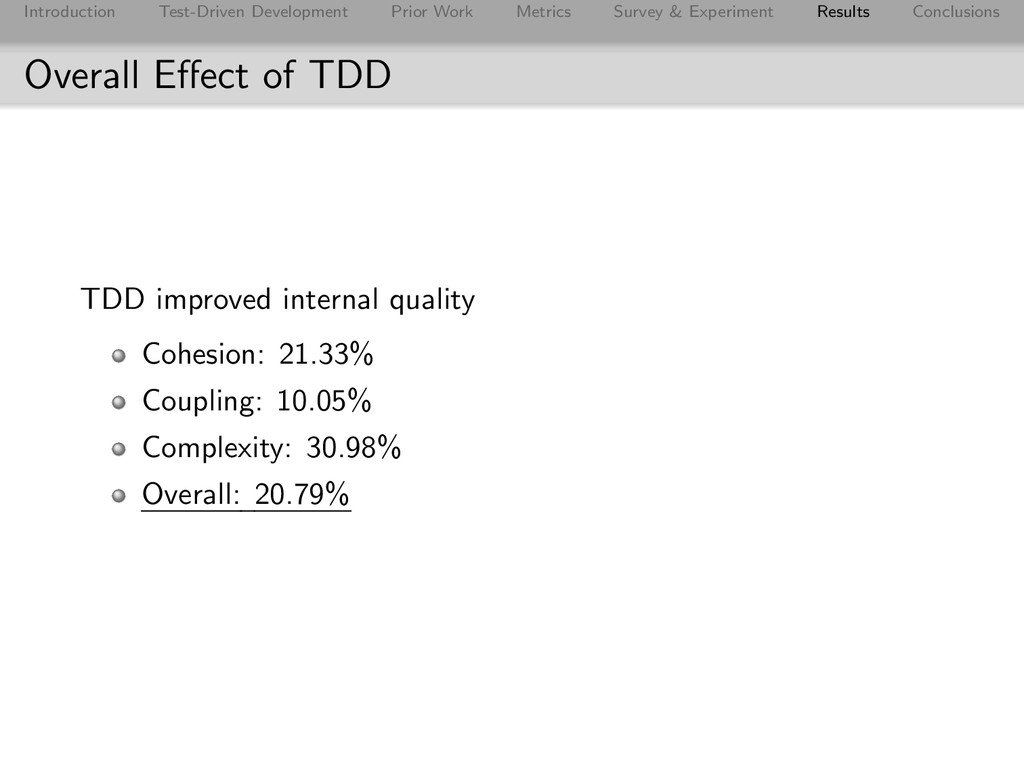
Conclusions Effect on Complexity Metric TDD Non-TDD TDD Improvement MLOC 5.7168565 8.672 34.08% CLOC 38.1216800 76.150 49.94% MCC 1.7430383 2.361 26.18% NBD 1.3246218 1.536 13.74% Overall 30.98% Worth noting: survey revealed TDD adherence lower with Commons Math than other TDD projects and it consistently had a lower score than JAMWiki on complexity metrics (and was the only TDD project to score lower on Complexity).
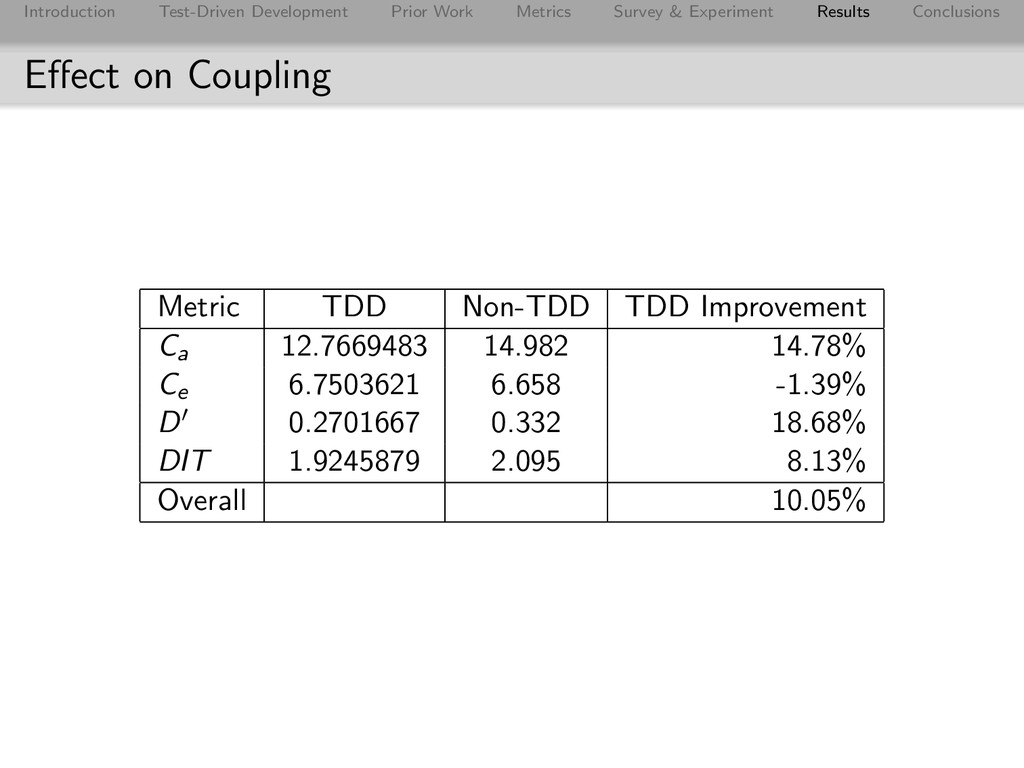
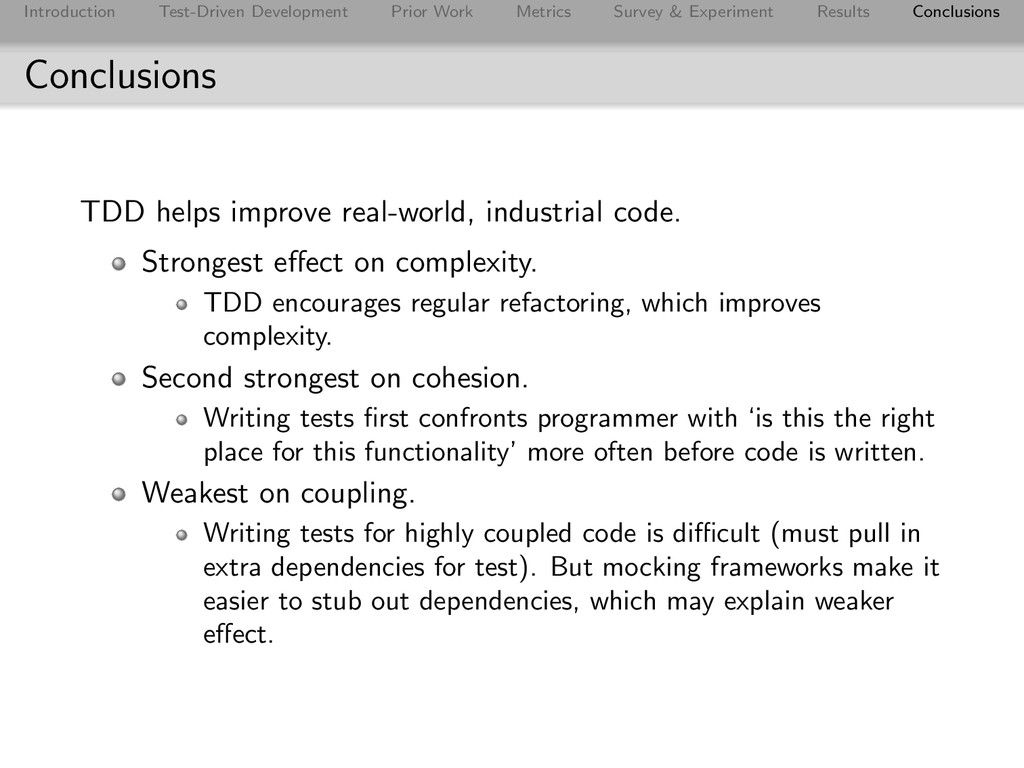
Conclusions Conclusions TDD helps improve real-world, industrial code. Strongest effect on complexity. TDD encourages regular refactoring, which improves complexity. Second strongest on cohesion. Writing tests first confronts programmer with ‘is this the right place for this functionality’ more often before code is written. Weakest on coupling. Writing tests for highly coupled code is difficult (must pull in extra dependencies for test). But mocking frameworks make it easier to stub out dependencies, which may explain weaker effect.
Conclusions Professionalism Revisited “A professional writes clean, flexible code that works [...] TDD’s disciplines are a huge help in meeting professionalism’s requirements and it would therefore be unprofessional of me not to follow them”. -Robert C. Martin, 2007
Conclusions Further Reading “Test Driven Development: By Example” by Kent Beck “Extreme Programming Explained” by Kent Beck “Working Effectively with Legacy Code” by Michael Feathers “Refactoring” by Martin Fowler “Growing Object-Oriented Software, Guided by Tests” by Steve Freeman and Nat Pryce “xUnit Test Patterns” by Gerard Meszaros “Clean Code” by Robert Martin “Agile Software Development, Principles, Patterns, and Practices” by Robert Martin