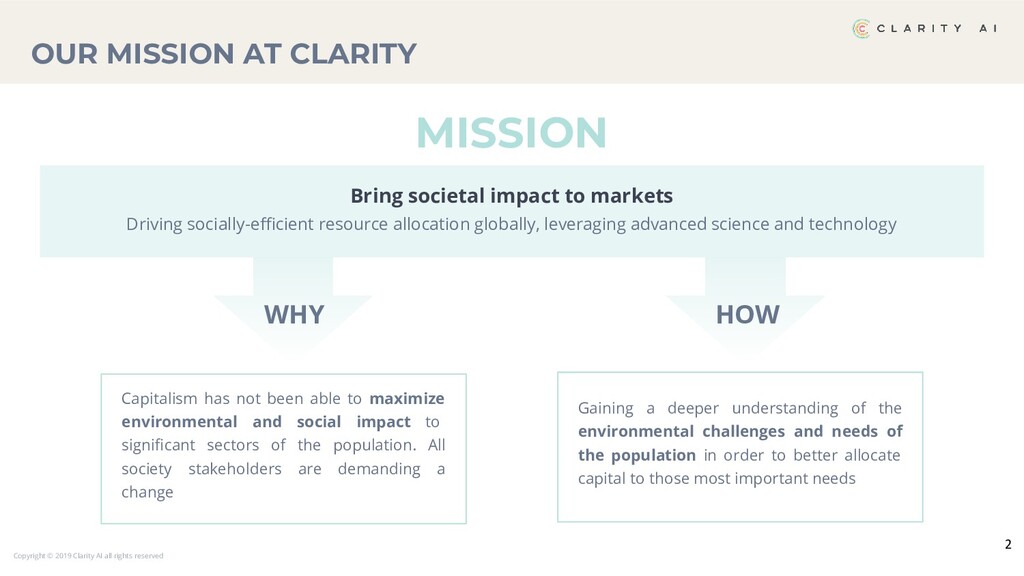
not been able to maximize environmental and social impact to significant sectors of the population. All society stakeholders are demanding a change Gaining a deeper understanding of the environmental challenges and needs of the population in order to better allocate capital to those most important needs Bring societal impact to markets Driving socially-efficient resource allocation globally, leveraging advanced science and technology OUR MISSION AT CLARITY WHY 2 MISSION HOW
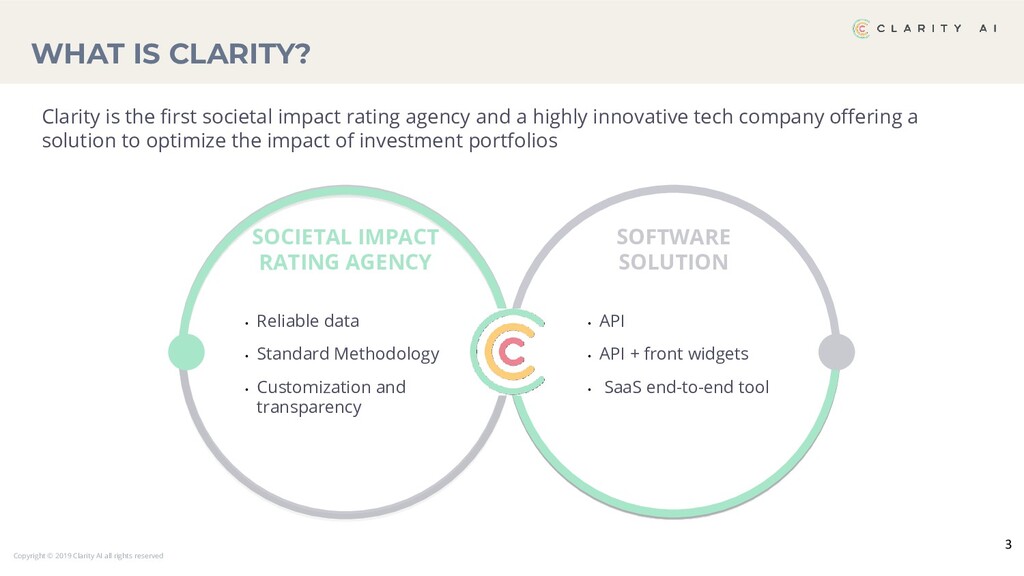
the first societal impact rating agency and a highly innovative tech company offering a solution to optimize the impact of investment portfolios S SOCIETAL IMPACT RATING AGENCY SOFTWARE SOLUTION • Reliable data • Standard Methodology • Customization and transparency • API • API + front widgets • SaaS end-to-end tool 3 WHAT IS CLARITY?
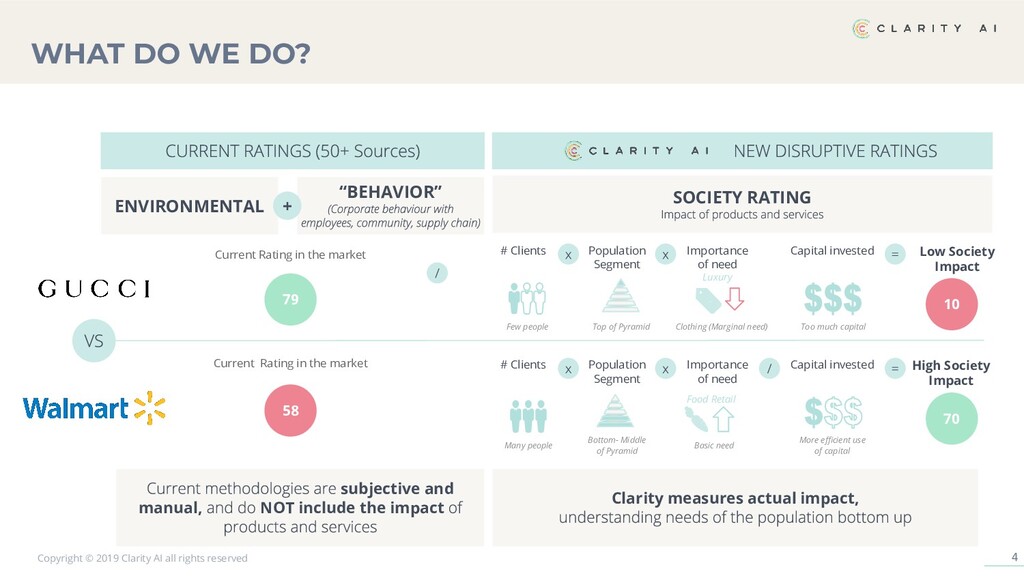
“BEHAVIOR” SOCIETY RATING + 79 58 subjective and manual, NOT include the impact Clarity measures actual impact, # Clients Population Segment Capital invested Low Society Impact Importance of need # Clients Population Segment Capital invested High Society Impact Importance of need Current Rating in the market Current Rating in the market 10 70 Few people Top of Pyramid Too much capital Luxury Clothing (Marginal need) Many people Bottom- Middle of Pyramid More efficient use of capital Food Retail Basic need WHAT DO WE DO?
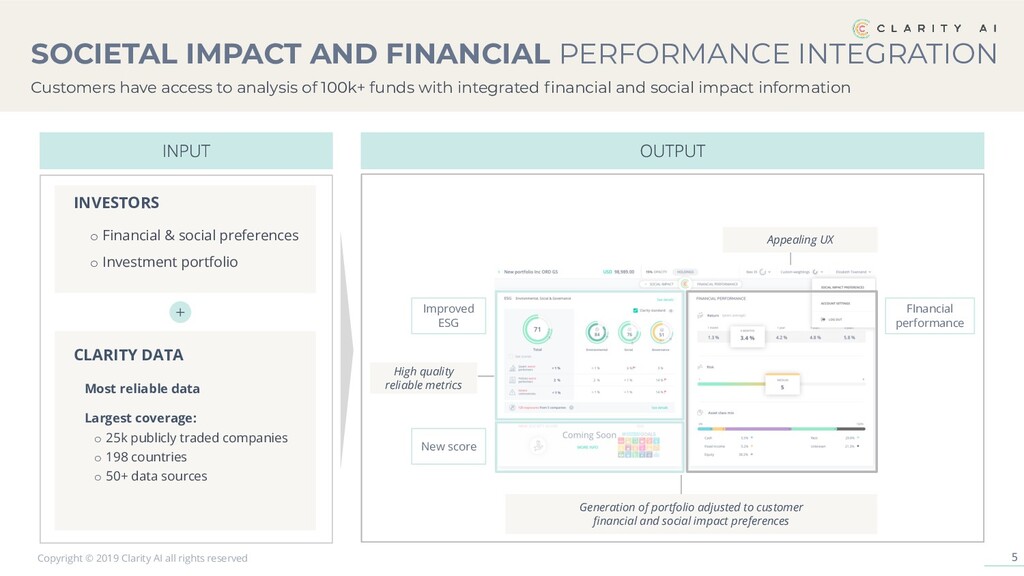
CLARITY DATA o Financial & social preferences o Investment portfolio Most reliable data Largest coverage: o 25k publicly traded companies o 198 countries o 50+ data sources Appealing UX Generation of portfolio adjusted to customer financial and social impact preferences High quality reliable metrics Improved ESG New score FInancial performance SOCIETAL IMPACT AND FINANCIAL PERFORMANCE INTEGRATION Customers have access to analysis of 100k+ funds with integrated financial and social impact information
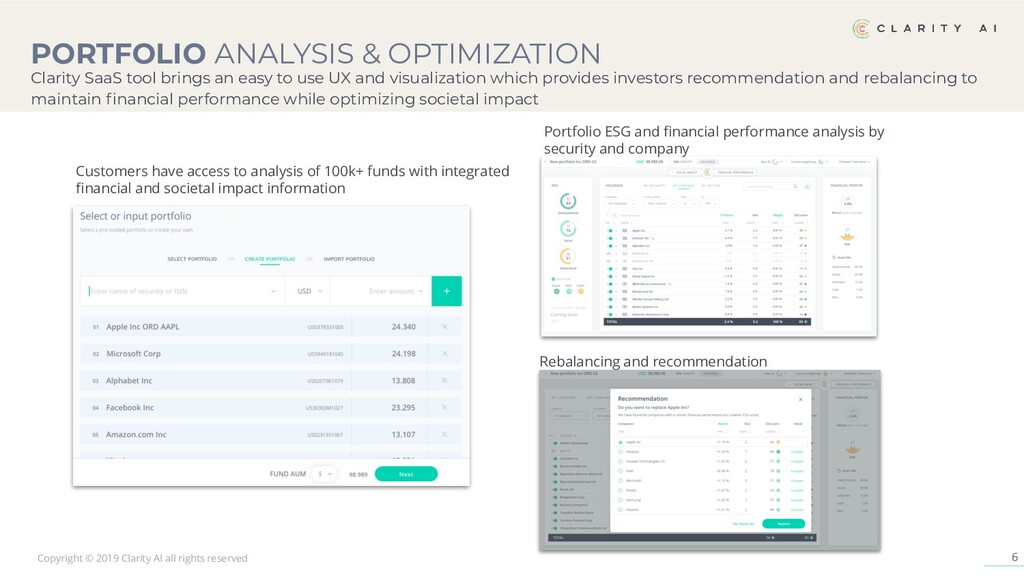
have access to analysis of 100k+ funds with integrated financial and societal impact information Portfolio ESG and financial performance analysis by security and company Rebalancing and recommendation PORTFOLIO ANALYSIS & OPTIMIZATION Clarity SaaS tool brings an easy to use UX and visualization which provides investors recommendation and rebalancing to maintain financial performance while optimizing societal impact
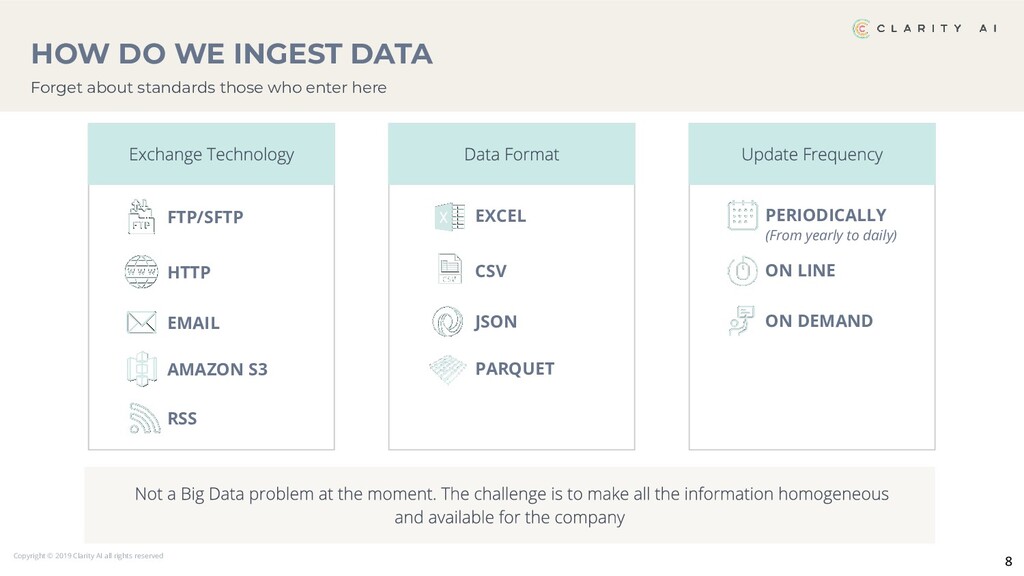
FTP/SFTP EMAIL RSS AMAZON S3 CSV JSON PARQUET EXCEL ON LINE PERIODICALLY ON DEMAND (From yearly to daily) HOW DO WE INGEST DATA Forget about standards those who enter here
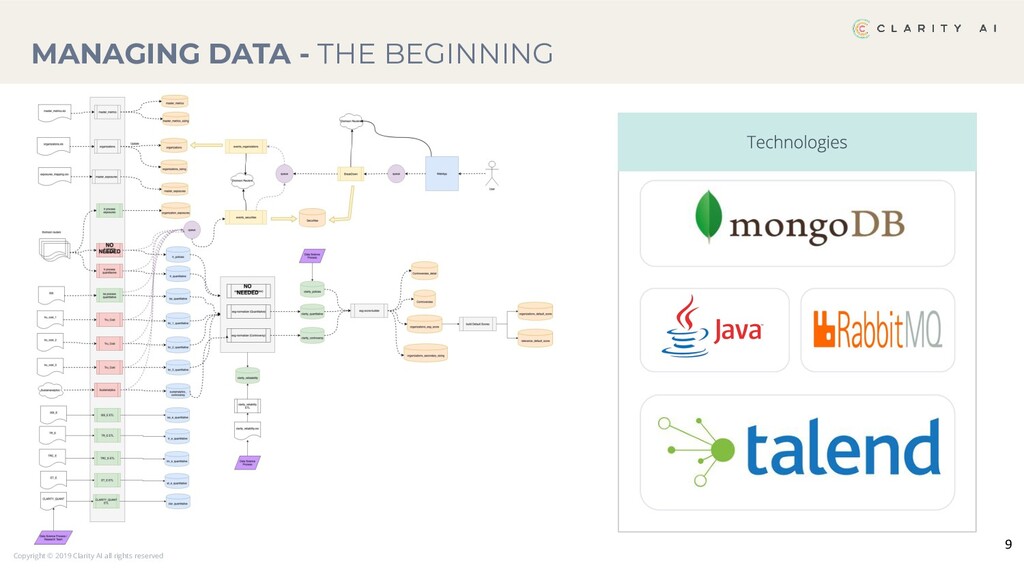
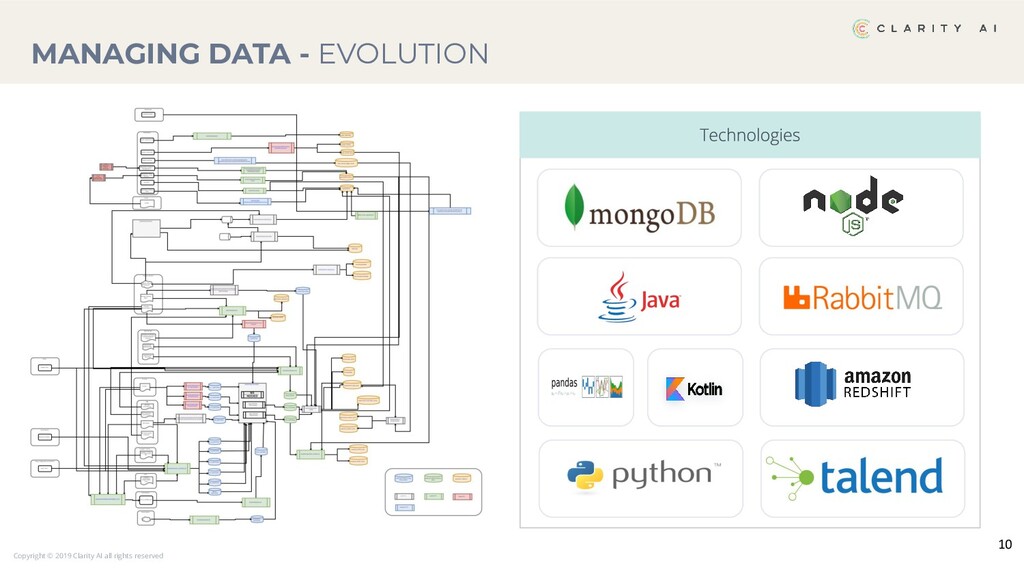
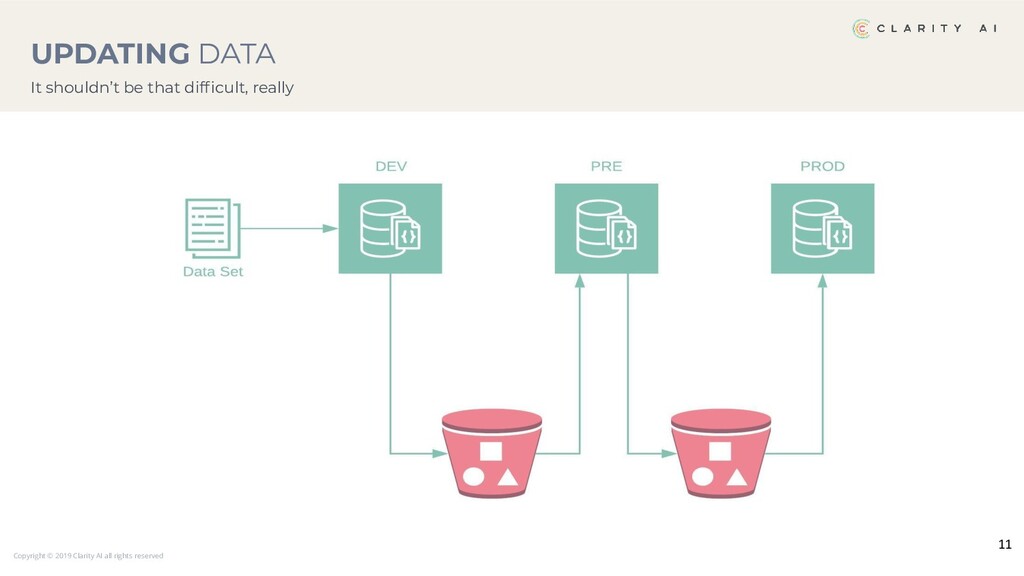
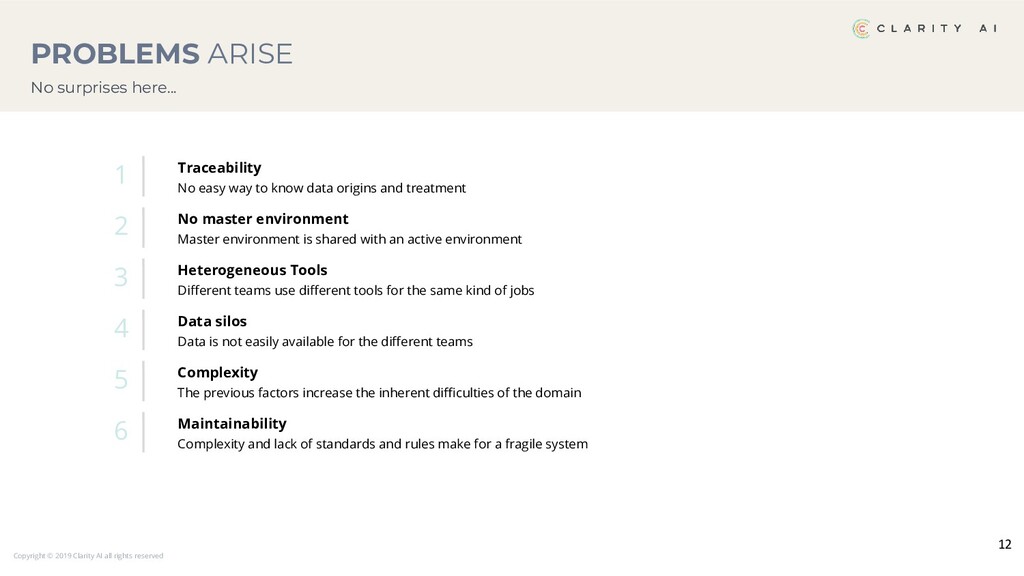
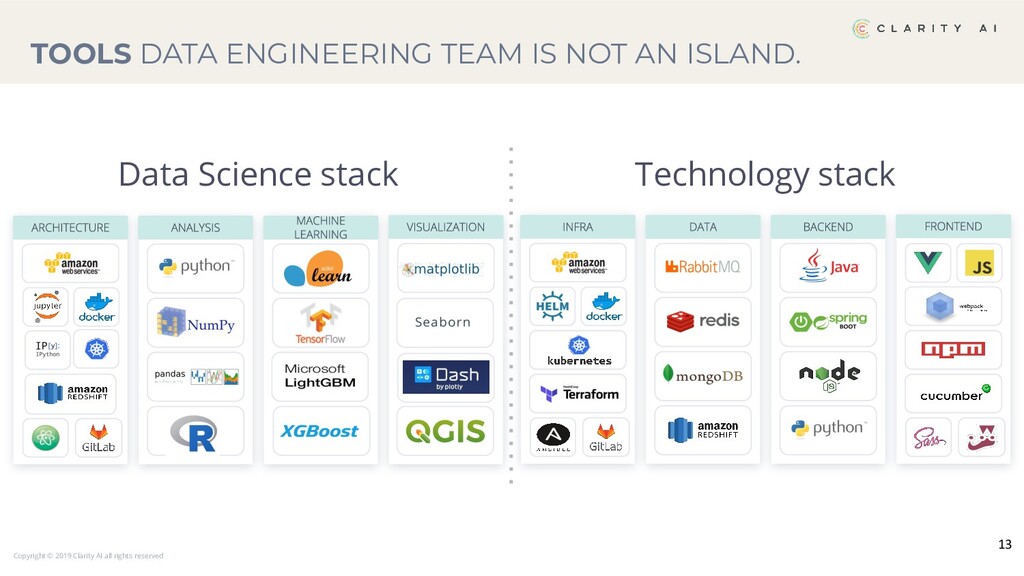
Maintainability Complexity and lack of standards and rules make for a fragile system 5 Complexity The previous factors increase the inherent difficulties of the domain 1 Traceability No easy way to know data origins and treatment 2 No master environment Master environment is shared with an active environment 3 Heterogeneous Tools Different teams use different tools for the same kind of jobs PROBLEMS ARISE No surprises here... 4 Data silos Data is not easily available for the different teams
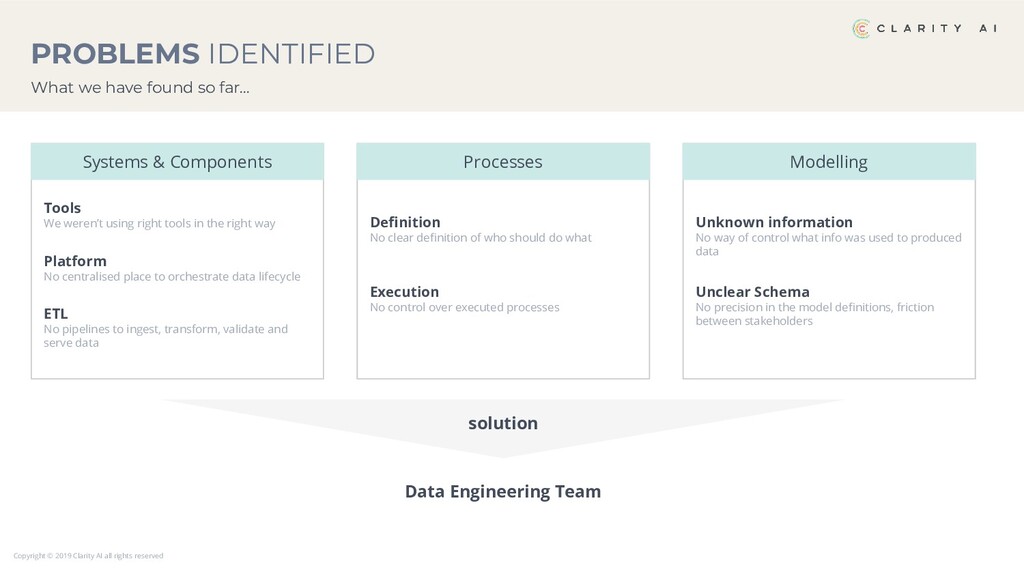
have found so far... Systems & Components Processes Modelling Tools We weren’t using right tools in the right way Definition No clear definition of who should do what Unknown information No way of control what info was used to produced data Platform No centralised place to orchestrate data lifecycle ETL No pipelines to ingest, transform, validate and serve data Execution No control over executed processes Unclear Schema No precision in the model definitions, friction between stakeholders Data Engineering Team solution PROBLEMS IDENTIFIED
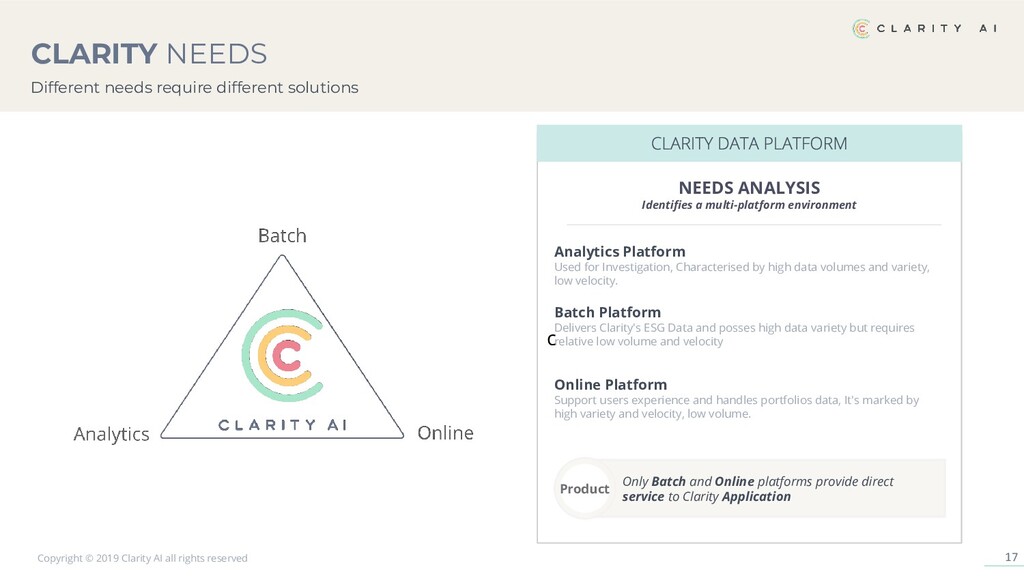
NEEDS ANALYSIS Identifies a multi-platform environment Analytics Platform Used for Investigation, Characterised by high data volumes and variety, low velocity. Batch Platform Delivers Clarity's ESG Data and posses high data variety but requires relative low volume and velocity Online Platform Support users experience and handles portfolios data, It's marked by high variety and velocity, low volume. Only Batch and Online platforms provide direct service to Clarity Application Product Different needs require different solutions CLARITY NEEDS
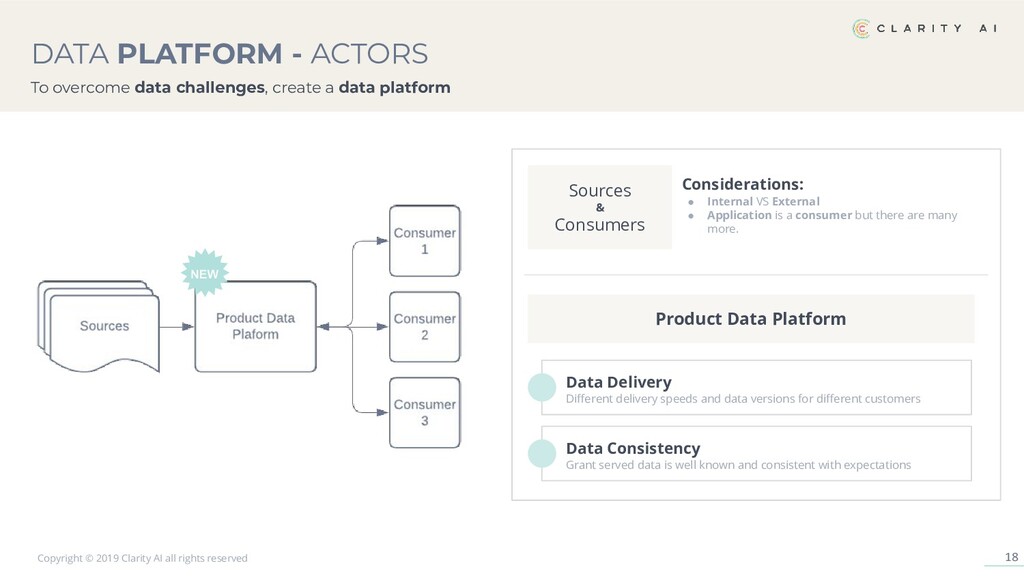
• Internal VS External • Application is a consumer but there are many more. Sources & Consumers Product Data Platform Data Delivery Different delivery speeds and data versions for different customers Data Consistency Grant served data is well known and consistent with expectations To overcome data challenges, create a data platform DATA PLATFORM - ACTORS
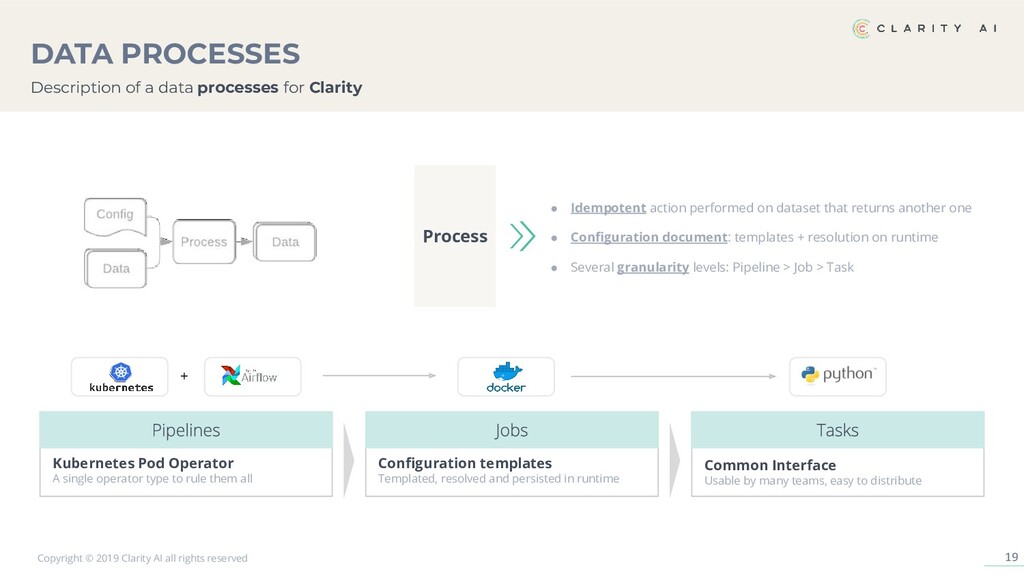
• Idempotent action performed on dataset that returns another one • Configuration document: templates + resolution on runtime • Several granularity levels: Pipeline > Job > Task Kubernetes Pod Operator A single operator type to rule them all Configuration templates Templated, resolved and persisted in runtime Common Interface Usable by many teams, easy to distribute + Description of a data processes for Clarity DATA PROCESSES
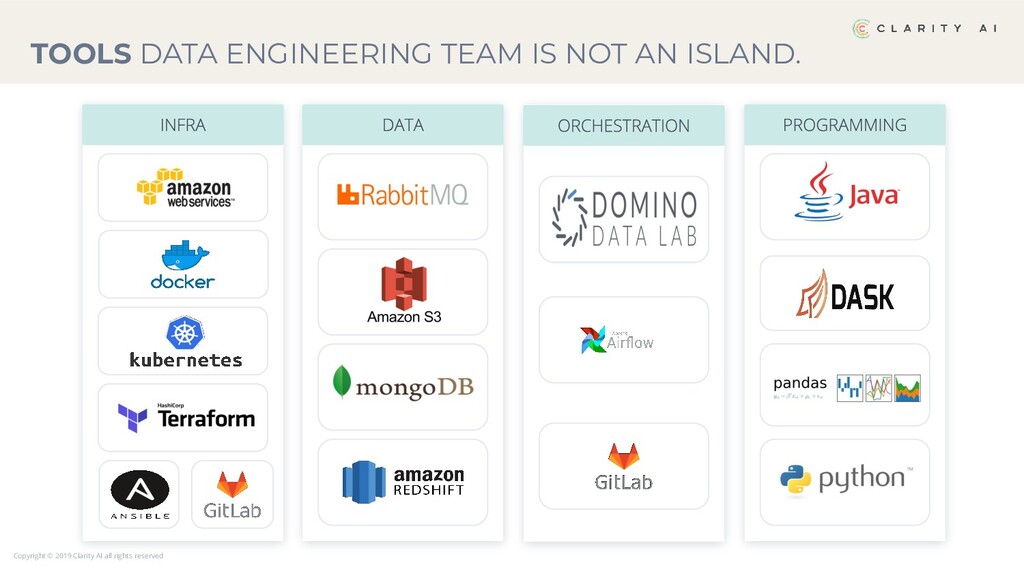
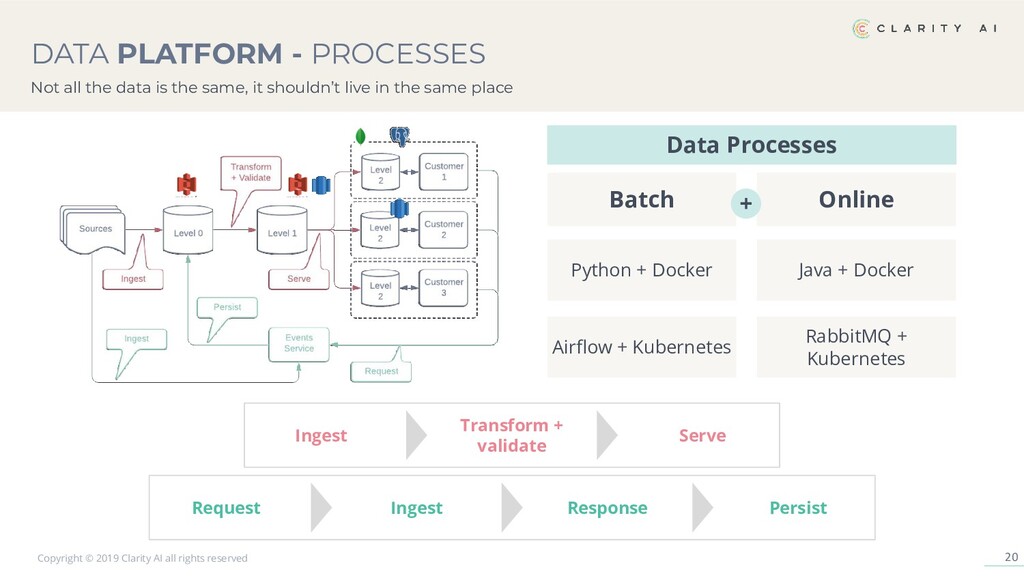
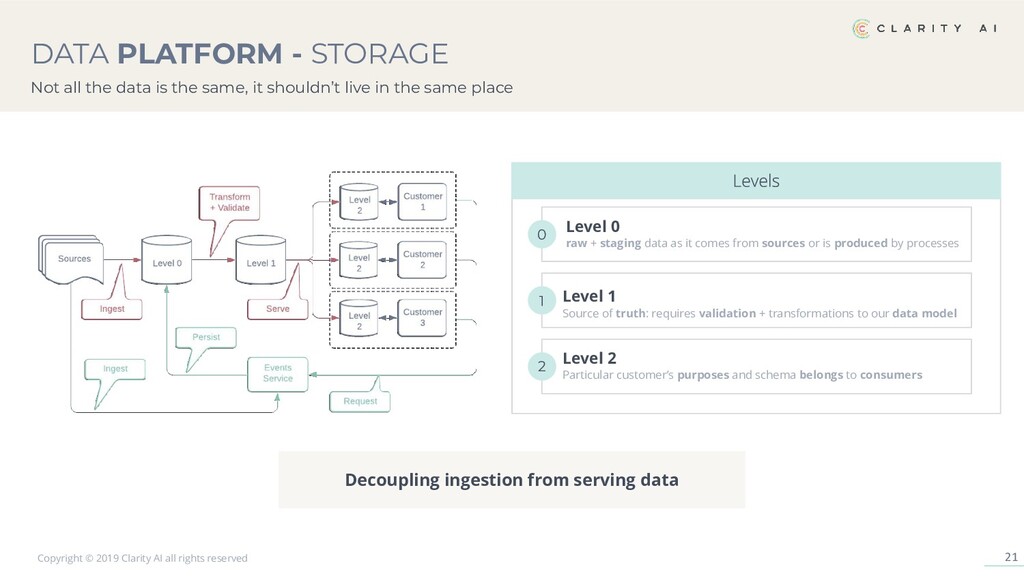
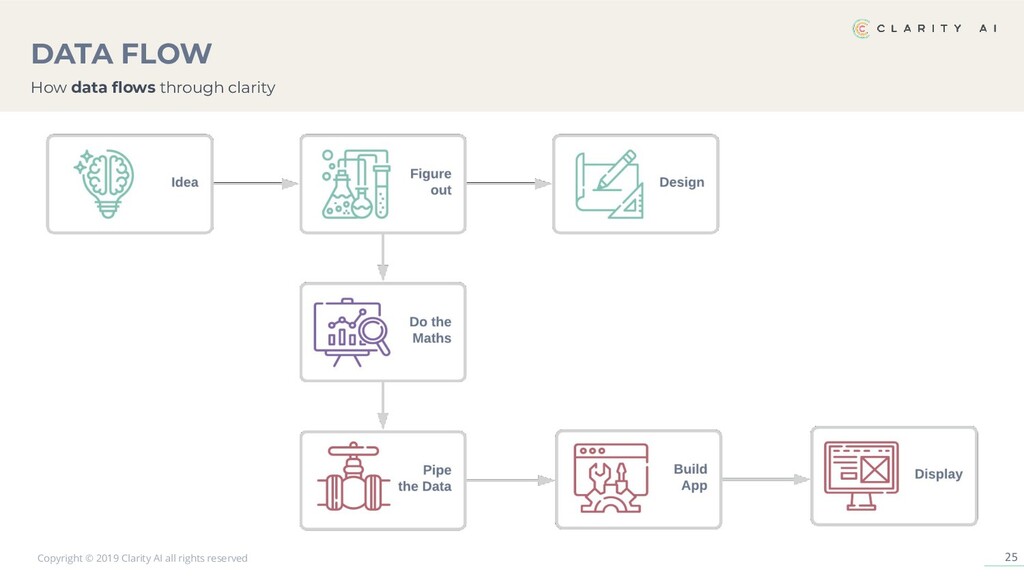
Online + Data Processes Python + Docker Java + Docker Ingest Transform + validate Serve Request Persist Ingest Response Airflow + Kubernetes RabbitMQ + Kubernetes Not all the data is the same, it shouldn’t live in the same place DATA PLATFORM - PROCESSES
Level 0 raw + staging data as it comes from sources or is produced by processes Level 1 Source of truth: requires validation + transformations to our data model 1 Level 2 Particular customer’s purposes and schema belongs to consumers 2 Decoupling ingestion from serving data Not all the data is the same, it shouldn’t live in the same place DATA PLATFORM - STORAGE
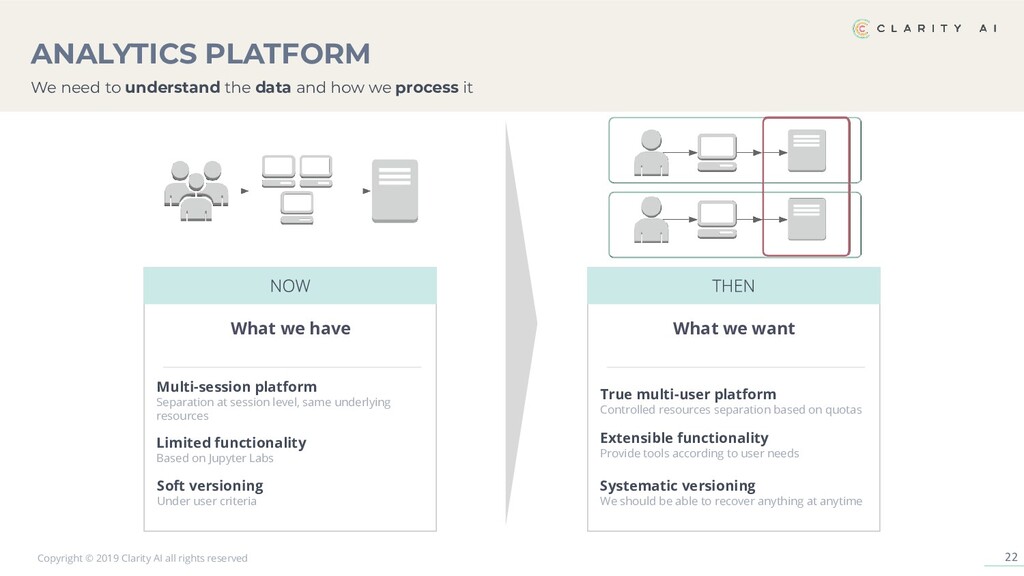
functionality Based on Jupyter Labs Multi-session platform Separation at session level, same underlying resources What we have True multi-user platform Controlled resources separation based on quotas What we want Soft versioning Under user criteria Extensible functionality Provide tools according to user needs Systematic versioning We should be able to recover anything at anytime We need to understand the data and how we process it ANALYTICS PLATFORM
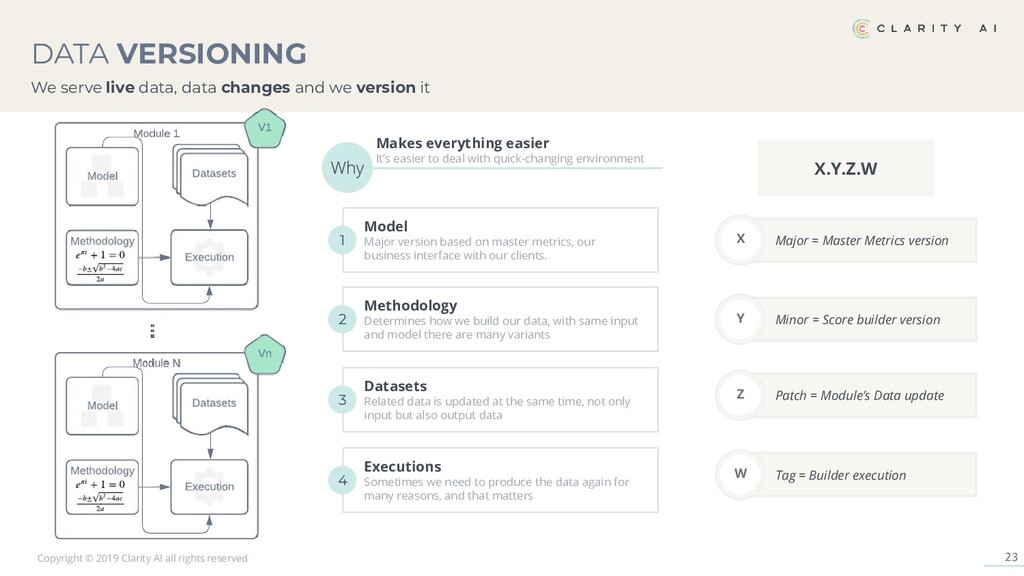
everything easier It’s easier to deal with quick-changing environment 1 Model Major version based on master metrics, our business interface with our clients. 2 Methodology Determines how we build our data, with same input and model there are many variants 3 Datasets Related data is updated at the same time, not only input but also output data 4 Executions Sometimes we need to produce the data again for many reasons, and that matters X.Y.Z.W • Major = Master Metrics version X • Minor = Score builder version Y • Patch = Module’s Data update Z • Tag = Builder execution W We serve live data, data changes and we version it DATA VERSIONING
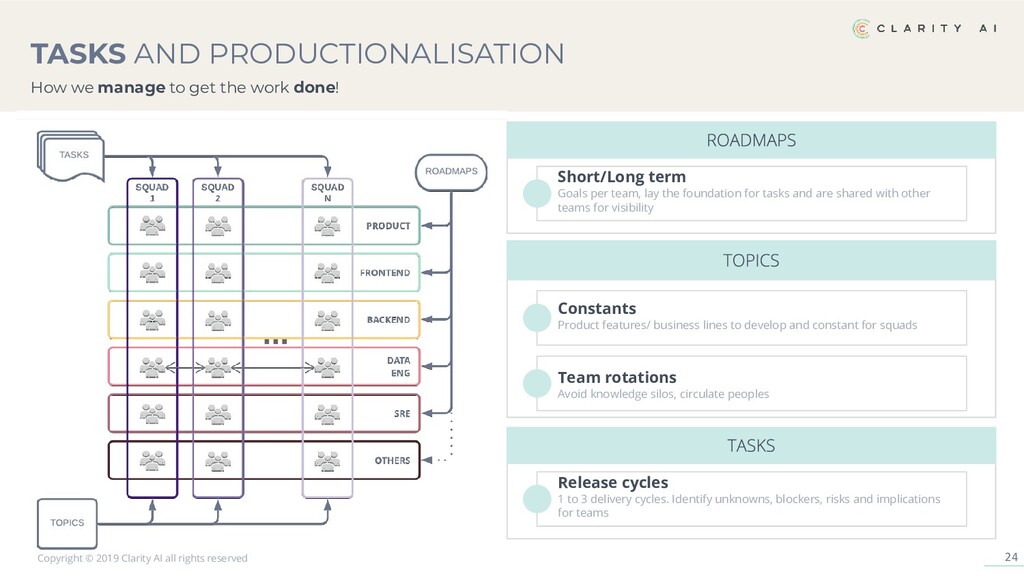
cycles 1 to 3 delivery cycles. Identify unknowns, blockers, risks and implications for teams Short/Long term Goals per team, lay the foundation for tasks and are shared with other teams for visibility Constants Product features/ business lines to develop and constant for squads Team rotations Avoid knowledge silos, circulate peoples How we manage to get the work done! TASKS AND PRODUCTIONALISATION
AI WE ARE HIRING! • Product Managers • Back end Engineers • Front end Engineers • Data Engineers • Data Scientists • Social impact researchers • ... Apply at talent.clarity.ai


 hiracky16
 makocchi
 kizawa2020
 ykanoh
 willnet
 gree_tech
 gogutan
 jtakeda
 yazm
 prog893
 yahonda
 sh_fk2
 gurzu
 aemeredith
 mojombo
 eitanlees
 twada
 lara
 nwiizo
 tammyeverts
 jonoalderson
 addyosmani
 inesmontani