Upgrade to Pro — share decks privately, control downloads, hide ads and more …

Observational signatures of black hole accretion and outflows

Observational signatures of black hole accretion and outflows

This lecture is part of the course "physics of active galactic nuclei" offered to graduate students in astrophysics by Rodrigo Nemmen and Joao Steiner at IAG USP.

https://rodrigonemmen.com/teaching/active-galactic-nuclei/

Rodrigo Nemmen

May 20, 2016
Tweet

More Decks by Rodrigo Nemmen

Other Decks in Science

Transcript

  1. Rodrigo Nemmen Observational Signatures of Accretion and Outflows AGA5727 -

    Active Galactic Nuclei Credit: NASA/JPL-Caltech
  2. Thermal state (NLS1s?) Intermediate state? (Quasars, Seyferts?) Hard state (LLAGNs,

    Seyferts) Quiescent state (LLAGNs, Sgr A*) M · a Quiescent state (Sgr A*) h/r ⇠ 1 ⌧ ⌧ 1 h/r ⌧ 1 ⌧ 1 ˙ M & 0.01 ˙ MEdd Adapted from Yuan & Narayan 2014, ARA&A Thermal state (NLS1s? Quasars) ? ? A Unified View of Accretion Flows
  3. Shang, …, Nemmen et al. (2011) Thin disk model Nemmen

    & Brotherton (2010) Radio-loud Radio-quiet Quasar SEDs: Jets, dust, accretion disk and corona jet dust (torus) accretion disk corona
  4. d M. Eracleous Downloaded fr Nemmen et al. 2014, MNRAS

    (in a few cases) Low-luminosity AGN SEDs: Jets, dust, ADAF and thin disk
  5. 56 Accretion disks .1 1 10 100 1000 10000 105

    .01 .1 1 10 100 1000 Energy (eV) F ν ν1/3 ν2 hot corona thin disk Figure 4.3. A schematic of a combined disk–corona spectrum. The maximum Schematic spectrum of thin disk (T < 105 K) + hot corona (T = 108 K) Netzer the self-gravity radius. The disk is surrounded by an optically Tcor = 108 K. noting that T ∝ ν/x ∝ r−3/4. Thus rdr ∝ ν−8/3x5/3dx, which tion between rin and rout . If rout ≫ rin , the spectral shape over range is given by L ν ∝ ˙ M2/3 M2/3 ν1/3 , where we made use of the temperature dependence on the ma (Equation 4.22). This expression is occasionally referred to a spectrum. The simple schematic ν1/3 dependence of L ν holds only o band because of the physical boundaries of the disk. The outer minimal disk temperature and a typical frequency associated w νout . Below this frequency, the spectrum resembles a blackbo dependence of L ν ∝ ν2. At the inner boundary, there is an and a typical associated inner frequency, νin . Beyond this f exponentially with a functional dependence corresponding to
  6. Schematic spectrum of thin disk (T < 105 K) +

    hot corona (T = 108 K) Netzer 7.8. The central accretion disk 221 1 10 100 1000 10000 1000 10000 105 106 107 Energy (eV) F ν EUV X−ray 13.6 eV Figure 7.40. Observed SED (thick solid lines connected with a thin dotted line) compared with a theoretical model made of the spectrum of a thin accretion disk around a 3 × 10⁹ M⊙ BH with L/LEdd = 0.1 and an additional X-ray power-law component. Note the strong blue bump (energy excess just beyond the Lyman limit at 13.6 eV) predicted by this model compared with the sharp drop in the
  7. Polarized spectra of quasars reveal disk emission in the near

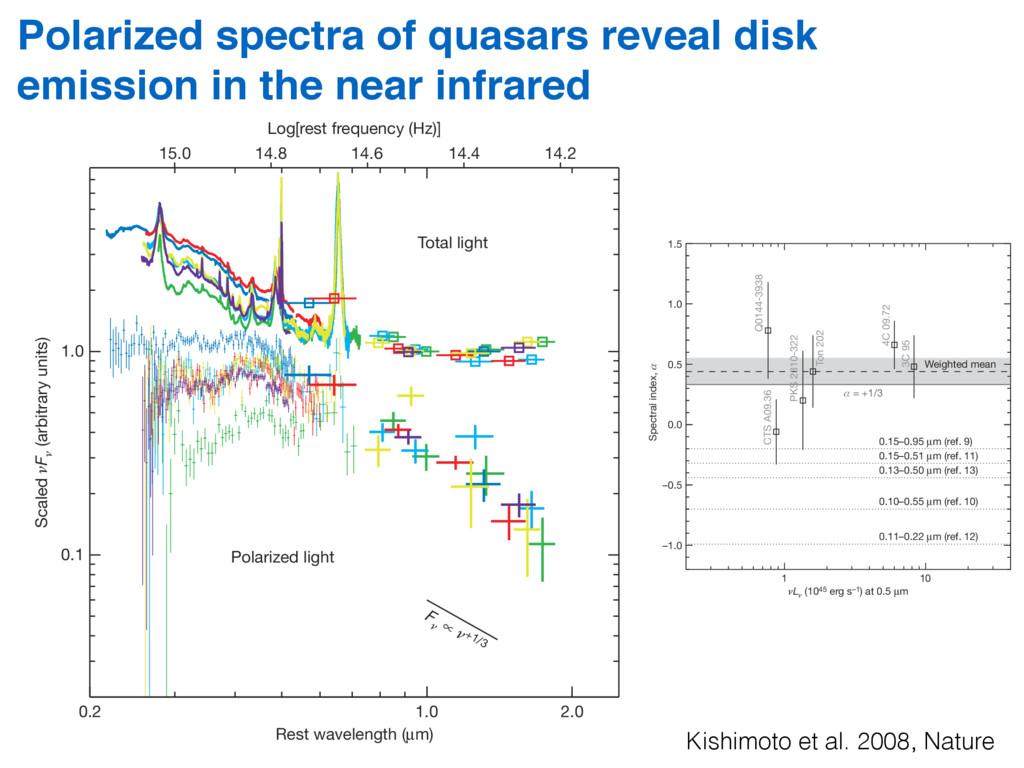
    infrared Kishimoto et al. 2008, Nature spectropolarimetry. In Fig. 1 we show the spectra of linearly polarized light measured in the near-infrared broad-band imaging polarimetry, and optical spec- tropolarimetry, of the six quasars (including the one studied in the seen in Fig. 2, and we did not find dependen MBH or Eddington ratios L/LEdd derived fr Balmer line. This is expected if the near-in long-wavelength limit of the disk model, parameters such as black-hole mass and Edd by regarding each measurement as a measur ity, the weighted mean over the measurem meaningful. We note that if we formally c the radial temperature distribution for the disk, we obtain T / r20.78 6 0.03, consis dependence T / r23/4. The systematicbehaviourof thenear-infra as the constancy of the position angles over argues against there being any secondary po 1.0 0.1 0.2 1.0 14.4 14.2 14.6 14.8 15.0 2.0 Rest wavelength (µm) Log[rest frequency (Hz)] Total light Polarized light Scaled nF n (arbitrary units) F n ∝ n+1/3 1.5 1.0 0.5 0.0 a = +1/ Q0144-3938 CTS A09.36 Ton 202 PKS 2310-322 Spectral index, a In Fig. 1 we show the spectra of linearly polarized light measured in the near-infrared broad-band imaging polarimetry, and optical spec- tropolarimetry, of the six quasars (including the one studied in the seen in Fig. 2, and we did not find dependencies on black-hole masses MBH or Eddington ratios L/LEdd derived from the width of the Hb Balmer line. This is expected if the near-infrared spectrum is in the long-wavelength limit of the disk model, which is independent of parameters such as black-hole mass and Eddington ratio. In this case, by regarding each measurement as a measurement of the same quant- ity, the weighted mean over the measurements becomes physically meaningful. We note that if we formally convert the mean slope to the radial temperature distribution for the case of an optically thick disk, we obtain T / r20.78 6 0.03, consistent with the predicted dependence T / r23/4. The systematicbehaviourof thenear-infrared polarized light,aswell as the constancy of the position angles over all wavelengths, strongly argues against there being any secondary polarization contamination. 1.0 0.1 0.2 1.0 14.4 14.2 14.6 14.8 15.0 2.0 Rest wavelength (µm) Log[rest frequency (Hz)] Total light Polarized light Scaled nF n (arbitrary units) F n ∝ n+1/3 Figure 1 | Overlay of the polarized- and total-light spectra observed in six different quasars. We plot scaled nFn data: Q0144-3938 (redshift z 5 0.244), green; 3C 95 (z 5 0.616), blue; CTS A09.36 (z 5 0.310), light blue; 4C 09.72 (z 5 0.433), red; PKS 2310-322 (z 5 0.337), yellow. Plotted in purple are the data for Ton 202 (z 5 0.366) from a previous paper25. Total-light spectra, shown as bold traces in the optical and as squares in the near-infrared, are normalized at 1 mm in the rest frame, by interpolation (except that of 3C 95, which we normalized by nFn observed at 1.3 mm in the rest frame). Polarized- light spectra, shown as light points in the optical and as bold points in the near-infrared (vertical error bars, 1s), are separately normalized, also at 1 mm, by fitting a power law to the near-infrared polarized-light spectra. For both total-light and polarized-light data, horizontal bar lengths indicate bandwidth. The normalized polarized-light spectra are arbitrarily shifted downwards by a factor of three relative to the normalized total-light spectra, for clarity. The total-light spectra begin to increase in nFn at wavelengths around, or slightly greater than, 1 mm. In contrast, the polarized-light spectra all consistently and systematically decrease in nFn towards long wavelengths, showing a blue shape of approximately power-law form. 1.5 1.0 0.5 0.0 Weighted mean a = +1/3 0.15–0.95 µm (ref. 9) Q0144-3938 4C 09.72 3C 95 CTS A09.36 Ton 202 PKS 2310-322 0.15–0.51 µm (ref. 11) 0.13–0.50 µm (ref. 13) 0.10–0.55 µm (ref. 10) 0.11–0.22 µm (ref. 12) 1 10 nL n (1045 erg s–1) at 0.5 µm Spectral index, a –0.5 –1.0 Figure 2 | Spectral index of polarized light spectra. We plot a (in Fn / na) against nLn for total light at 0.51 mm. The index was measured using a power- law fit for each near-infrared polarized-light spectrum (note the different wavelength ranges covered depending on the redshift) and is shown with 1s error bars. A weighted mean of the spectral index measurements is shown dashed; the shaded area represents its deduced 1s uncertainty. The mean or median slopes of the ultraviolet–optical total-light spectra derived in various other studies9–13 are also shown. 493 ©2008 Macmillan Publishers Limited. All rights reserved
  8. Double-Peaked Balmer Lines 23 Observed Wavelength (Å) Flux Density (mJy)

    Slide: M. Eracleous in radio galaxies and LINERs
  9. Observed Wavelength (Å) Flux Density (mJy) ✦ FWHM ~ 15,000

    km/s (up to 40,000 km/s!) ✦ Corresponds to ξ ~ 500 (in an edge-on accretion disk) ✦ Relativistic effects (special+general) are important but can be treated approximately 16,000 km/s 12,000 km/s 4 Slide: M. Eracleous
  10. 25 Fits to the line profiles from Eracleous & Halpern

    1994, ApJS, 90, 1 Slide: M. Eracleous
  11. Chen & Halpern 1989, ApJ Physical scenario for origin of

    broad emission lines in LINERs and radio galaxies ADAF thin disk
  12. The Astrophysical Journal, 748:145 (12pp), 2012 April 1 Schimoia et

    al. Schimoia et al. Large variation in line profile over time: Physical changes in the accretion disk Schimoia, …, Nemmen et al. 2012, ApJ
  13. Models for the variations 30 From Lewis et al 2008,

    in preparation Lewis et al. 2010, ApJ
  14. The basic picture 34 • The accretion disks of AGNs

    are not hot enough to emit thermal X-rays. Recall Lecture 1: T ~ 105 K • But AGNs emit hard X-rays, up to ~100 keV ✦ Observed X-ray spectrum is roughly a power law ✦ F(E) 㲍 E– α with α ≈0.8–1.0 • In a small fraction of objects, the X-rays are produced in a jet pointed at us. Slide: M. Eracleous
  15. X-Ray Emission Flowchart 36 Hot corona ✦ May resemble coronal

    loops of stars. ✦ Powered by magic. ✦ Electrons may have power-law (or thermal?) energy distribution. Slide: M. Eracleous
  16. X-Ray Emission Flowchart 37 Soft photons from the disk (kT~20

    eV) illuminate the coronal plasma. ✦ Compton up-scattering 20 eV → 1–100 keV ✦ Some up-scattered photons go to the observer and some go back to the disk Slide: M. Eracleous
  17. X-Ray Emission Flowchart 38 Photons returning to the “cool” disk...

    ✦ ionize it and heat it up, ✦ some are scattered back out by bound atomic electrons, suffering photoelectric absorption along the way Slide: M. Eracleous
  18. Observer sees sum of all spectra 39 from Minuitti et

    al. 2007, PASJ, 59S, 315 㲍 νƒν “primary” continuum reprocessed continuum Fe K line total spectrum Slide: M. Eracleous
  19. Comparison of Model to Data 41 from Minuitti et al.

    2007, PASJ, 59S, 315 MCG–6-30-15 observed with Suzaku Slide: M. Eracleous
  20. Zooming in on the Fe Kα Line 42 from Minuitti

    et al. 2007, PASJ, 59S, 315 Slide: M. Eracleous Suzaku XMM-Newton
  21. First Fe Kα profiles from ASCA 43 Slide: M. Eracleous

    Tanaka et al. 1995, Nature Iwasawa et al. 1999, MNRAS
  22. Basic scenario: gnetic fields + accretion + rotation Thorne+86 (Blandford

    02) Plasma high conductivity: σ → ∞ Frozen-in magnetic field: Thorne 1986
  23. • BALs: Broad Absorption Lines ‣ smooth, deep, blue-shifted absn.

    troughs in UV resonance lines ‣ FWHM > 2,000 km/s (traditional definition) and easily up to 30,000 km/s ‣ found in ~20% of all quasars ‣ do these absorbers/outflows represent a phase in the evolution of every quasar, or do they cover a small solid angle in all quasars ? The zoo of UV absorption lines 51 Slide: M. Eracleous
  24. 53 from Junkkarinen et al. in prep (plot courtesy of

    Fred Hamann) CSO 673: Example of a BAL Quasar Observed Wavelength (Å) – vacuum ƒλ (erg cm–2 s–1 Å–1) Slide: M. Eracleous
  25. Ultrafast outflows (“UFOs”) in AGNs (Pounds et al. 2003) NGC

    4051 v~0.1c (Tombesi et al. 2010a) (Reeves et al. 2009) PDS 456 v~0.25c (see Pound’s talk) Slide: F. Tombesi
  26. (Nardini et al. 2015, Science) Wide-angle UFO in the quasar

    PDS 456 (see Reeves’ and Matzeu’s talks) Slide: F. Tombesi
  27. Jet production from black holes: depends strongly on black hole

    spin + magnetic fields near the BH Semenov+04, Science possibilities remain to be better explored in future simula- tions of accretion flows. Interestingly enough, s is similar to the dispersion of s values obtained in the hydrodynamic RIAF simulations of Yuan, Wu & Bu (2012); Bu et al. (2013) for a range of initial conditions. Range of black hole spins and/or magnetic flux threading the horizon – If powerful jets are produced via the BZ mecha- nism then the two fundamental parameters that regulate the jet power are the black hole spin a and the magnetic flux h threading the horizon, besides the mass (Blandford & Znajek 1977; Semenov, Dyadechkin & Punsly 2004): Pjet / ⇠ ✓ a h M ◆2 ; (9) i.e., a and h are degenerate to some extent (cf. Jet power Blandford & Znajek 77; Komissarov+; Nemmen+07; Tchekhovskoy+ spin magnetic flux Blandford-Znajek mechanism: magnetic flux tube spinning black hole ergosphere ⇠ a2 ˙ Mc2
  28. wski et al. mass flux energy flux density al. http://mnras.oxfordjournals.o

    Downloaded from relativistic jet subrelativistic w ind z (R g ) x(R g ) –60 –60 –40 –20 0 20 40 60 –40 –20 0 20 40 60 Jet Jet Corona Corona Main disk body Main disk body a Figure 4 Instantaneous slice at a fixed azimuthal angle (a) and a slice throu relativistic magnetohydrodynamic (GRMHD) simulation of a ho black hole is at (0,0), and lengths are in units of Rg = GM/c2. T Color indicates density, with fluctuations caused by turbulence e out-of-plane component is ignored. Arrows show the direction o density relative to other energy densities: The thickest lines corr region of the jet), intermediate thickness lines indicate regions w correspond to regions with the weakest magnetization (β > 4, pr data taken from Sadowski et al. (2013a). Above and below the main disk is the corona, where the field here is more regular than in the disk body and tend pressure are roughly comparable (β ∼ 1). The value of β from the midplane, with β ∼ 0.1 above approximately two 2003, 2005). The corona is the launchpad for the disk win Astrophys. 2014.52:529-588. Downloaded from www.annualreviews.org rsidade de Sao Paulo (USP) on 11/03/14. For personal use only. Sadowski+13 AA52CH12-Yuan ARI 30 July 2014 7:56 z (R g ) x(R g ) –60 –60 –40 –20 0 20 40 60 x(R g ) –60 –40 –20 0 20 40 60 –40 –20 0 20 40 60 y (R g ) –60 –40 –20 0 20 40 60 lo Jet Jet Corona Corona Main disk body Main disk body a b nnualreviews.org se only. Outflows from black holes: relativistic jets and sub relativistic winds Yuan+14, ARAA z (R g ) x(R g ) –60 –60 –40 –20 0 20 –40 –20 0 20 40 60 Jet Jet Main disk body Main disk body Figure 4 Instantaneous slice at a fixed azimuthal angle relativistic magnetohydrodynamic (GRMHD black hole is at (0,0), and lengths are in units Color indicates density, with fluctuations cau out-of-plane component is ignored. Arrows density relative to other energy densities: Th region of the jet), intermediate thickness line Downloaded from www.annualreviews.org 11/03/14. For personal use only. z (R g ) x(R g ) –60 –60 –40 –20 0 20 40 6 –40 –20 0 20 40 C C Main disk body Main disk body Figure 4 Instantaneous slice at a fixed azimuthal angle (a) and a relativistic magnetohydrodynamic (GRMHD) simulati black hole is at (0,0), and lengths are in units of Rg = G Color indicates density, with fluctuations caused by tur out-of-plane component is ignored. Arrows show the d density relative to other energy densities: The thickest region of the jet), intermediate thickness lines indicate correspond to regions with the weakest magnetization data taken from Sadowski et al. (2013a). 29-588. Downloaded from www.annualreviews.org (USP) on 11/03/14. For personal use only. 12-Yuan ARI 30 July 2014 7:56 z (R g ) –60 –40 –20 0 20 40 60 y (R g ) –60 –40 –20 0 20 40 60 Jet Jet Corona Corona Main disk body Main disk body a b AA52CH12-Yuan ARI 30 July 2014 7:56 z (R g ) x(R g ) –60 –60 –40 –20 0 20 40 6 –40 –20 0 20 40 60 Jet Jet Corona Corona Main disk body Main disk body a nualreviews.org e only. accretion flow
  29. 4 I.F. Mirabel Fig. 1.2 The British journal Nature announced

    on July 16, 1992 the discovery of a microquasar in Gamma-ray bursts Black hole binaries (microquasars) ~1 pc 3C 31 1E1740.7-2942 ~1 Mpc ~100 kpc Active galactic nuclei ~10-4 pc?
  30. 1998.23 1998.41 1998.58 1998.76 1998.94 1998.12 1999.32 1999.55 1999.76 1999.93

    (fraction of year) o l N E al ejected from active galactic nuclei uasars’ located in our Galaxy1–3. In al radio-emitting features appear and ortly after sudden decreases in the X- es a direct observational link between the X-ray dip is probably caused by the n of the inner accretion disk4 as it falls ile the remainder of the disk section is ing the appearance of a superluminal nection has hitherto been established ficient multi-frequency data. Here we e years of monitoring the X-ray and axy 3C120. As has been observed for hat dips in the X-ray emission are right superluminal knots in the radio en X-ray dips appears to scale roughly hole, although there are at present only hift z ¼ 0.033) owing to the combination its radio jet6,7 and its Seyfert-like X-ray gy spectrum8–11 (flux density as a func- tted by a power law of slope aE ¼ 20.7 n line at a photon energy of 6.4 keV. The n the X-ray emission from Seyferts in a m microquasars4: soft X-rays from the harder X-rays from a corona of hot he disk radiation. The presence of the of the X-ray flux arises from the region 1999.93 2000.07 2000.26 2000.54 2000.75 2000.95 2001.28 –2 0 2 4 6 8 Relative right ascension, α (mas) Epoch (frac u t sburg, 198504, Russia cı ´a (CSIC), Apartado Correos 3004, Granada, ity of Michigan, 830 Dennison, 501 East higan 48109-1090, USA elsinki University of Technology, Metsa ¨hovintie rvatory, 520 Edgemont Road, Charlottesville, ty of Central Lancashire, Preston, Lancashire, .................................................................................................. ck holes is thought to power the ejected from active galactic nuclei asars’ located in our Galaxy1–3. In l radio-emitting features appear and rtly after sudden decreases in the X- a direct observational link between he X-ray dip is probably caused by the of the inner accretion disk4 as it falls e the remainder of the disk section is g the appearance of a superluminal ection has hitherto been established cient multi-frequency data. Here we years of monitoring the X-ray and xy 3C120. As has been observed for at dips in the X-ray emission are ght superluminal knots in the radio n X-ray dips appears to scale roughly 1998.12 1999.32 1999.55 1999.76 1999.93 2000.07 2000.26 2000.54 2000.75 Epoch (fraction of year) 1998.12 1999.32 1999.55 1999.76 1999.93 2000.07 2000.26 2000.54 2000.75 Epoch (fraction of year) Marscher et al. 2001, Nature
  31. Observations of proper motions in jets in the optical: radio

    galaxy 3C 264 Meyer et al. 2015, Nature
  32. e present, the most prominent centered on Although a relative

    deficit exists at intermediate nort this is somewhat offset by blazars of unknown type. 0 0 -30 30 -60 60 -90 90 -120 120 -150 150 -180 180 30 -30 60 -60 90 -90 ns of the sources in the Clean Sample. Red: FSRQs, blue: BL Lac objects, magenta: non-blazar AGNs, and green: AGN (A color version of this figure is available in the online journal.) 12 Ackermann+11 Gamma-ray sky observed by Fermi LAT is dominated by blazars FSRQs: flat spectrum radio quasars BL Lac objects AGNs of unknown type non-blazar AGNs
  33. Blazars: looking down the barrel of the gun, observe the

    full, clean, beamed power of the relativistic jet Synchrotron emission Inverse Compton Isotropic Radio Emission from Slowed Plasma in the Lobes E. Meyer+11 log(⌫/Hz) log( ⌫L⌫/ erg s 1 ) this is where I start talking about specific issues why am I showing this slide? WORK ON CONNECTION WITH NEXT SLIDE
  34. Blazar sequence: unifying the zoo of blazars Fossati+98; Donato+01 Ghisellini

    11 Swift / BAT Fermi / LAT Integral FSRQs BL Lacs
  35. Blazar sequence: unifying the zoo of blazars Fossati+98; Donato+01 Ghisellini

    11 Swift / BAT Fermi / LAT Integral FSRQs BL Lacs Line strength ˙ M/ ˙ MEdd
  36. segments: (A), early 1997; and (B), the remainder. (The Mann–

    Whitney test12 indicates that the X-ray fluxes from the two sections 1915þ105 (ref. It is apparent by the appearan core. The latter straight line fit t for each knot: and 1999.70 ^ dips and superlu we consider that yr window withi The probability than 0.2 yr after four events of ea ray events be 4!(0.1)4 < 0.2% The mean tim the time of ejec apparent speed o in 0.10 yr, projec the jet to the lin apparent velocit actual distance t the jet starts as a ingly focused un calculate that a c therefore derive source to the co angular displace Mystery of variability in radio galaxies: need understanding of accretion-jet connection Marscher et al. 2001, Nature 43 GHz (from the images). Each superluminal ejection (with the possible exception of event t) coincides with the onset of an increase in flux density in at least one of the radio light curves. We designed our RXTE programme to search for X-ray dips. In order to define such events, we first divide the data into two segments: (A), early 1997; and (B), the remainder. (The Mann– Whitney test12 indicates that the X-ray fluxes from the two sections fo 1 ra d F 1 b c st fo a d w y T th fo r 4 3C 120
  37. Gamma-ray variability of radio galaxy 3C 120 High-energy γ-ray (30

    day bin), 230 GHz SMA, and 43 GHz VLBA core light curves of 3C 120 from MJD 54500 to 57000 (correspon and 2014 December 9, respectively). In the top panel, 3C 120 is measured with > TS 9 for only five time bins (red squares) and 90% confide s are shown when < TS 9 (gray triangles). physical Journal Letters, 799:L18 (6pp), 2015 January 30 Ta Tanaka et al. 2015, ApJ
  38. The Astrophysical Journal, 753:61 (13pp), 2012 July 1 Su &

    Finkbeiner 0.80 GeV < E < 3.20 GeV -25 0 25 0 0 -50 -25 0 25 50 0 0 -0.5 0.0 0.5 1.0 1.5 2.0 2.5 -0.5 0.0 0.5 1.0 1.5 2.0 2.5 keV cm-2 s-1 sr-1 0.80 GeV < E < 3.20 GeV -25 0 25 0 0 -50 -25 0 25 50 0 0 -0.5 0.0 0.5 1.0 1.5 2.0 2.5 -0.5 0.0 0.5 1.0 1.5 2.0 2.5 keV cm-2 s-1 sr-1 Figure 2. We show gamma-ray maps in Galactic coordinate (−50◦ < b < 50◦, −25◦ < ℓ < 25◦) from Fermi-LAT for photon energies 0.8–3.2 GeV. The Galactic center is marked with a cross sign in the center of the maps. Two large-scale-collimated jet-like features (the gamma-ray jets) are revealed. The right panel shows the same image as the left panel, but with a dashed line representing the direction of the suspected jet. Point sources have been subtracted based on the Second Fermi-LAT catalog (2FGL; The Fermi-LAT Collaboration 2011), and large sources, including the inner disk (−5◦ < b < 7◦), have been masked. The maps are smoothed by a Gaussian kernel with FWHM of 2◦. The Fermi diffuse Galactic model (Pass7_V6) has been subtracted to remove known large-scale diffuse gamma-ray emission. Evidence for gamma-ray jets from our Galactic Center Su+12
  39. 7.11. Further reading 239 Table 7.1. AGN components: Location density

    and ionization parameter Component Distance in rg Density Ionization parameter Accretion disk ∼100 ∼1015 cm−3 Uoxygen = 10−3–10−1 BLR 104–105 ∼1010 cm−3 Uhydrogen ∼ 10−2 Torus 105–106 103–106 cm−3 Uoxygen ∼ 10−2 HIG ∼106 103–105 cm−3 Uoxygen ∼ 10−2 NLR 107–108 103–105 cm−3 Uhydrogen ∼ 10−2 Starburst 107–108 100–103 cm−3 Uhydrogen = 1–10−2 The mass outflow rate is another problematic issue. While the total mass in the BLR is small, this is not the case in the NLR. In fact, it is hard to imagine a situation where disk outflows can explain the total mass in an outflowing NLR. Moreover, Putting it all together Netzer Winds (BAL, UFOs) Jets