Upgrade to Pro — share decks privately, control downloads, hide ads and more …

BASTA Spring 2015: .NET Performance Optimization

BASTA Spring 2015: .NET Performance Optimization

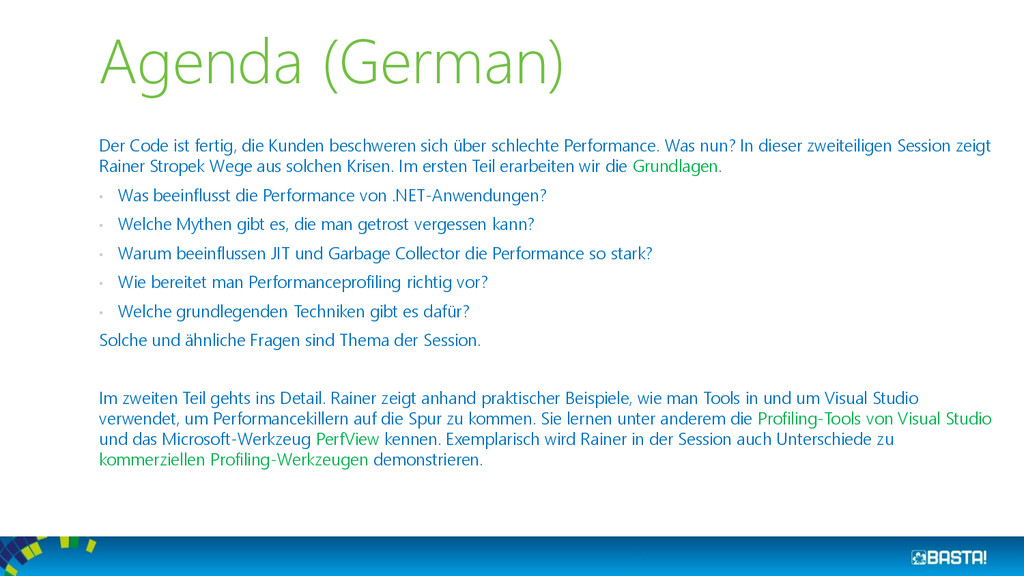
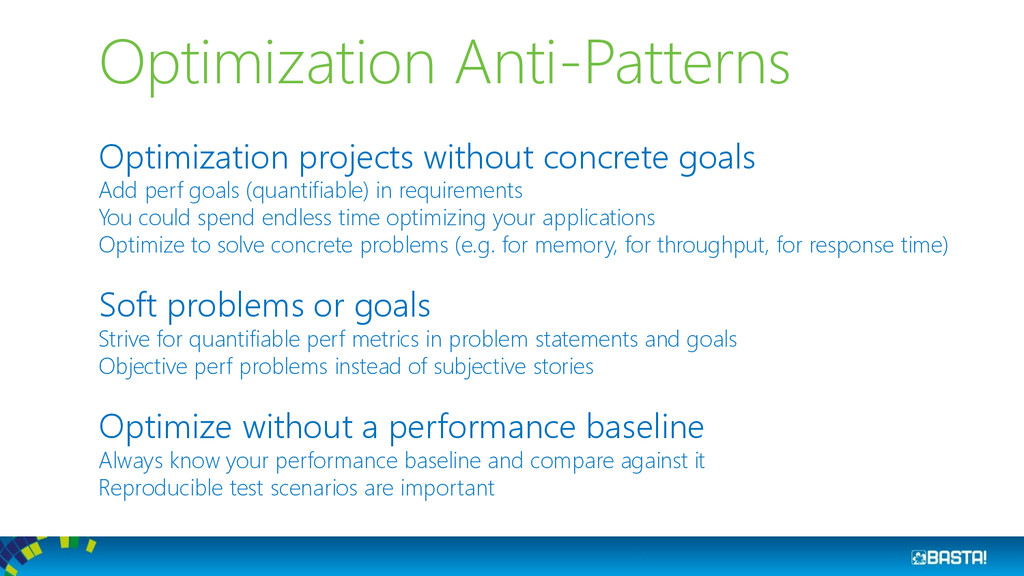
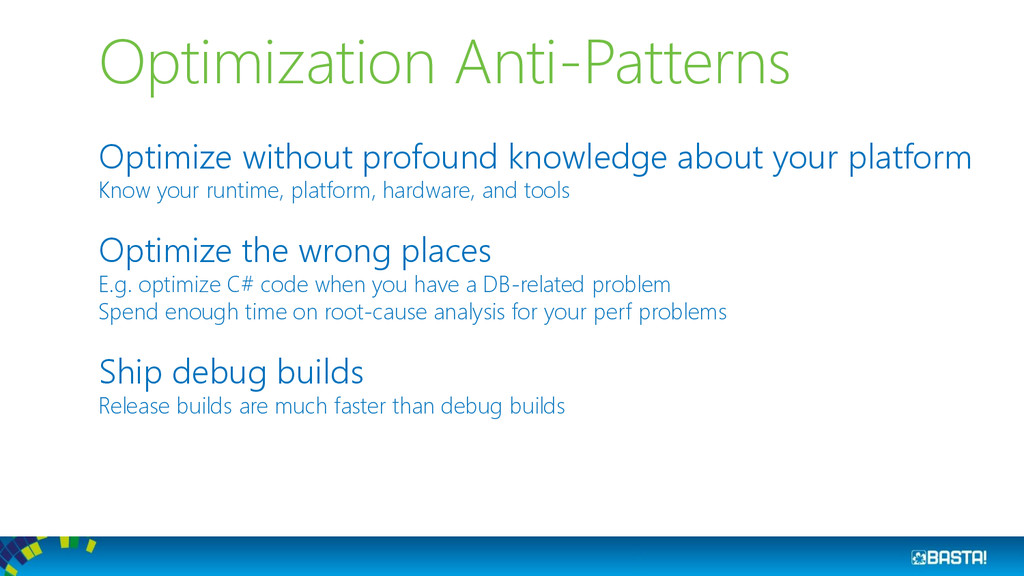
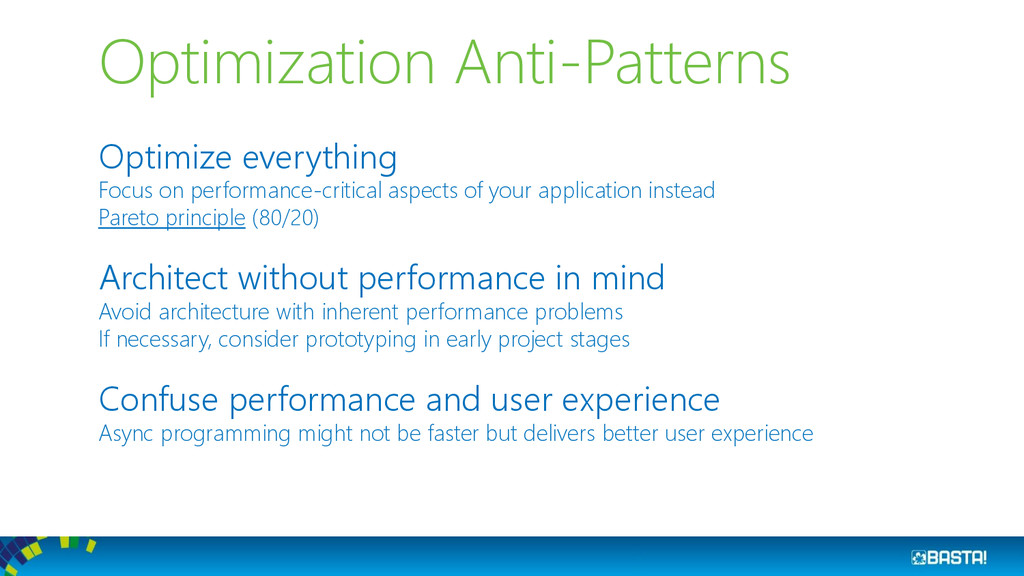
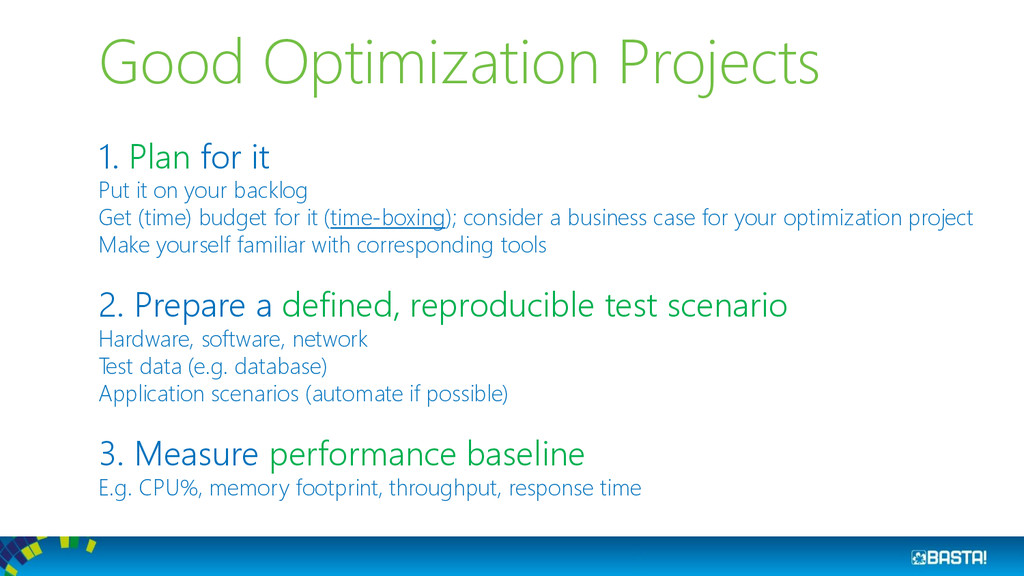
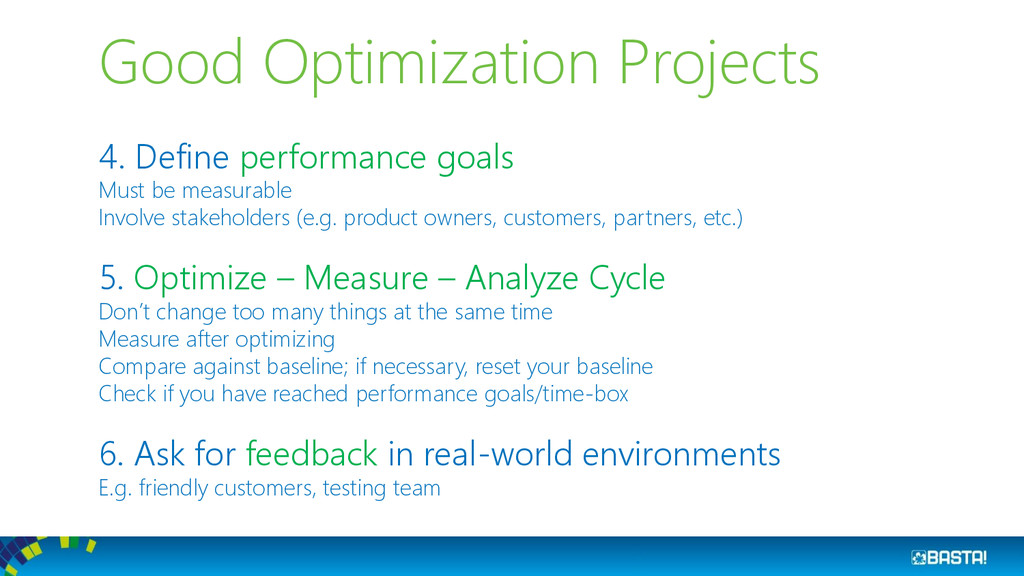
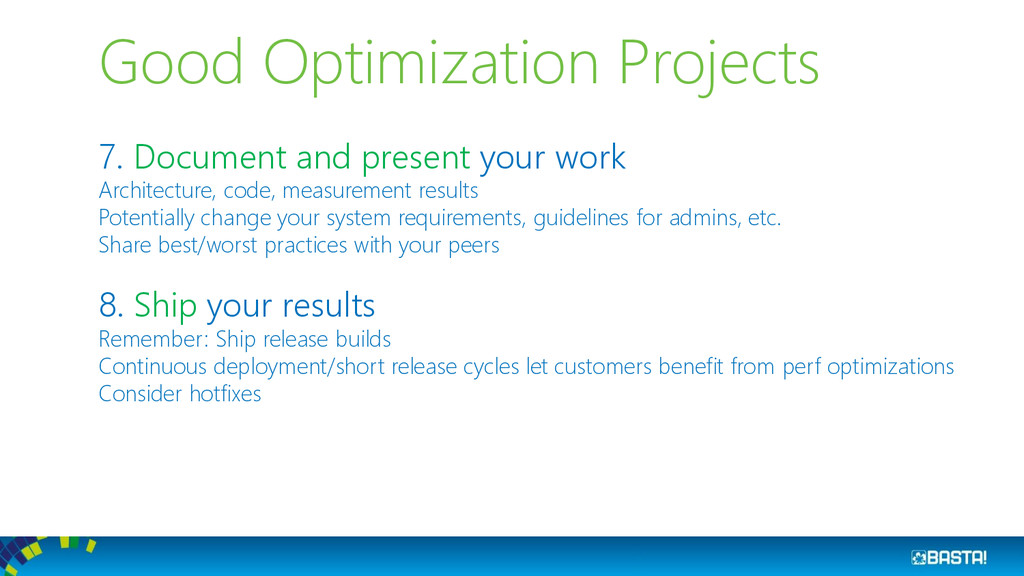
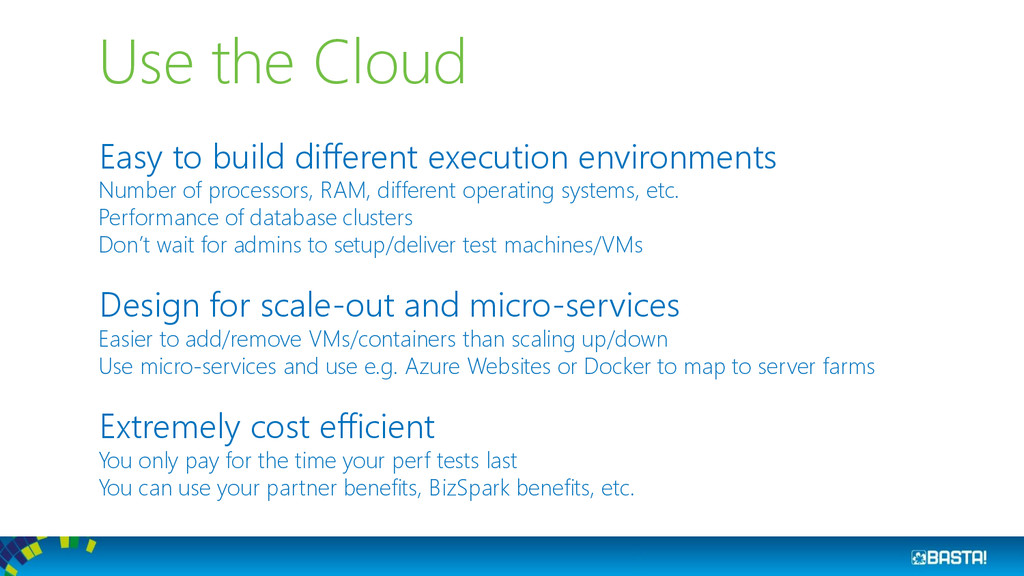
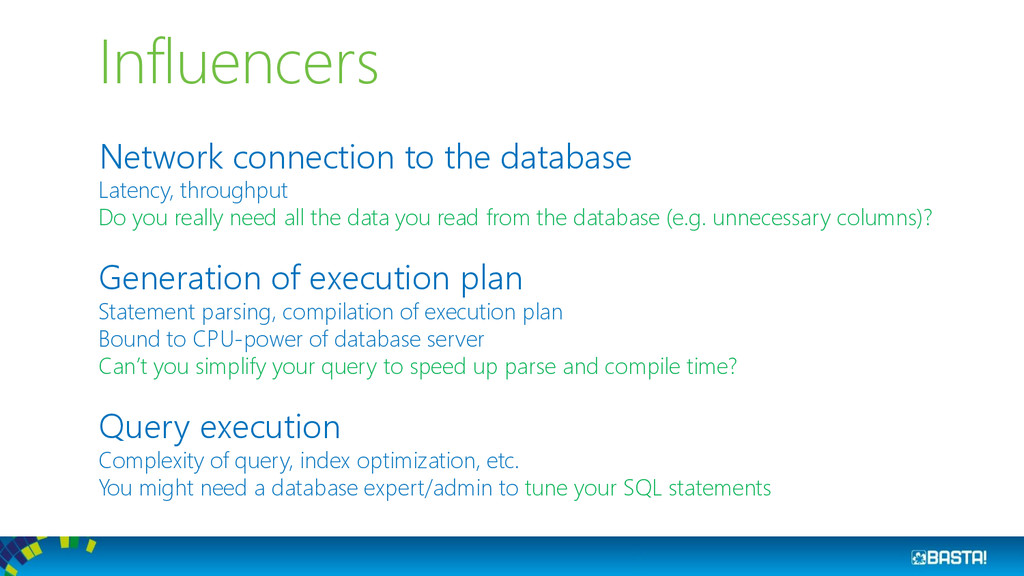
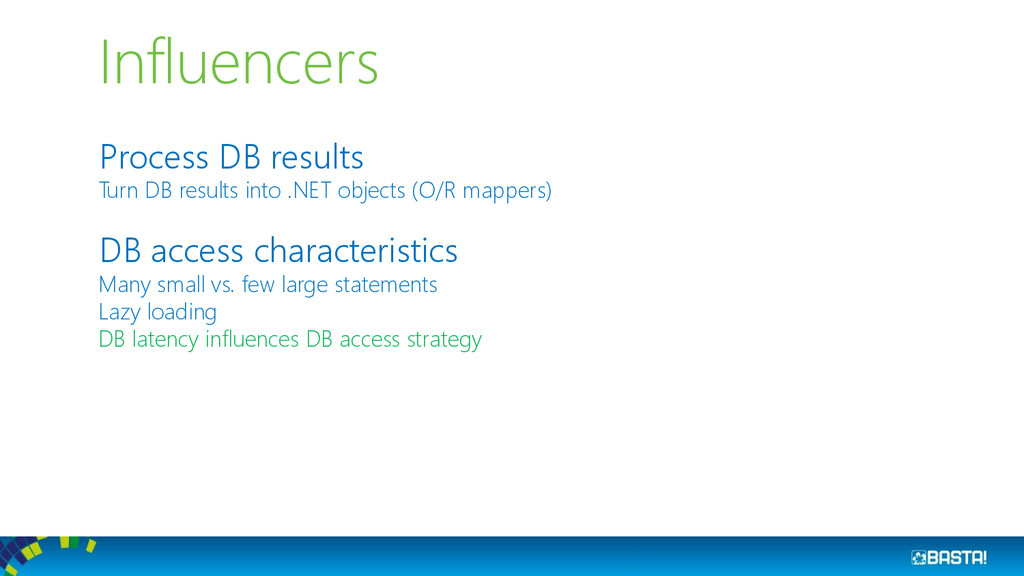
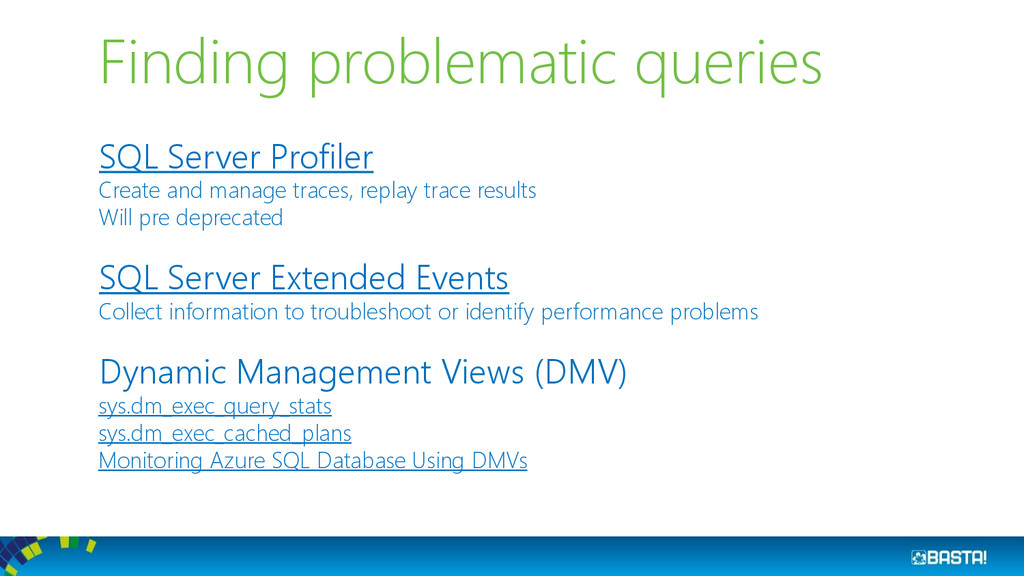
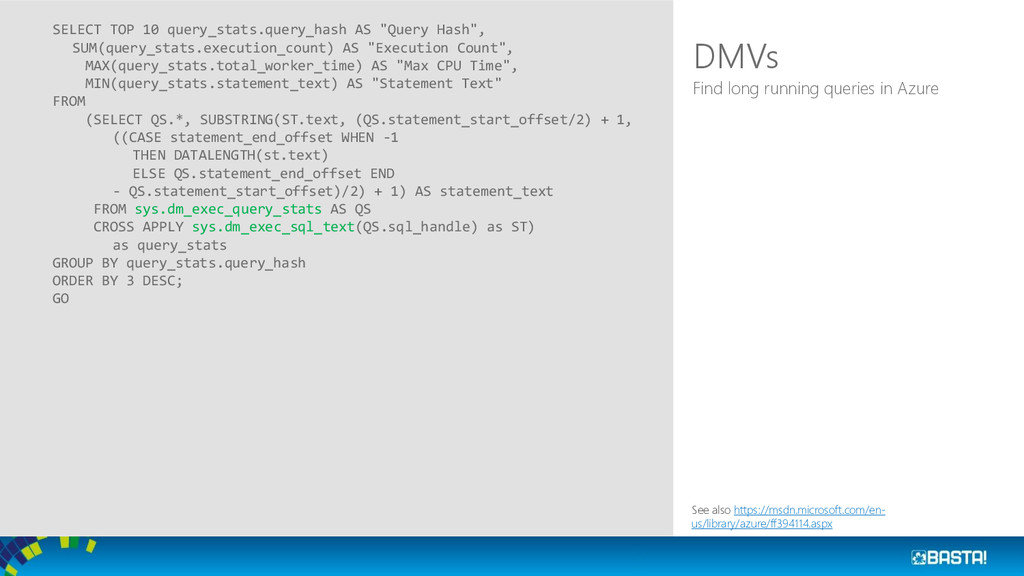
Project completed, application shipped - but customer isn't happy with the performance. What now? At the German BASTA 2015 conference I will do two sessions about performance optimization in .NET applications. Here are the slides I am going to use. The sample code can be found in my blog at http://www.software-architects.com

Rainer Stropek

February 25, 2015
Tweet

More Decks by Rainer Stropek

Other Decks in Programming

Transcript

  1. Your Host Rainer Stropek Developer, Entrepreneur Azure MVP , MS

    Regional Director Contact software architects gmbh [email protected] Twitter: @rstropek
  2. Agenda (German) Der Code ist fertig, die Kunden beschweren sich

    über schlechte Performance. Was nun? In dieser zweiteiligen Session zeigt Rainer Stropek Wege aus solchen Krisen. Im ersten Teil erarbeiten wir die Grundlagen. • Was beeinflusst die Performance von .NET-Anwendungen? • Welche Mythen gibt es, die man getrost vergessen kann? • Warum beeinflussen JIT und Garbage Collector die Performance so stark? • Wie bereitet man Performanceprofiling richtig vor? • Welche grundlegenden Techniken gibt es dafür? Solche und ähnliche Fragen sind Thema der Session. Im zweiten Teil gehts ins Detail. Rainer zeigt anhand praktischer Beispiele, wie man Tools in und um Visual Studio verwendet, um Performancekillern auf die Spur zu kommen. Sie lernen unter anderem die Profiling-Tools von Visual Studio und das Microsoft-Werkzeug PerfView kennen. Exemplarisch wird Rainer in der Session auch Unterschiede zu kommerziellen Profiling-Werkzeugen demonstrieren.
  3. Why Optimizing? Examples … Customer satisfaction Customers report performance problems

    Reduce churn rate Tip: Ask you users if they are leaving because of poor performance Raise conversion rate Consider the first impression potential users have from your software Tip: Ask your users why they are not buying Reduce TCO of your application Performance problems waste your user’s time = money Reduce TCO for your customers by lowering system requirements Cloud environment is too expensive
  4. Optimization Anti-Patterns Add optimizations during initial development Write obvious (not

    naïve) code first  measure  optimize if necessary Perf problems will always be where you don’t expect them Optimize code without measuring Without measuring, optimized code is often slower Make sure to know if your optimization brought you closer to your goals Optimize for non-representative environments Specify problematic environments as accurate as possible Test your application on systems similar to your customers’ environments Hardware, software, test data (consider data security)
  5. Optimization Anti-Patterns Optimization projects without concrete goals Add perf goals

    (quantifiable) in requirements You could spend endless time optimizing your applications Optimize to solve concrete problems (e.g. for memory, for throughput, for response time) Soft problems or goals Strive for quantifiable perf metrics in problem statements and goals Objective perf problems instead of subjective stories Optimize without a performance baseline Always know your performance baseline and compare against it Reproducible test scenarios are important
  6. Optimization Anti-Patterns Optimize without profound knowledge about your platform Know

    your runtime, platform, hardware, and tools Optimize the wrong places E.g. optimize C# code when you have a DB-related problem Spend enough time on root-cause analysis for your perf problems Ship debug builds Release builds are much faster than debug builds
  7. Optimization Anti-Patterns Optimize everything Focus on performance-critical aspects of your

    application instead Pareto principle (80/20) Architect without performance in mind Avoid architecture with inherent performance problems If necessary, consider prototyping in early project stages Confuse performance and user experience Async programming might not be faster but delivers better user experience
  8. Good Optimization Projects 1. Plan for it Put it on

    your backlog Get (time) budget for it (time-boxing); consider a business case for your optimization project Make yourself familiar with corresponding tools 2. Prepare a defined, reproducible test scenario Hardware, software, network Test data (e.g. database) Application scenarios (automate if possible) 3. Measure performance baseline E.g. CPU%, memory footprint, throughput, response time
  9. Good Optimization Projects 4. Define performance goals Must be measurable

    Involve stakeholders (e.g. product owners, customers, partners, etc.) 5. Optimize – Measure – Analyze Cycle Don’t change too many things at the same time Measure after optimizing Compare against baseline; if necessary, reset your baseline Check if you have reached performance goals/time-box 6. Ask for feedback in real-world environments E.g. friendly customers, testing team
  10. Good Optimization Projects 7. Document and present your work Architecture,

    code, measurement results Potentially change your system requirements, guidelines for admins, etc. Share best/worst practices with your peers 8. Ship your results Remember: Ship release builds Continuous deployment/short release cycles let customers benefit from perf optimizations Consider hotfixes
  11. Use the Cloud Easy to build different execution environments Number

    of processors, RAM, different operating systems, etc. Performance of database clusters Don’t wait for admins to setup/deliver test machines/VMs Design for scale-out and micro-services Easier to add/remove VMs/containers than scaling up/down Use micro-services and use e.g. Azure Websites or Docker to map to server farms Extremely cost efficient You only pay for the time your perf tests last You can use your partner benefits, BizSpark benefits, etc.
  12. Use the Cloud Less data security issues if you use

    artificial test data Ability to run large-scale load tests Gather perf data during long-running, large-scale load tests SaaS enables you to optimize for a concrete environment Economy of scale
  13. Performance influencers Performance of storage system Database, file system, etc.

    Performance of services used E.g. external web services Network characteristics How chatty is your application? Latency, throughput, bandwidth Especially important in multi-tier applications
  14. Performance influencers Efficiency of your algorithms Core algorithms Parallel vs.

    sequential Platform characteristics JIT compiler Garbage collector Hardware Number of cores, 64 vs. 32 bits, RAM, SSDs, etc.
  15. Influencers Network connection to the database Latency, throughput Do you

    really need all the data you read from the database (e.g. unnecessary columns)? Generation of execution plan Statement parsing, compilation of execution plan Bound to CPU-power of database server Can’t you simplify your query to speed up parse and compile time? Query execution Complexity of query, index optimization, etc. You might need a database expert/admin to tune your SQL statements
  16. Influencers Process DB results Turn DB results into .NET objects

    (O/R mappers) DB access characteristics Many small vs. few large statements Lazy loading DB latency influences DB access strategy
  17. Finding problematic queries SQL Server Profiler Create and manage traces,

    replay trace results Will pre deprecated SQL Server Extended Events Collect information to troubleshoot or identify performance problems Dynamic Management Views (DMV) sys.dm_exec_query_stats sys.dm_exec_cached_plans Monitoring Azure SQL Database Using DMVs
  18. DMVs SELECT TOP 10 query_stats.query_hash AS "Query Hash", SUM(query_stats.execution_count) AS

    "Execution Count", MAX(query_stats.total_worker_time) AS "Max CPU Time", MIN(query_stats.statement_text) AS "Statement Text" FROM (SELECT QS.*, SUBSTRING(ST.text, (QS.statement_start_offset/2) + 1, ((CASE statement_end_offset WHEN -1 THEN DATALENGTH(st.text) ELSE QS.statement_end_offset END - QS.statement_start_offset)/2) + 1) AS statement_text FROM sys.dm_exec_query_stats AS QS CROSS APPLY sys.dm_exec_sql_text(QS.sql_handle) as ST) as query_stats GROUP BY query_stats.query_hash ORDER BY 3 DESC; GO Find long running queries in Azure See also https://msdn.microsoft.com/en- us/library/azure/ff394114.aspx
  19. Things to Consider How often do you call over the

    network? Latency, speed-of-light problem Ratio between latency and service operation Consider reducing network calls with caching (e.g. Redis cache) … … but make sure that you cache doesn’t make perf worse! How much data do you transfer? Transfer less data (e.g. unnecessary database columns) Make protocol more efficient (e.g. specific REST services or OData instead of generic services) Measuring is important The tools you use might do things you are not aware of (e.g. OR-mapper)
  20. JIT Compiler Just in Time Compiler PreJITStub responsible for triggering

    JIT Overwritten with a jump to JIT compiled code Image Source: https://msdn.microsoft.com/en-us/magazine/cc163791.aspx
  21. NGEN – Native Image Generator Generates native images for assembly

    and dependencies Reference counting Advantages Better startup time (no JITing, faster assembly loading) Smaller memory footprint (code sharing between processes, important in RDS scenarios) Disadvantages NGEN has to be called (also for updates) – requires installer (incl. admin privileges) NGEN takes time (longer install time) NGEN images are larger on disk Native code slightly less performant than JIT’ed code
  22. NGEN # Display NGEN’ed images ngen display # Install assembly

    ngen install StockTraderRI.exe # Uninstall assembly ngen uninstall StockTraderRI.exe Ahead-of-time Compilation Note that it is important to use the correct version of NGEN 64bit: c:\Windows\Microsoft.NET\Fra mework64\v4.0.30319\ 32bit: C:\Windows\Microsoft.NET\Fra mework\v4.0.30319\
  23. NGEN/JIT Tips WiX installer framework supports NGEN’ing How To: NGen

    Managed Assemblies During Installation Further optimization with MPGO (.NET 4.5) Managed Profile Guided Optimization Tool Generate profile data consumed by NGEN to optimize native images (disk layout) Opt-in to background JIT (.NET 4.5) Use System.Runtime.ProfileOptimization class
  24. CLR Memory Management CLR is a stack-based runtime Value types

    Managed heap Managed by the CLR Allocating memory is usually very fast When necessary (e.g. thresholds, memory pressure, etc.), unreferenced memory is freed Generations of objects Gen 0, 1, and 2 Large objects (>85k bytes) are handled differently (large object heap)
  25. CLR Memory Management Different GC strategies Workstation (background) garbage collection

    Server garbage collection (optimized for throughput) Choose via config setting Concurrent collection for Gen 2 collections You can allocate small objects during Gen 2 collection Background GC For workstation in .NET >= 4, for server in .NET >= 4.5 For details see MSDN
  26. Memory Management Tips Avoid allocating unnecessary memory This would raise

    GC pressure Consider weak references for large objects Reuse large objects Use memory perf counters for analysis See MSDN for details Be careful when inducing GC with GC.Collect Add GC.Collect only if you are sure that it makes sense
  27. Memory Management Tips Hunt memory leaks and remove them See

    my memory leak hunting challenge on Codeproject Suppress GC during perf critical operations Use GC latency modes for that Use this feature with care
  28. Summary Prepare your optimization projects appropriately Write obvious code first

    Measure to find the right places to optimize Use profilers Make small steps and gather feedback Use the cloud