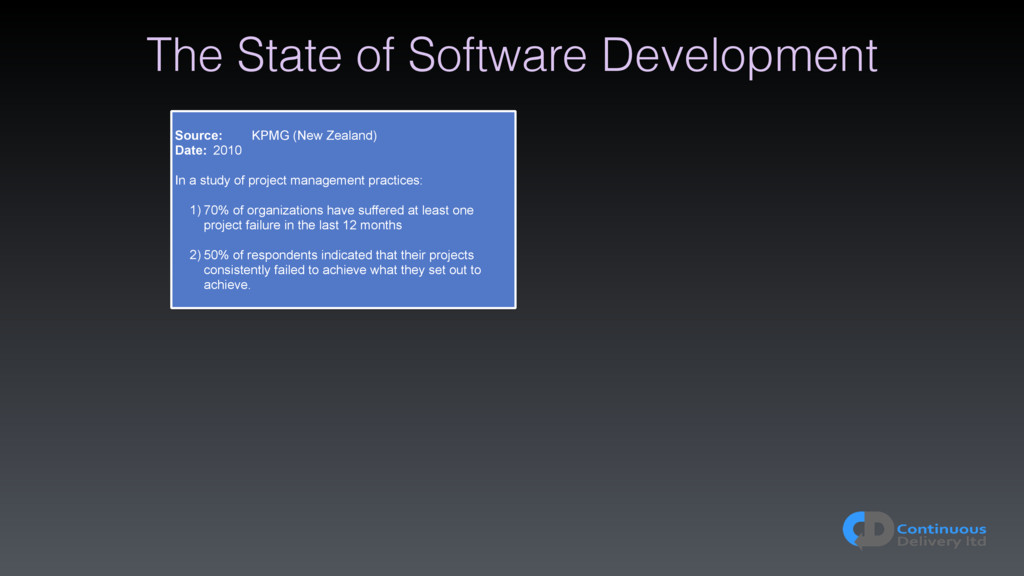
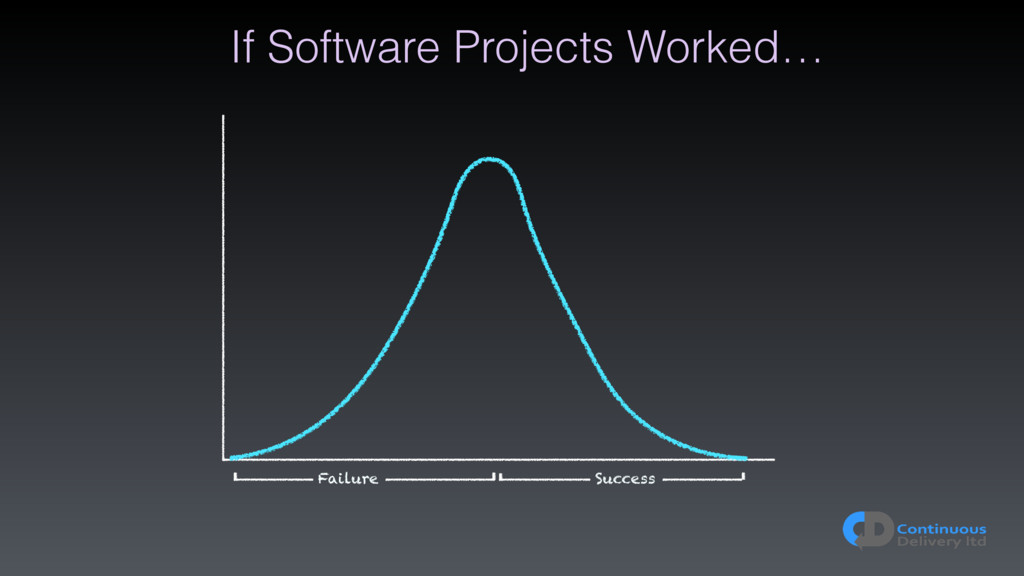
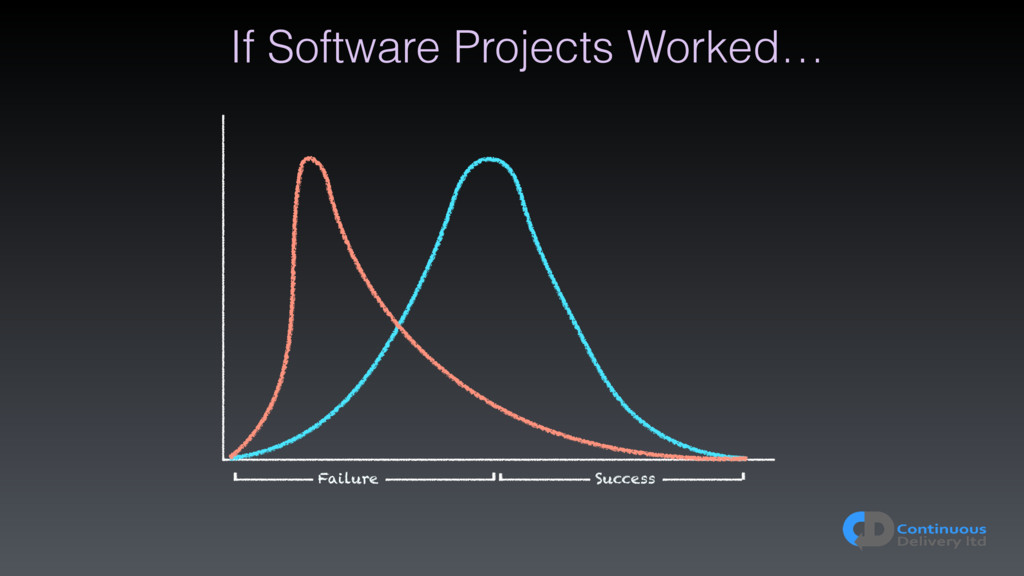
2010 In a study of project management practices: 1) 70% of organizations have suffered at least one project failure in the last 12 months 2) 50% of respondents indicated that their projects consistently failed to achieve what they set out to achieve.
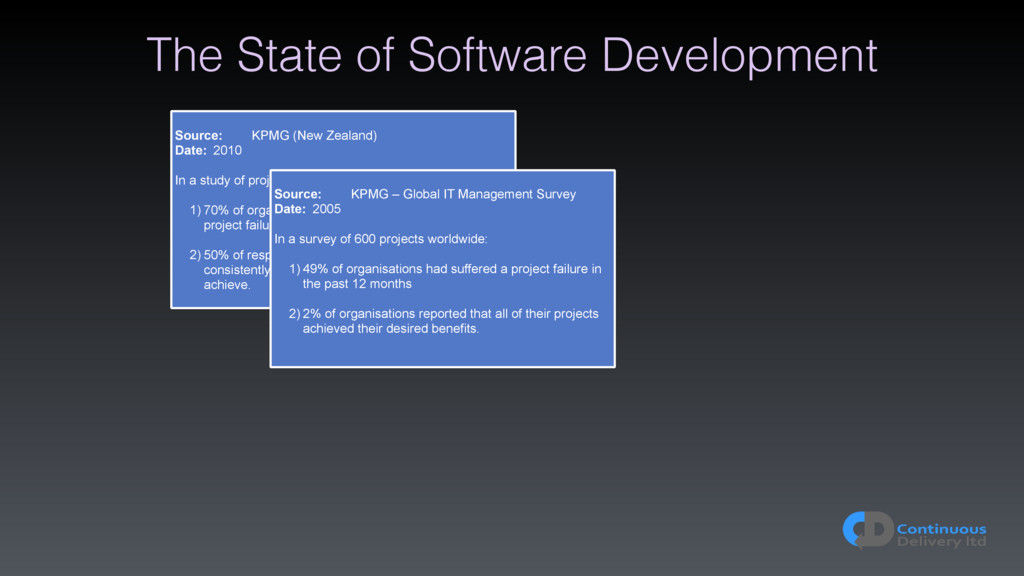
2010 In a study of project management practices: 1) 70% of organizations have suffered at least one project failure in the last 12 months 2) 50% of respondents indicated that their projects consistently failed to achieve what they set out to achieve. Source: KPMG – Global IT Management Survey Date: 2005 In a survey of 600 projects worldwide: 1) 49% of organisations had suffered a project failure in the past 12 months 2) 2% of organisations reported that all of their projects achieved their desired benefits.
2010 In a study of project management practices: 1) 70% of organizations have suffered at least one project failure in the last 12 months 2) 50% of respondents indicated that their projects consistently failed to achieve what they set out to achieve. Source: KPMG – Global IT Management Survey Date: 2005 In a survey of 600 projects worldwide: 1) 49% of organisations had suffered a project failure in the past 12 months 2) 2% of organisations reported that all of their projects achieved their desired benefits. Source: Logica Management Consulting Date: 2008 In a survey of 380 senior execs in Western Europe: 1) 35% of organisations abandoned a major project in the last 3years 2) 37% of business change programmes fail to deliver benefits.
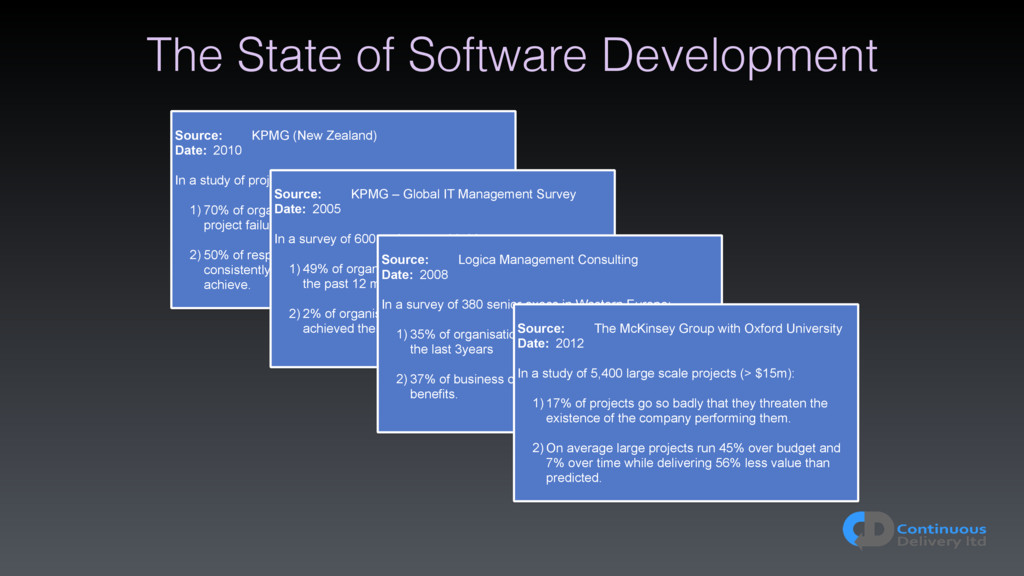
2010 In a study of project management practices: 1) 70% of organizations have suffered at least one project failure in the last 12 months 2) 50% of respondents indicated that their projects consistently failed to achieve what they set out to achieve. Source: KPMG – Global IT Management Survey Date: 2005 In a survey of 600 projects worldwide: 1) 49% of organisations had suffered a project failure in the past 12 months 2) 2% of organisations reported that all of their projects achieved their desired benefits. Source: Logica Management Consulting Date: 2008 In a survey of 380 senior execs in Western Europe: 1) 35% of organisations abandoned a major project in the last 3years 2) 37% of business change programmes fail to deliver benefits. Source: The McKinsey Group with Oxford University Date: 2012 In a study of 5,400 large scale projects (> $15m): 1) 17% of projects go so badly that they threaten the existence of the company performing them. 2) On average large projects run 45% over budget and 7% over time while delivering 56% less value than predicted.
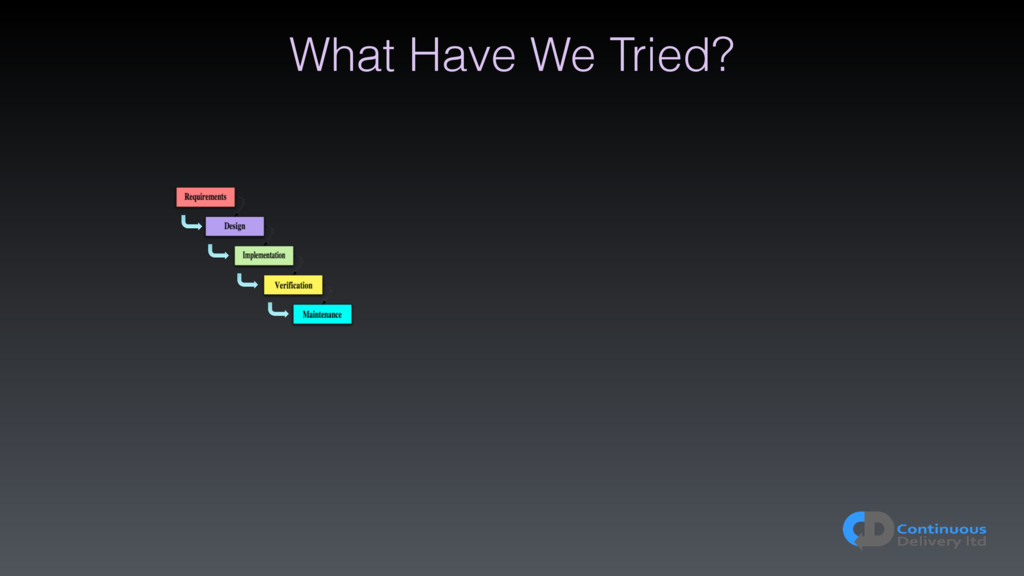
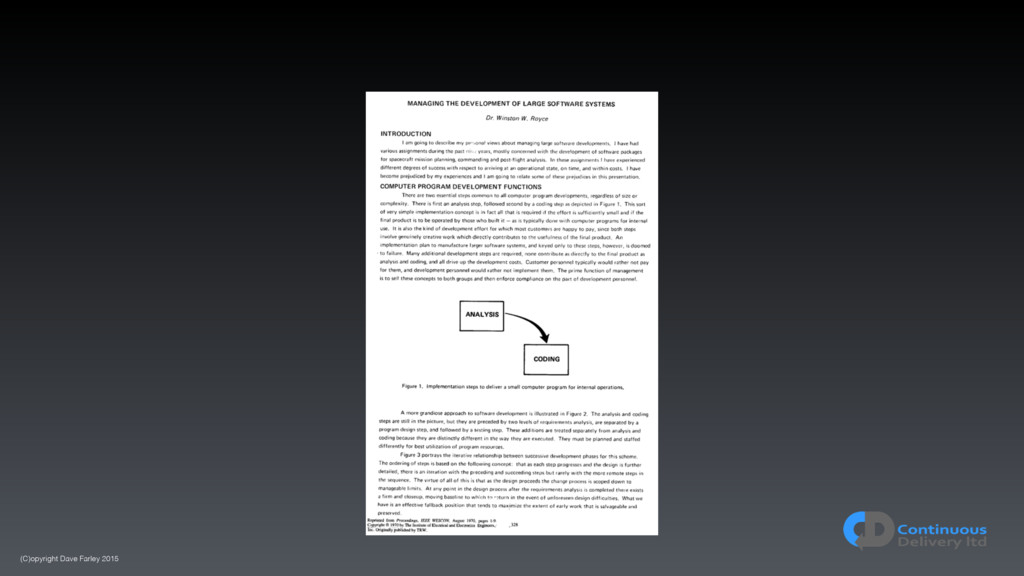
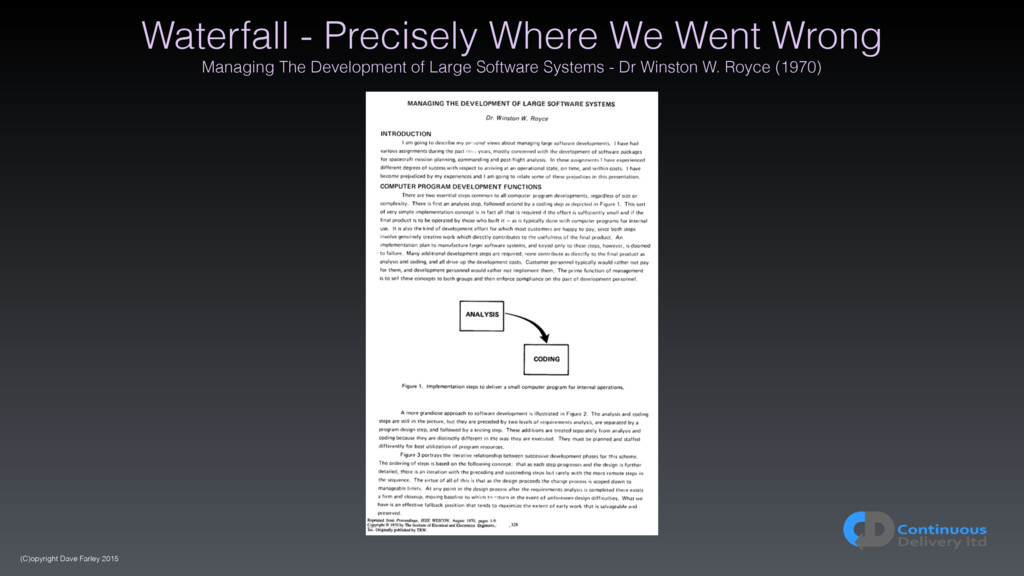
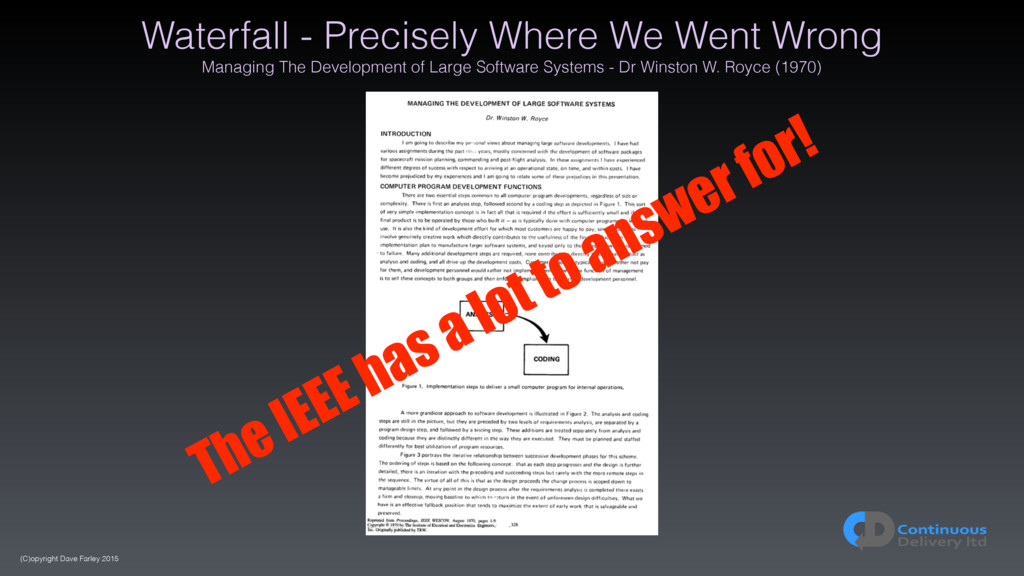
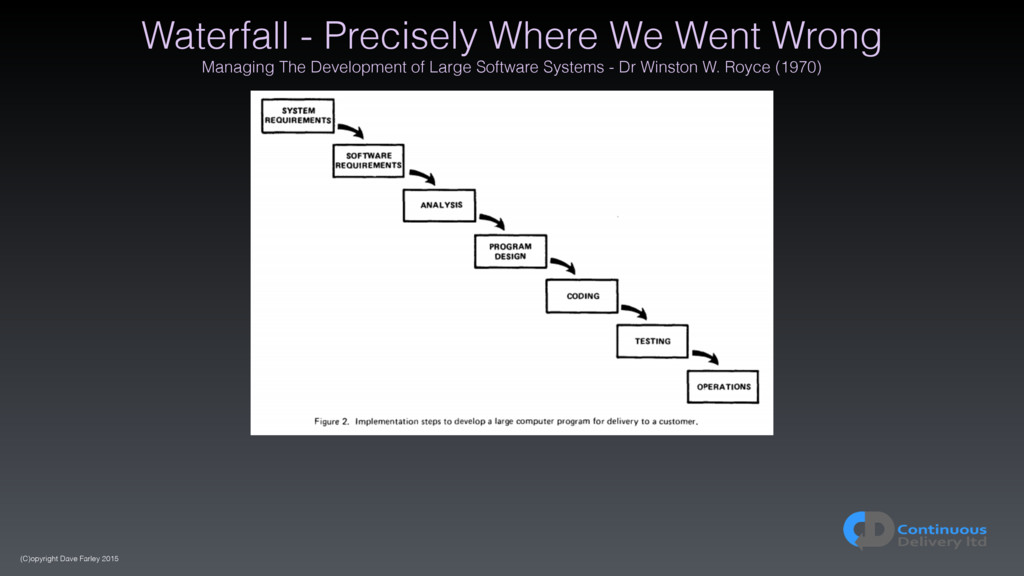
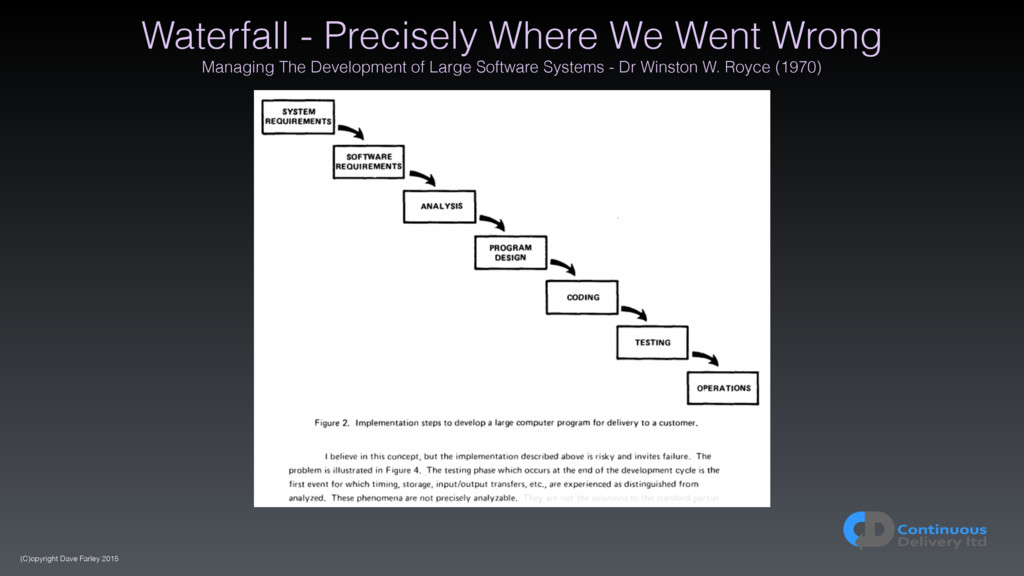
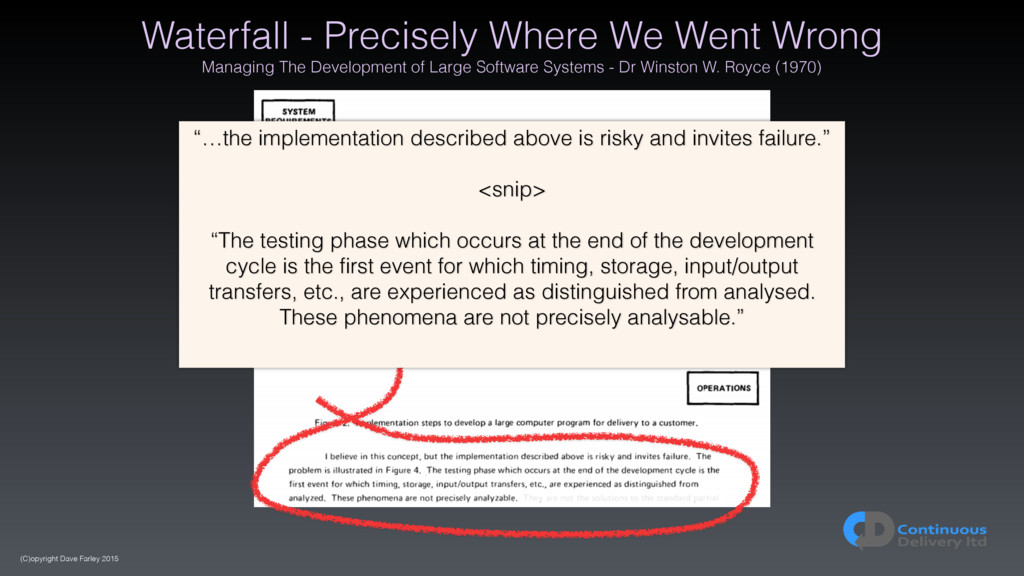
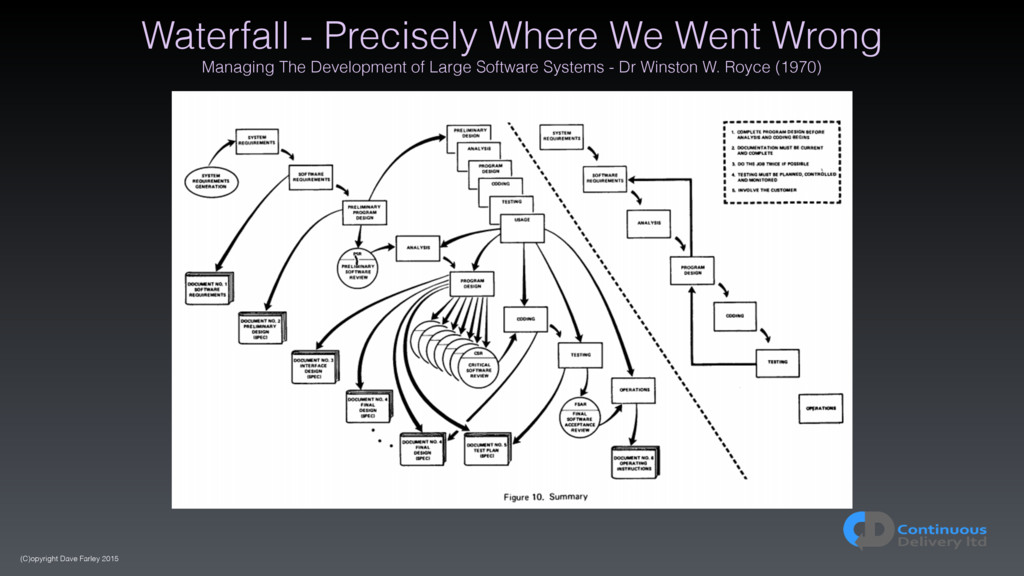
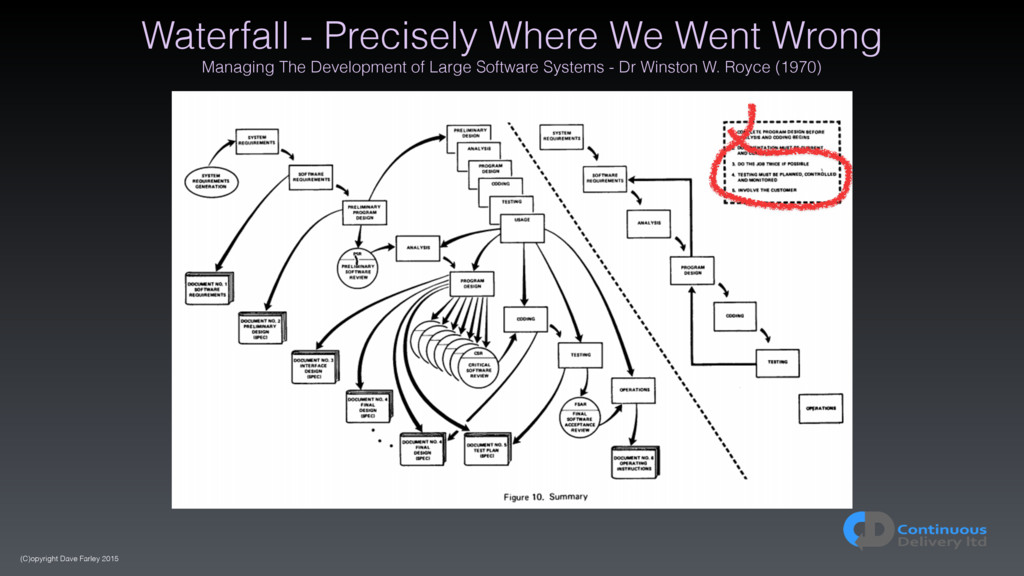
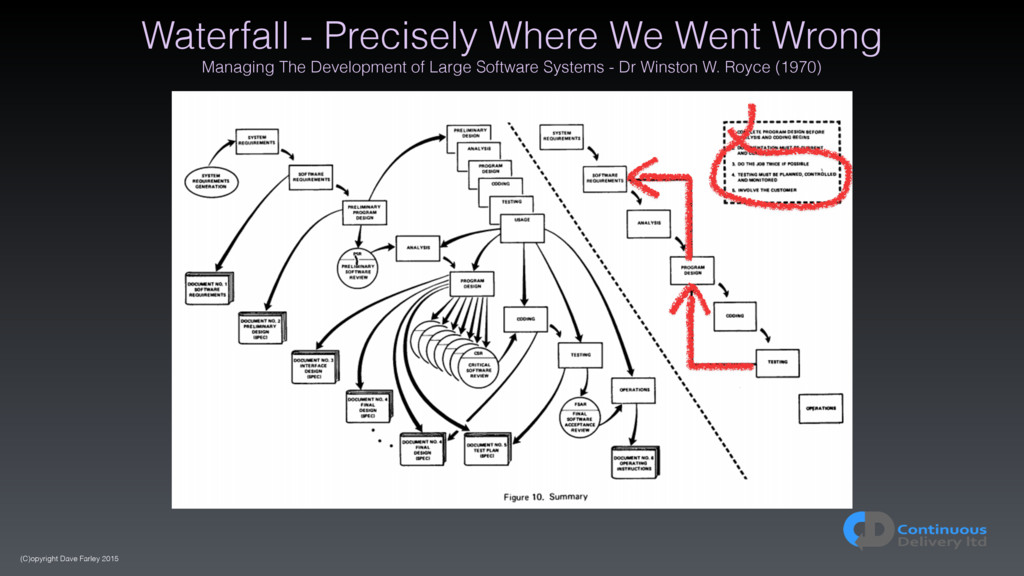
and invites failure.” <snip> “The testing phase which occurs at the end of the development cycle is the first event for which timing, storage, input/output transfers, etc., are experienced as distinguished from analysed. These phenomena are not precisely analysable.” Waterfall - Precisely Where We Went Wrong Managing The Development of Large Software Systems - Dr Winston W. Royce (1970)
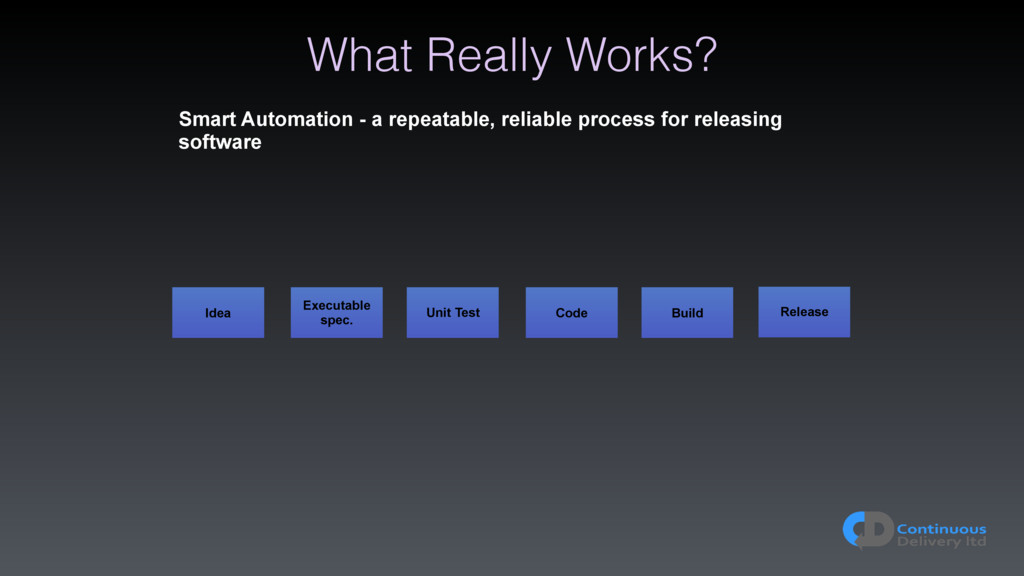
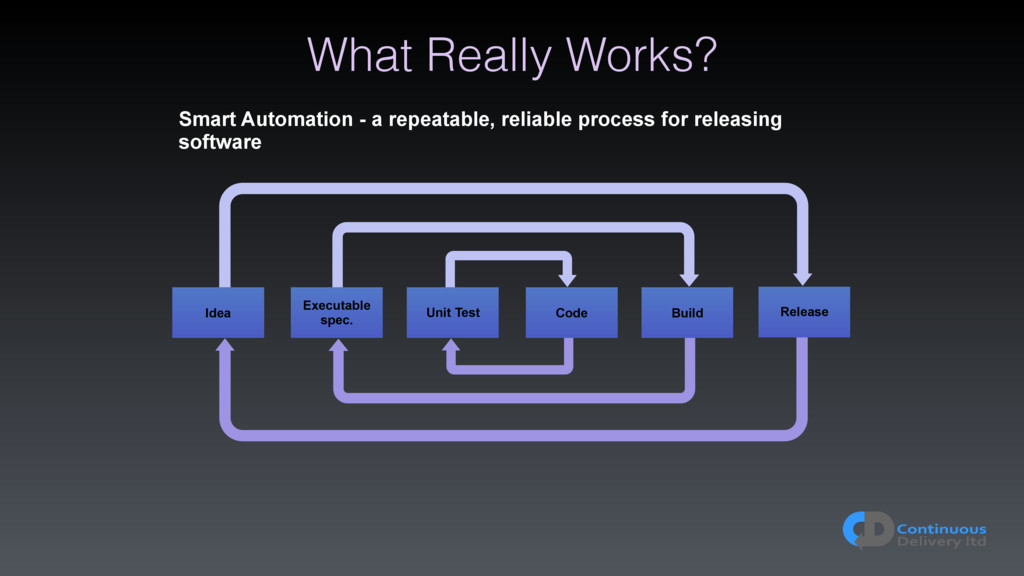
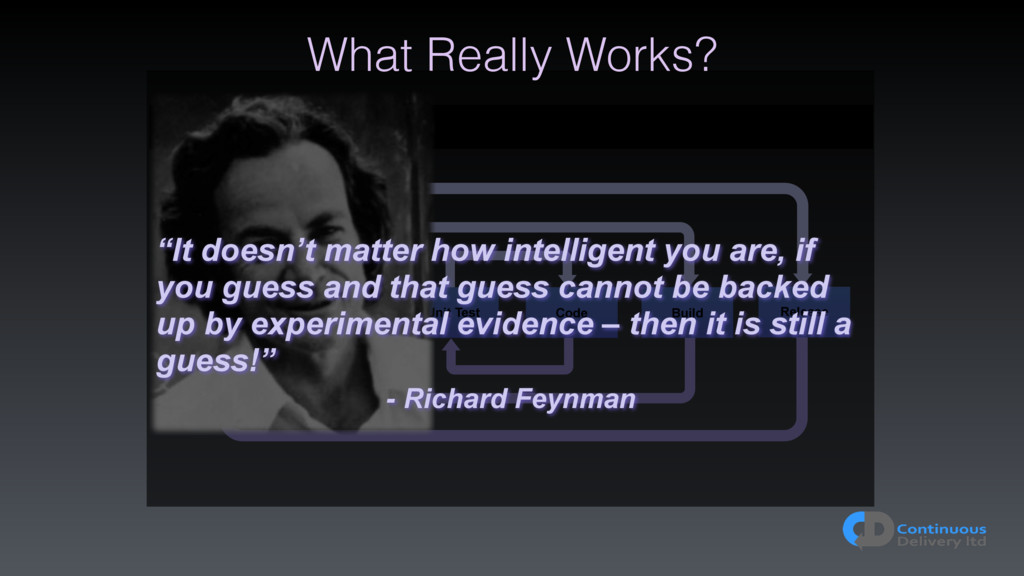
Unit Test Code Idea Executable spec. Build Release “It doesn’t matter how intelligent you are, if you guess and that guess cannot be backed up by experimental evidence – then it is still a guess!” - Richard Feynman What Really Works?
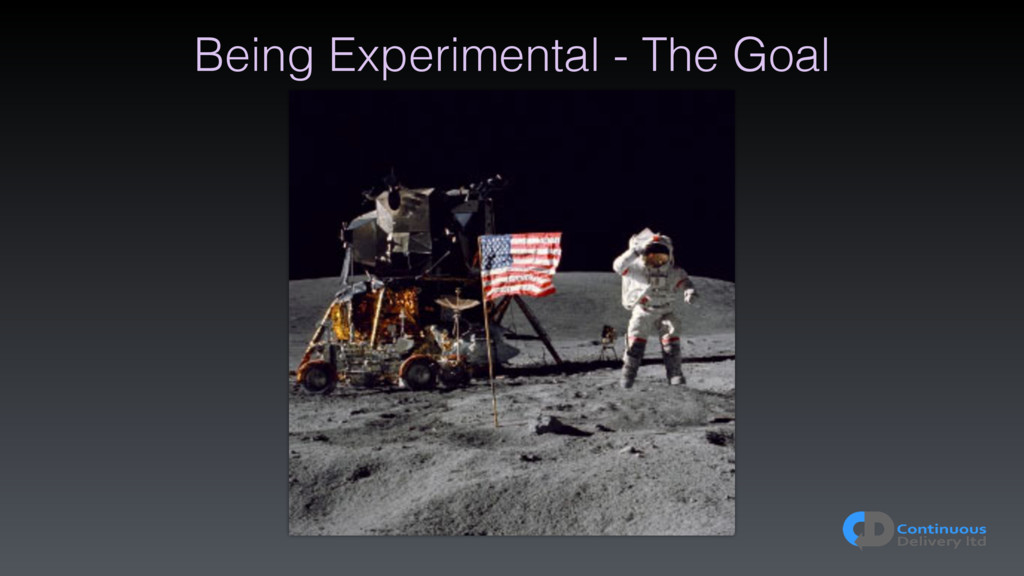
should commit itself to achieving the goal, before this decade is out, of landing a man on the moon and returning him safely to the earth” - John F. Kennedy (1961)
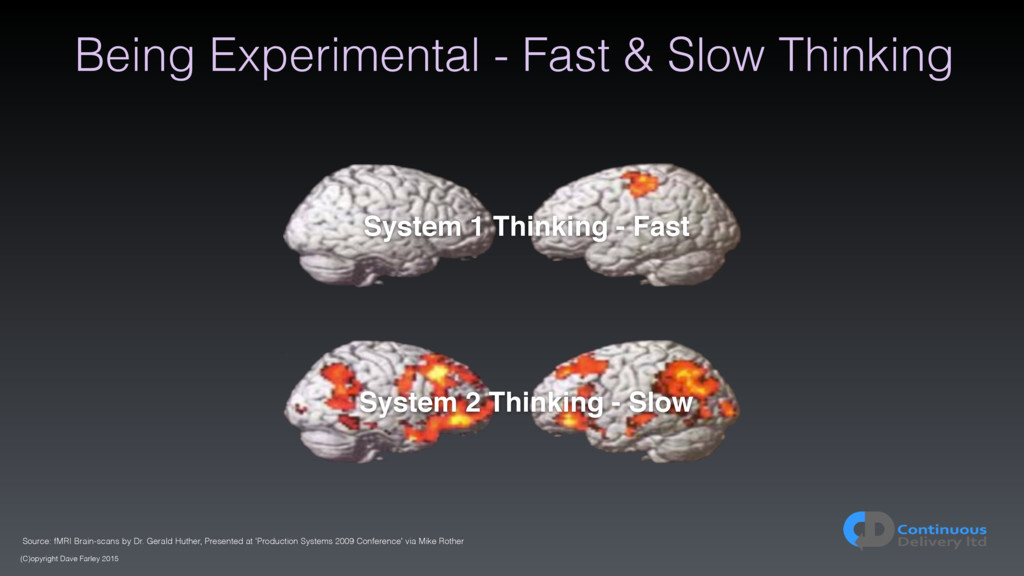
Thinking System 1 Thinking - Fast System 2 Thinking - Slow Source: fMRI Brain-scans by Dr. Gerald Huther, Presented at ‘Production Systems 2009 Conference’ via Mike Rother
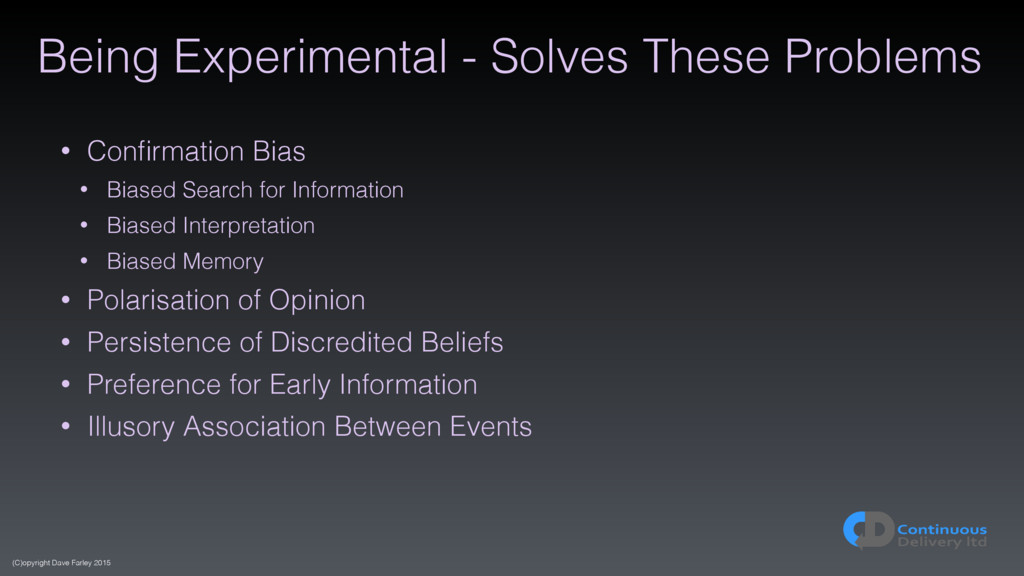
• Confirmation Bias • Biased Search for Information • Biased Interpretation • Biased Memory • Polarisation of Opinion • Persistence of Discredited Beliefs • Preference for Early Information • Illusory Association Between Events
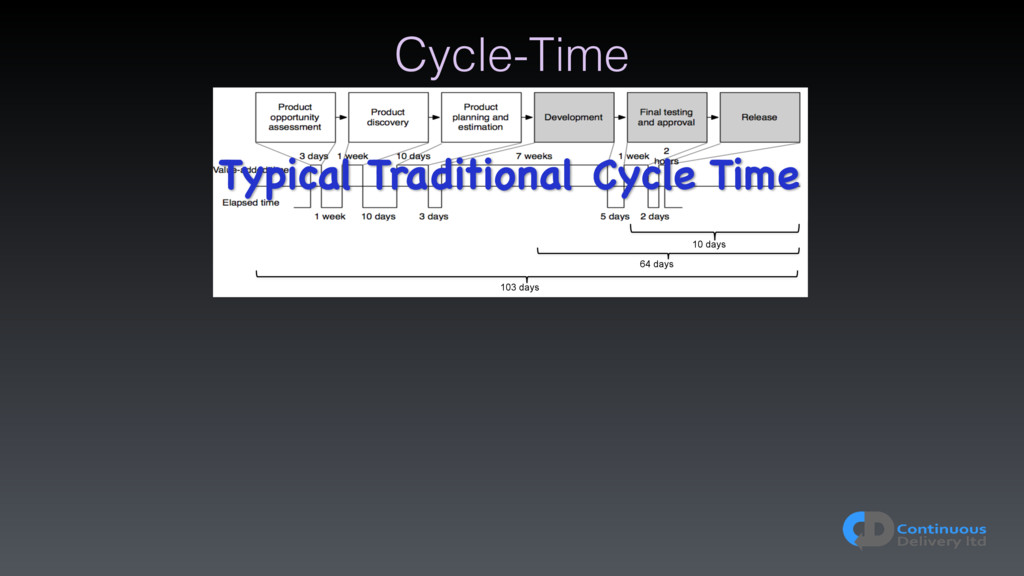
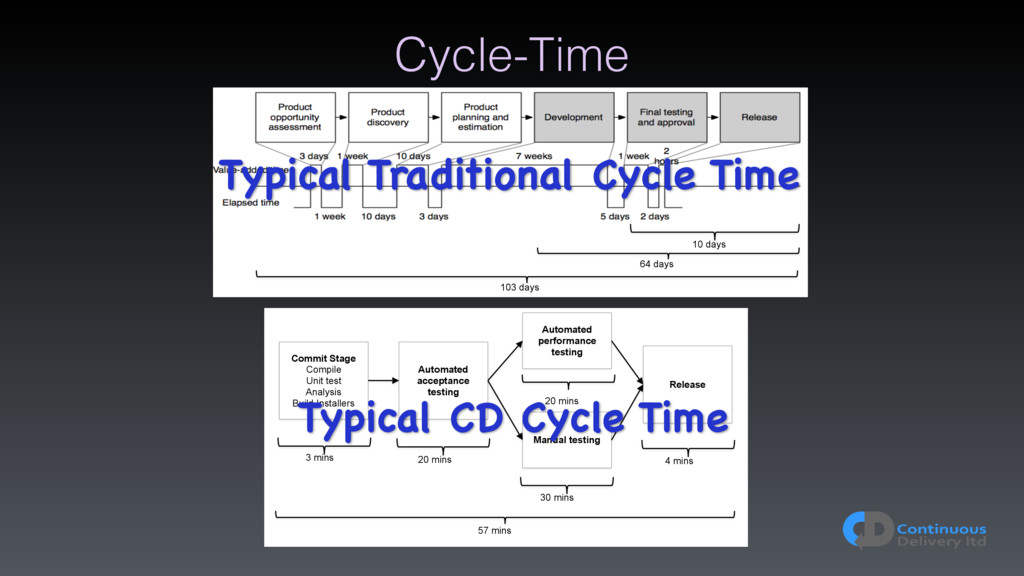
acceptance testing Automated performance testing Manual testing Release 57 mins 3 mins 20 mins 20 mins 30 mins 4 mins Typical CD Cycle Time 103 days Typical Traditional Cycle Time 10 days 64 days
the customer through early and continuous delivery of valuable software.” The first principle of the agile manifesto. The logical extension of continuous integration. A holistic approach to development. Every commit creates a release candidate. Finished means released into production!
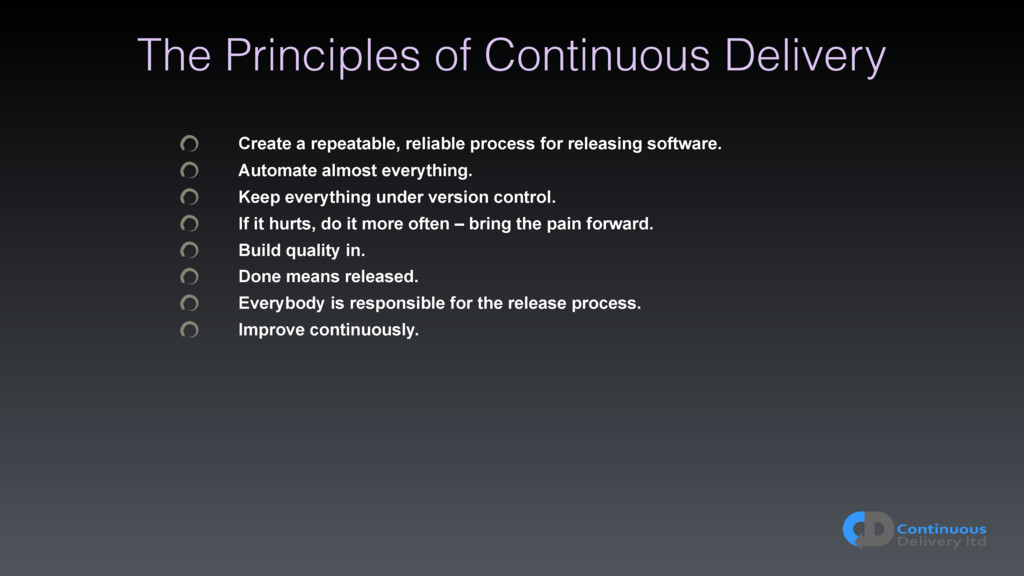
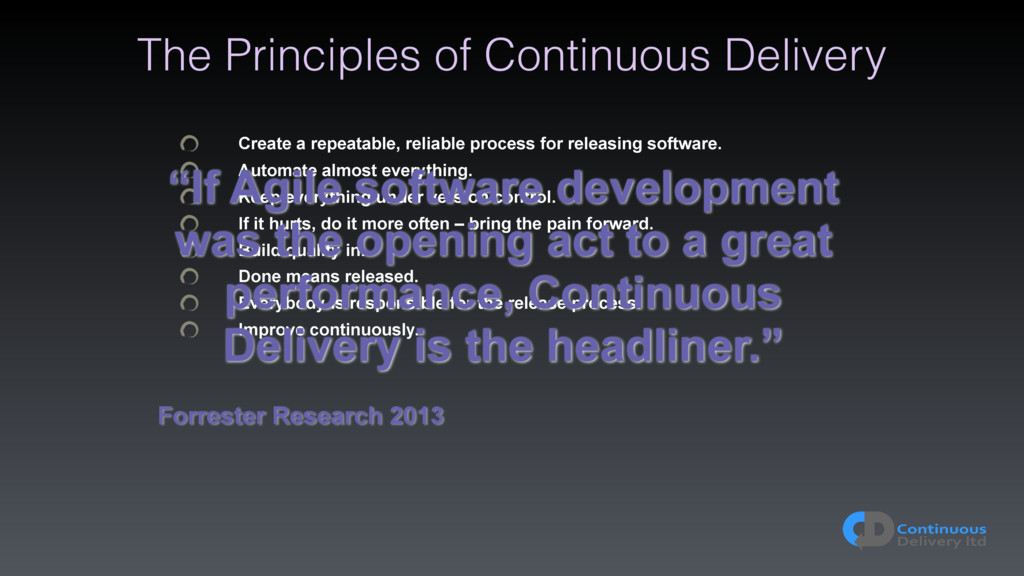
for releasing software. Automate almost everything. Keep everything under version control. If it hurts, do it more often – bring the pain forward. Build quality in. Done means released. Everybody is responsible for the release process. Improve continuously.
for releasing software. Automate almost everything. Keep everything under version control. If it hurts, do it more often – bring the pain forward. Build quality in. Done means released. Everybody is responsible for the release process. Improve continuously. “If Agile software development was the opening act to a great performance, Continuous Delivery is the headliner.” Forrester Research 2013
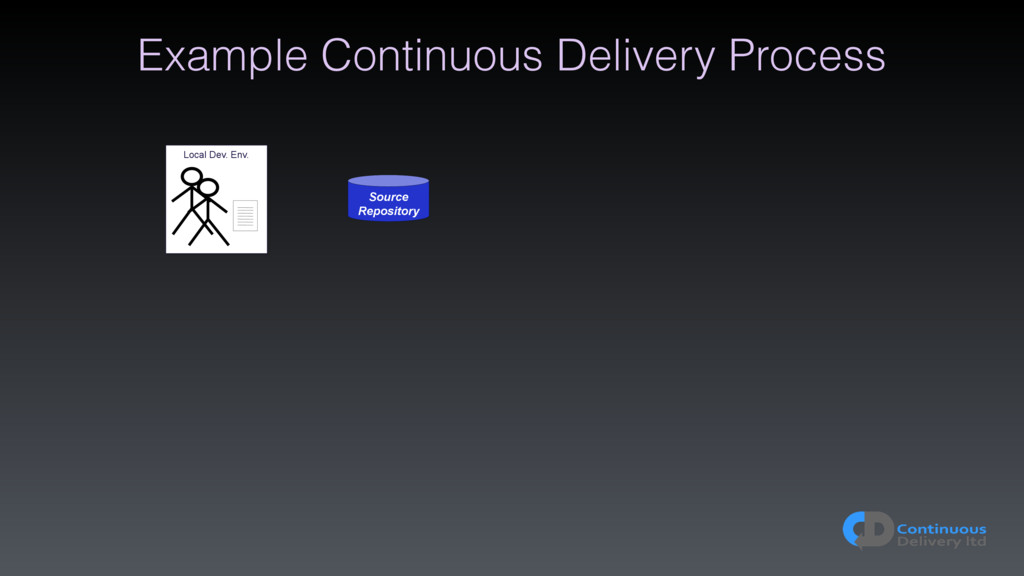
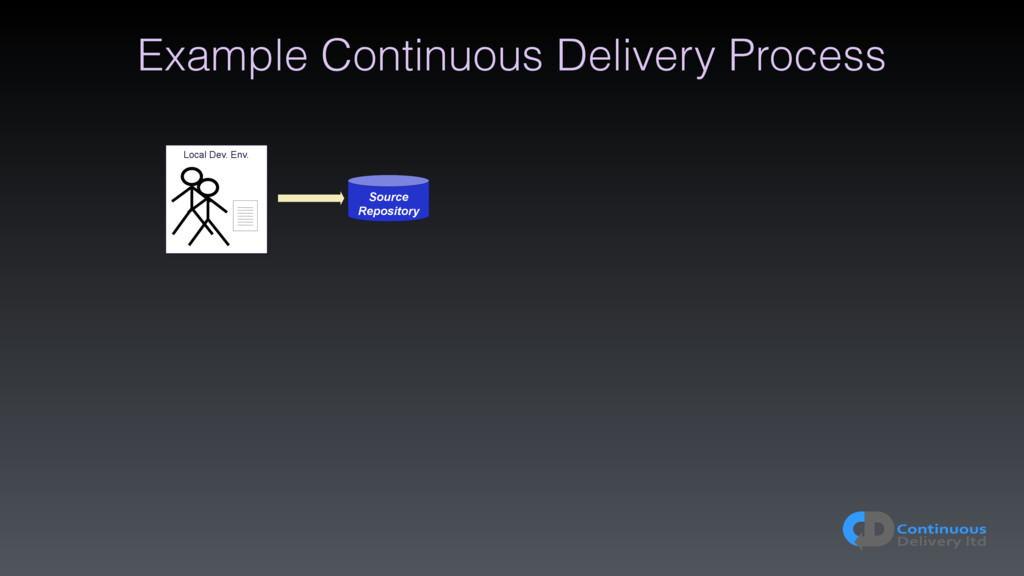
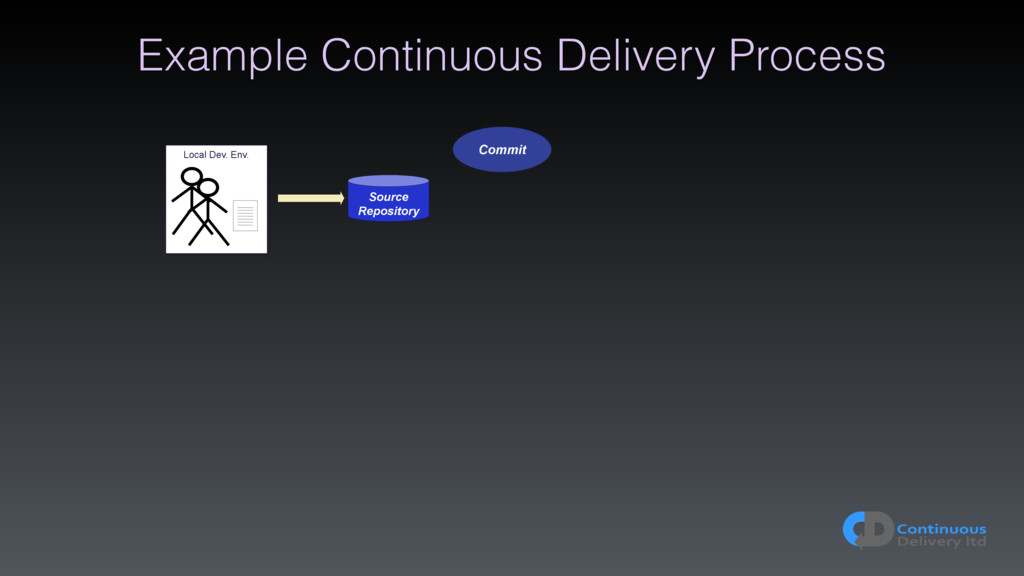
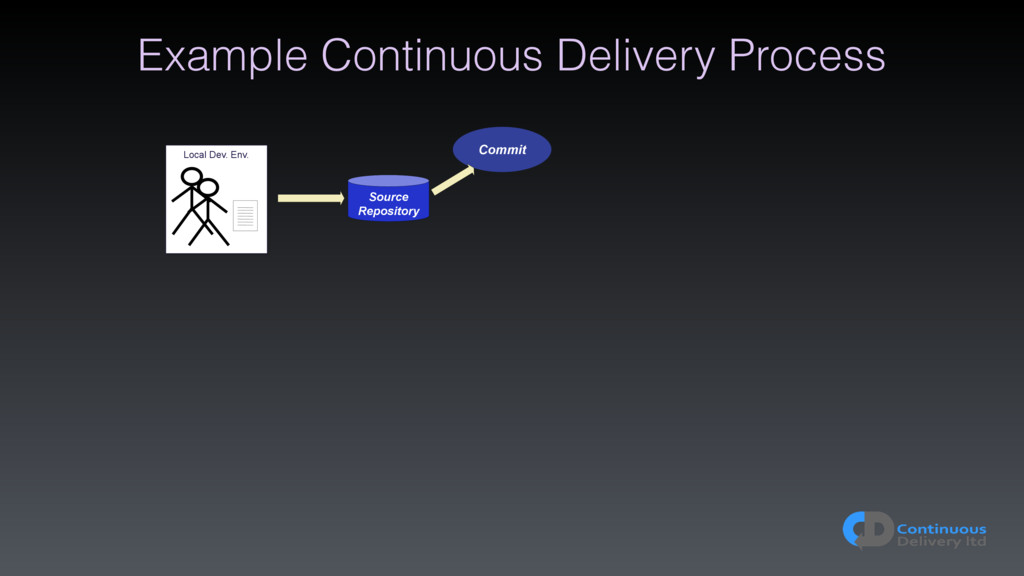
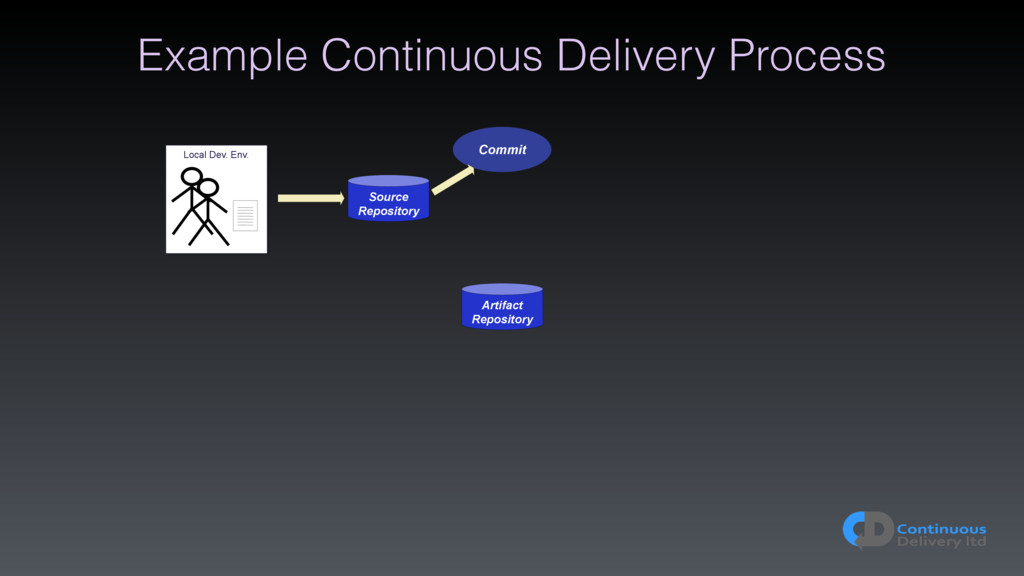
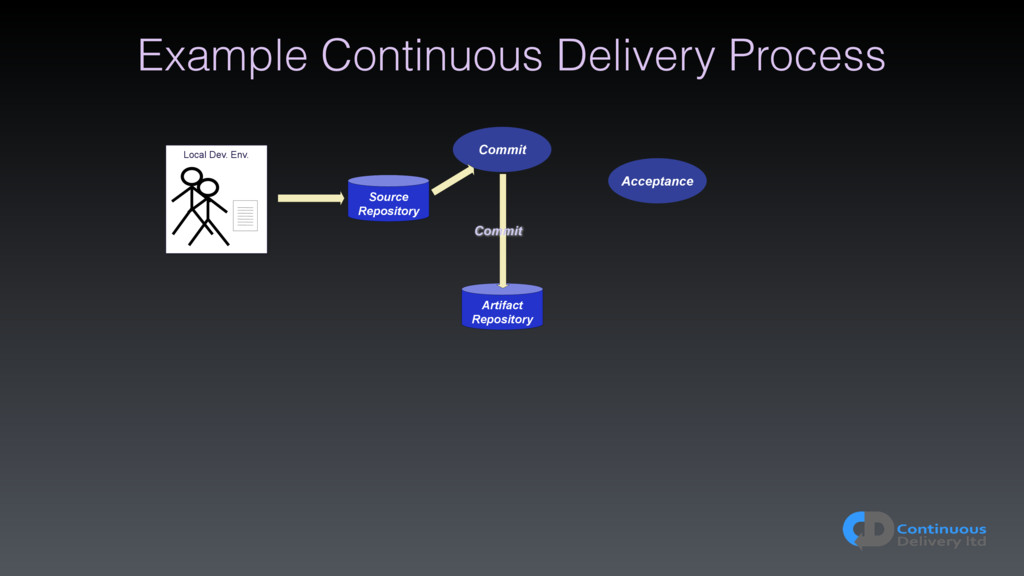
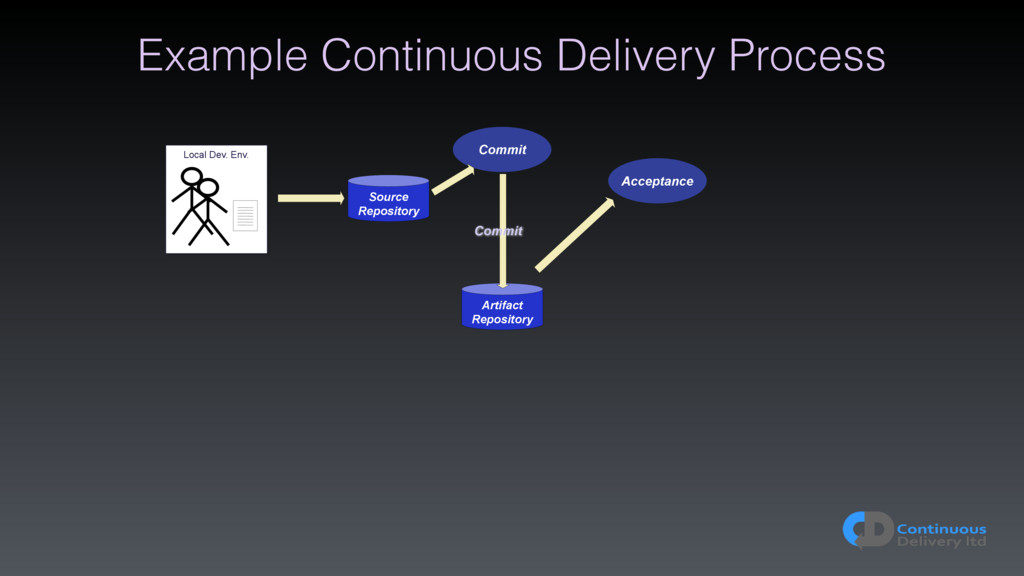
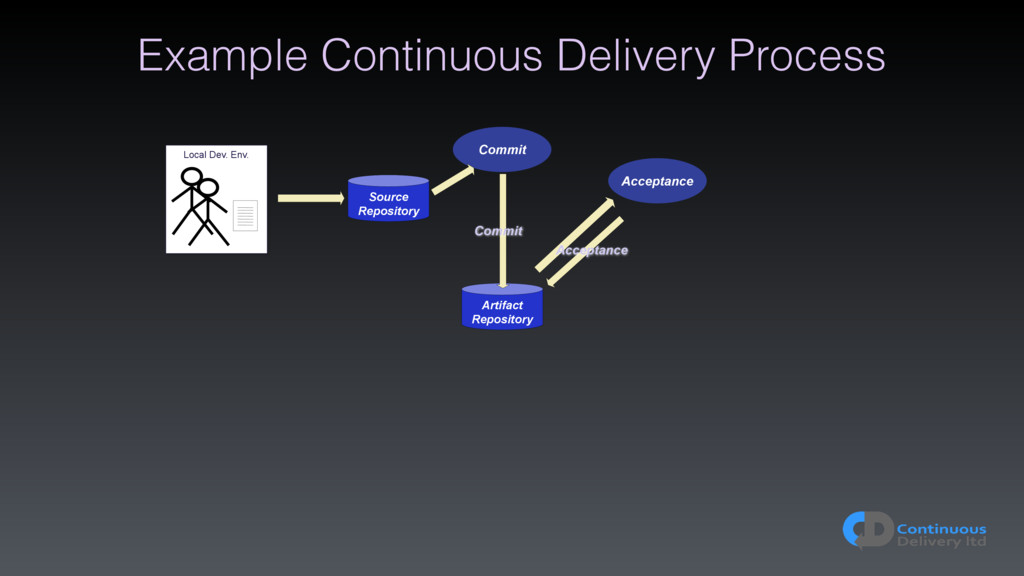
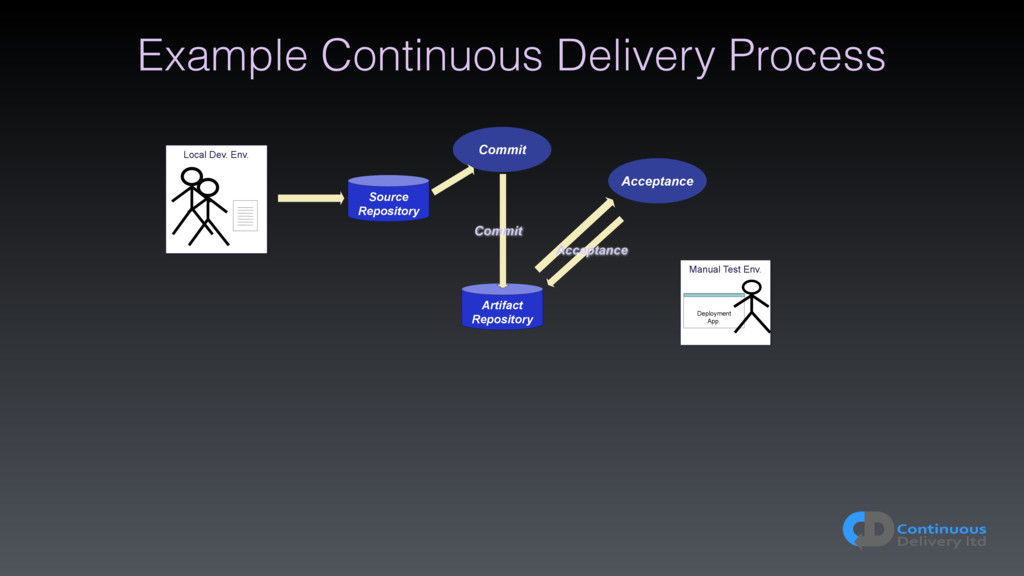
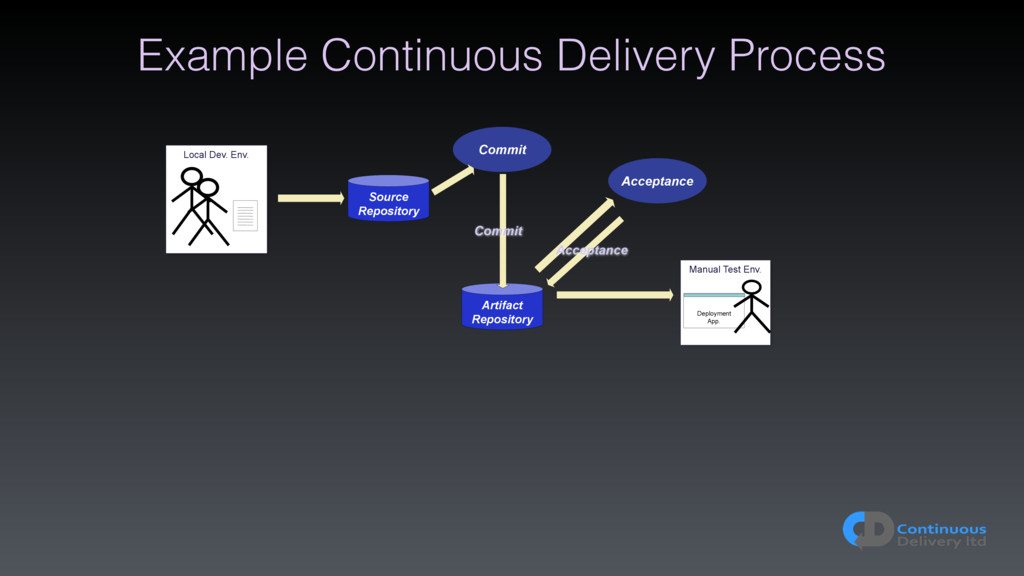
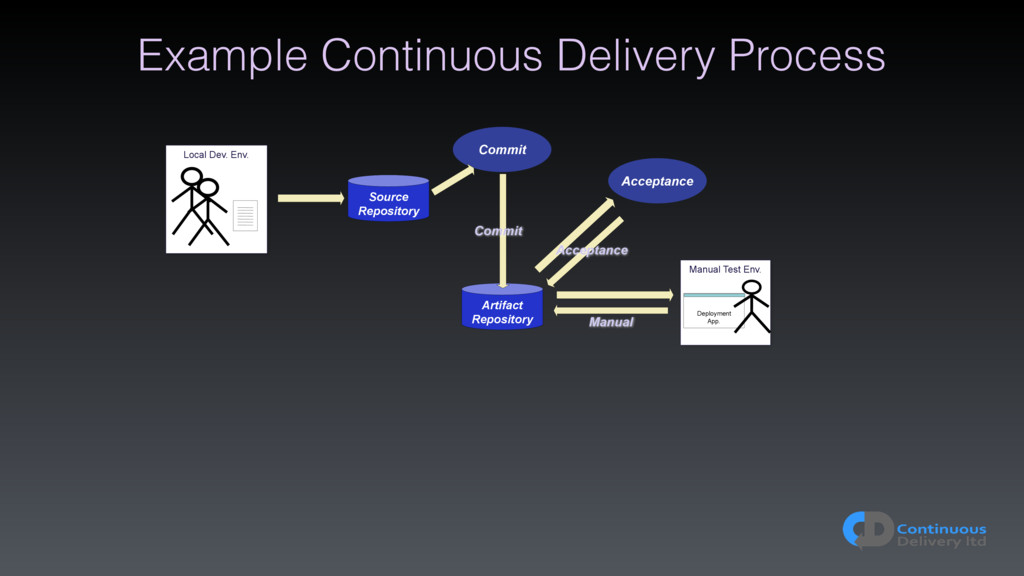
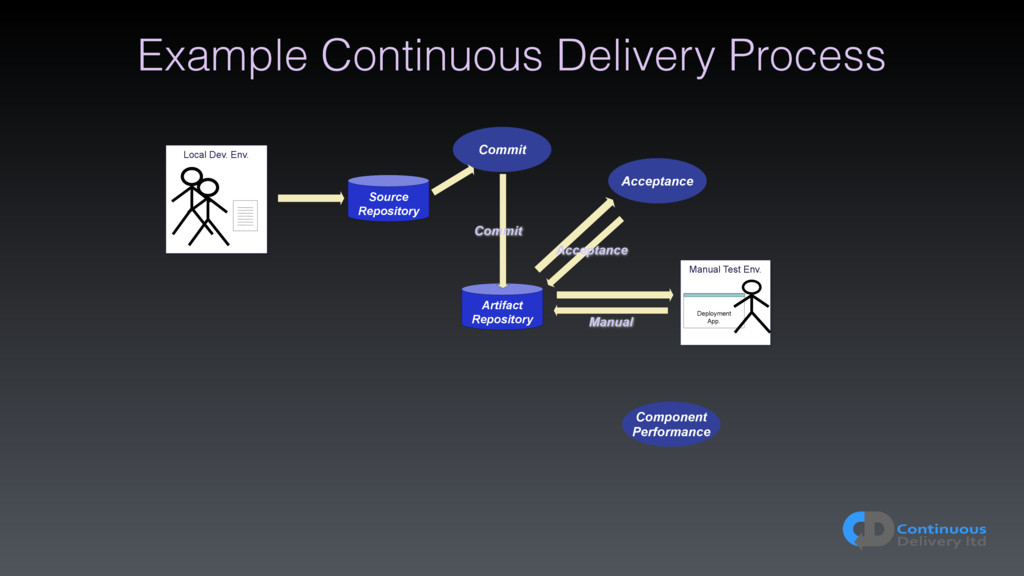
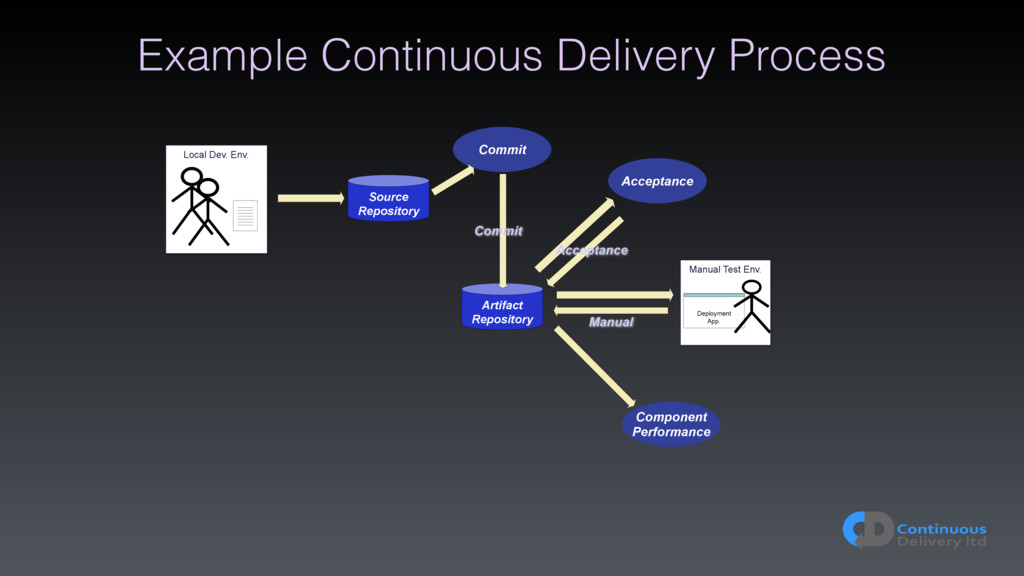
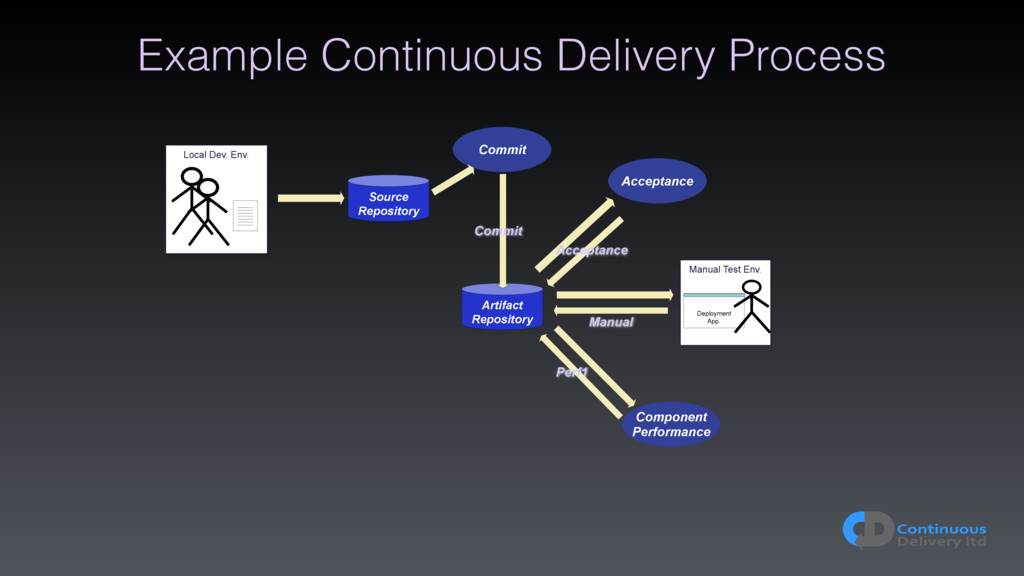
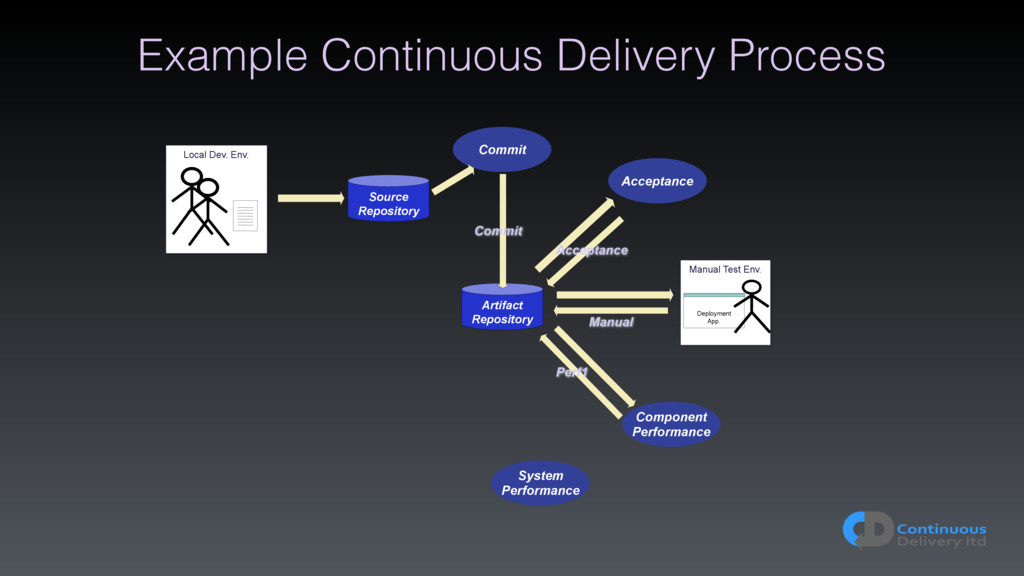
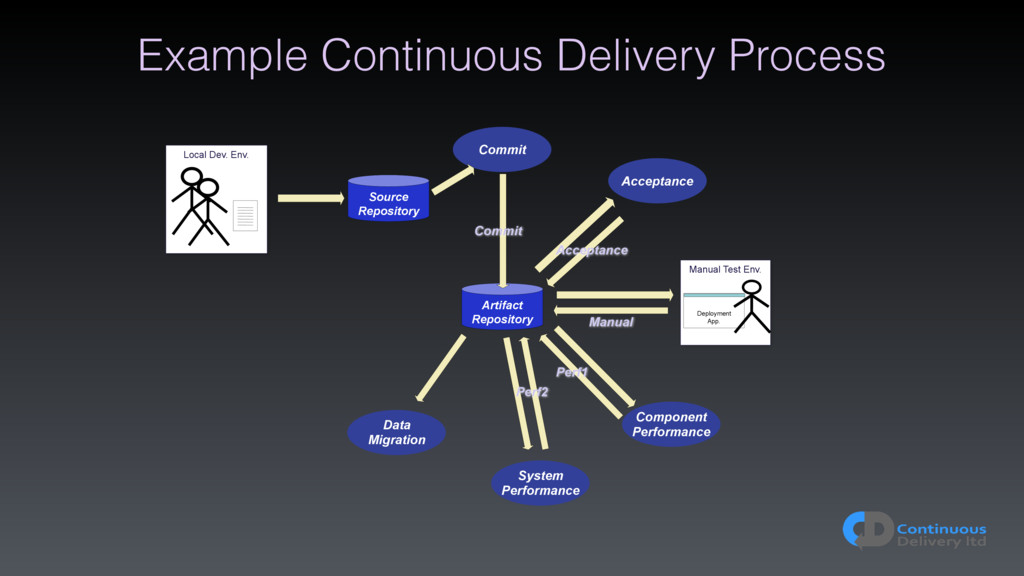
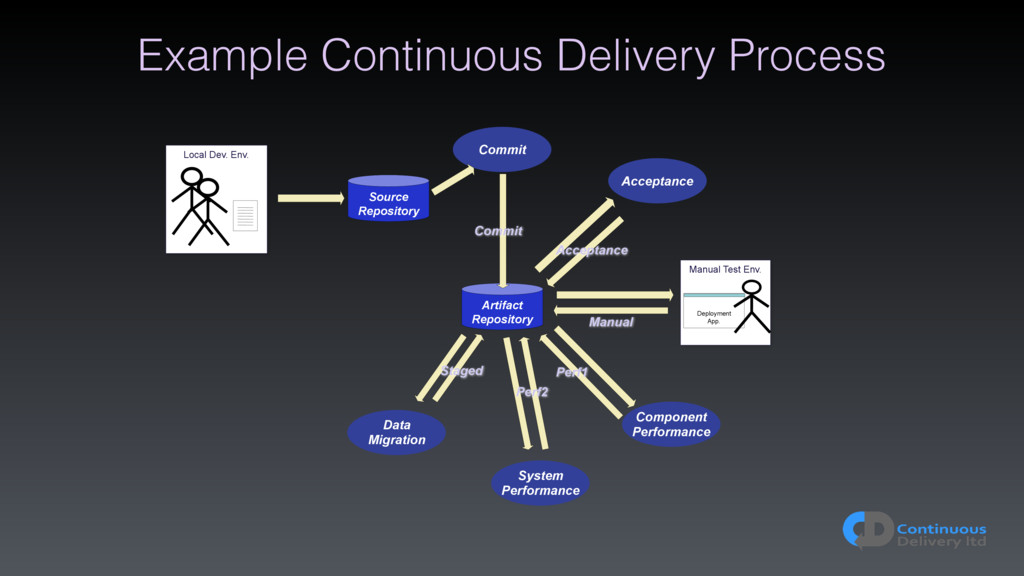
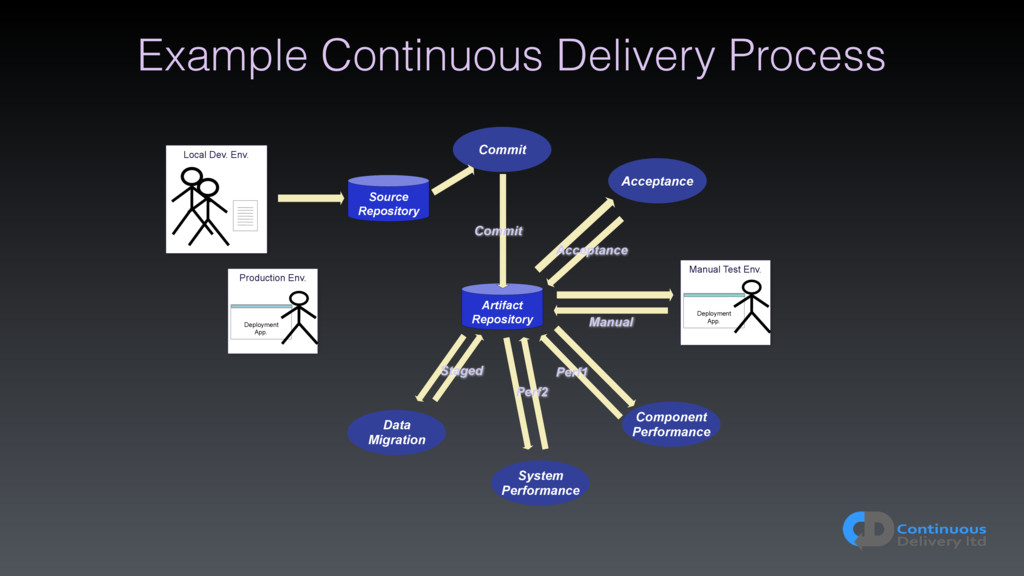
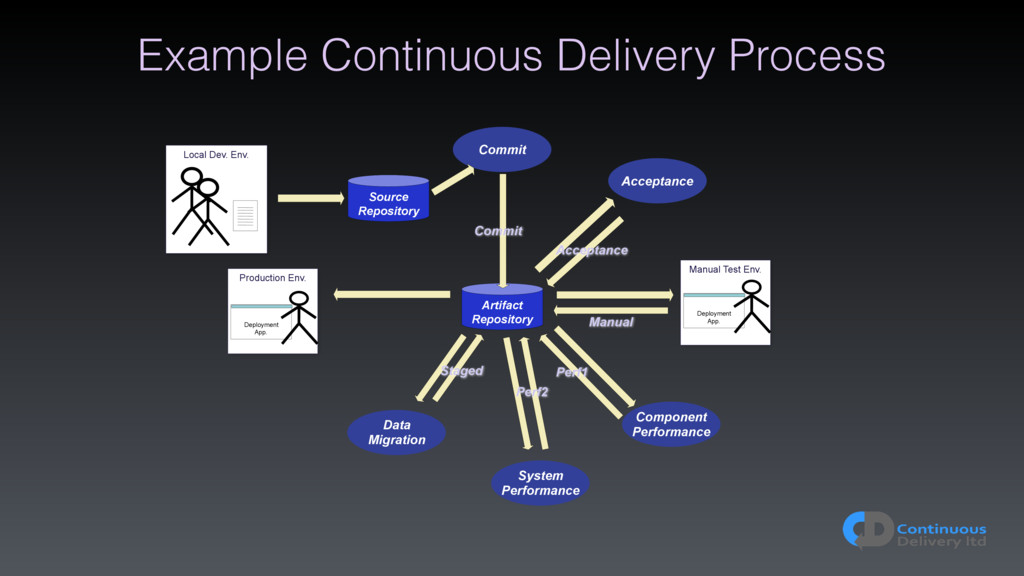
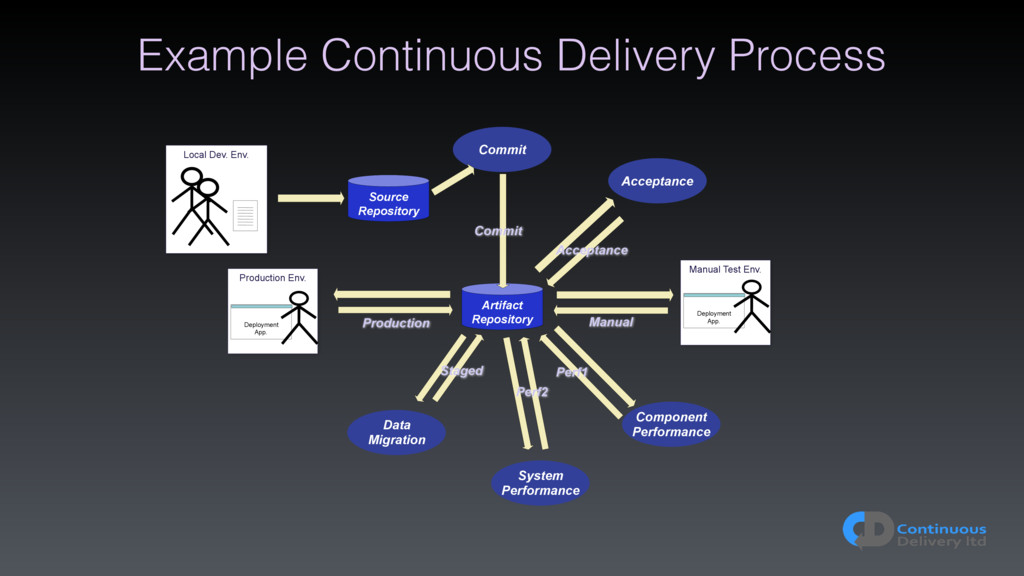
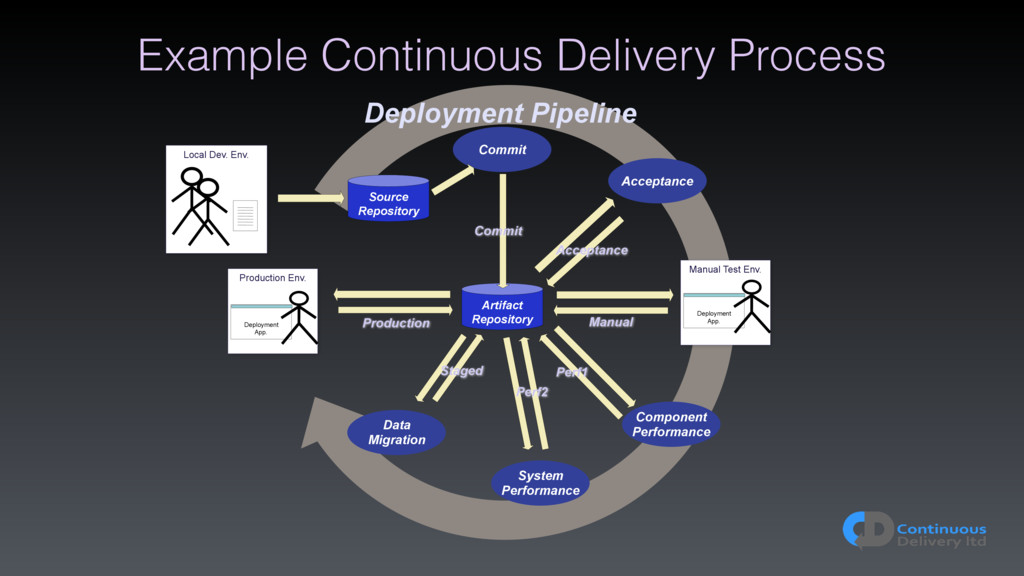
Commit Component Performance System Performance Production Env. Deployment App. Commit Acceptance Manual Perf1 Perf2 Staged Production Source Repository Manual Test Env. Deployment App. Data Migration
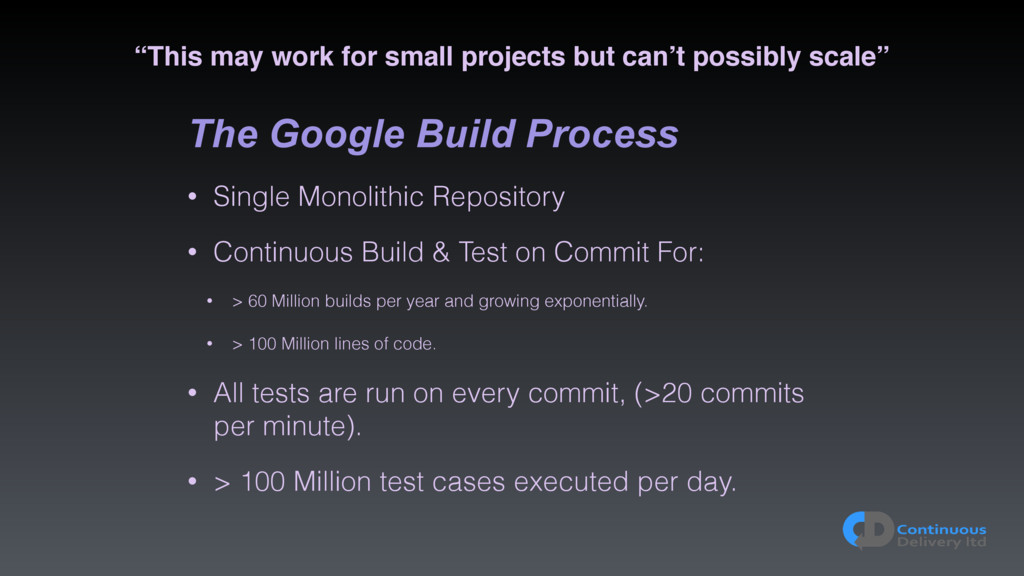
The Google Build Process • Single Monolithic Repository • Continuous Build & Test on Commit For: • > 60 Million builds per year and growing exponentially. • > 100 Million lines of code. • All tests are run on every commit, (>20 commits per minute). • > 100 Million test cases executed per day.
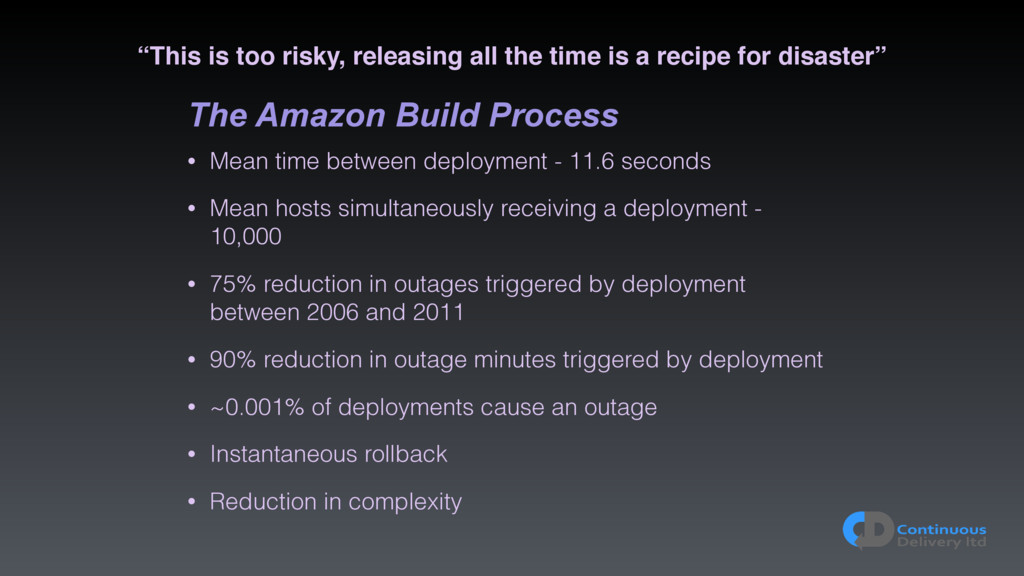
recipe for disaster” The Amazon Build Process • Mean time between deployment - 11.6 seconds • Mean hosts simultaneously receiving a deployment - 10,000 • 75% reduction in outages triggered by deployment between 2006 and 2011 • 90% reduction in outage minutes triggered by deployment • ~0.001% of deployments cause an outage • Instantaneous rollback • Reduction in complexity
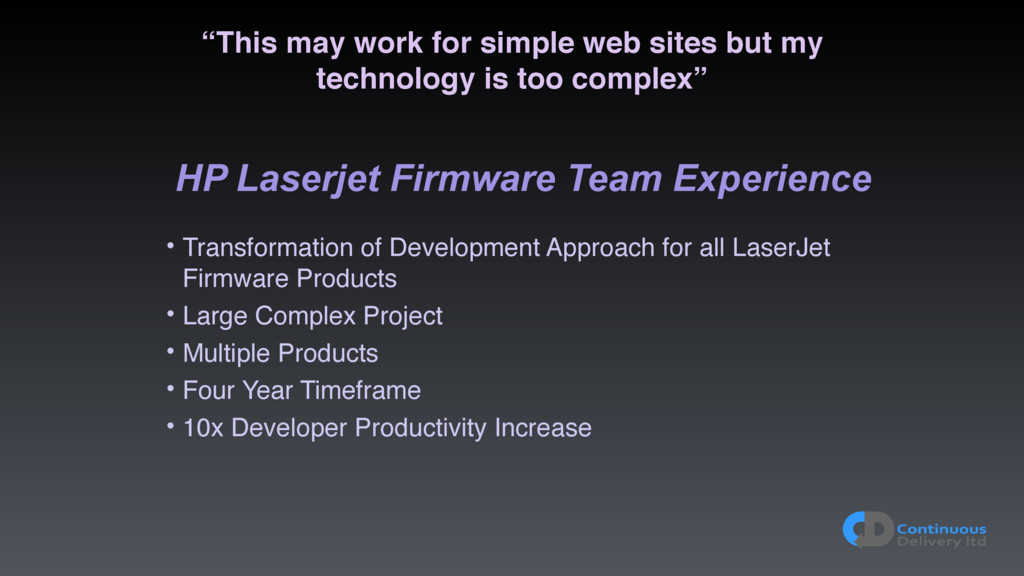
is too complex” • Transformation of Development Approach for all LaserJet Firmware Products • Large Complex Project • Multiple Products • Four Year Timeframe • 10x Developer Productivity Increase HP Laserjet Firmware Team Experience
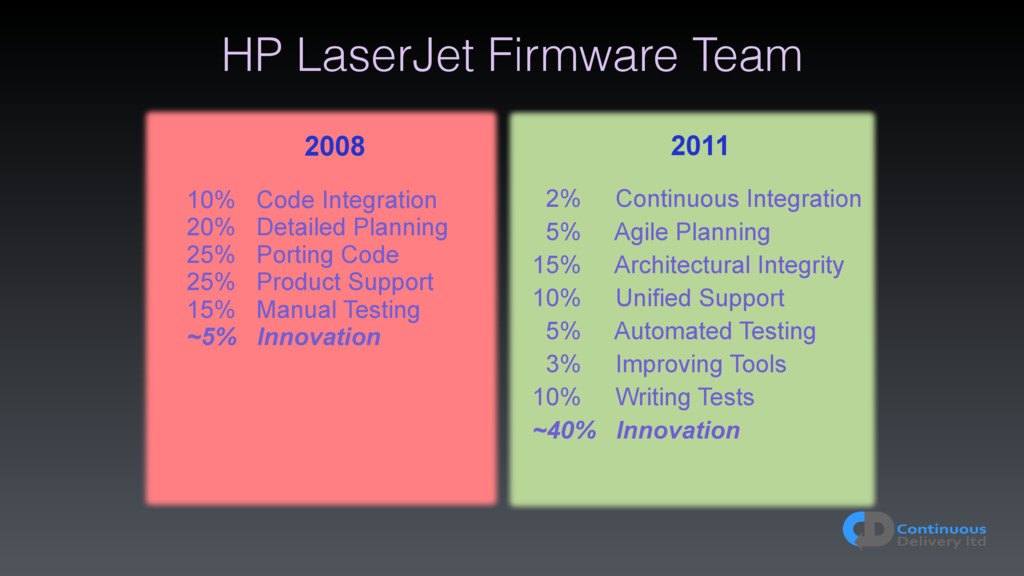
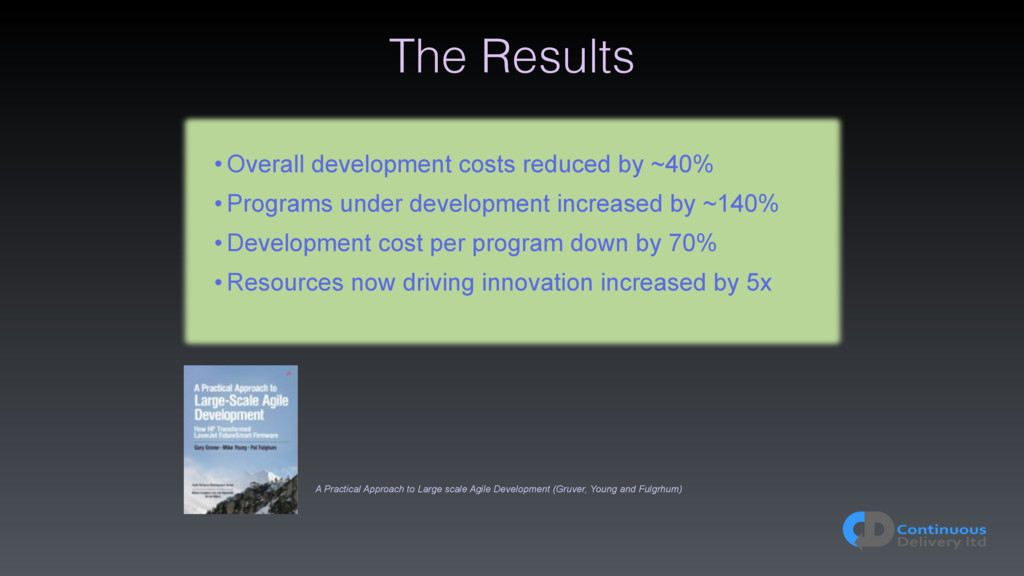
(Gruver, Young and Fulgrhum) • Overall development costs reduced by ~40% • Programs under development increased by ~140% • Development cost per program down by 70% • Resources now driving innovation increased by 5x
changes the economics of software delivery. • 87% of companies whose development & operations functions were rated as “excellent” saw revenue growth > 10% in 20131 • In contrast, 13% of companies whose development & operations functions were rated “average” or worse saw similar growth. • 8x more frequent production deployments • 8000x faster deployment lead times (i.e., time required from “code committed” to “successfully running in production”) • 50% lower change failure rates Source: 1"DevOps and Continuous Delivery: Ten Factors Shaping the Future of Application Delivery.”, Enterprise Management Associates’ Report (2014)
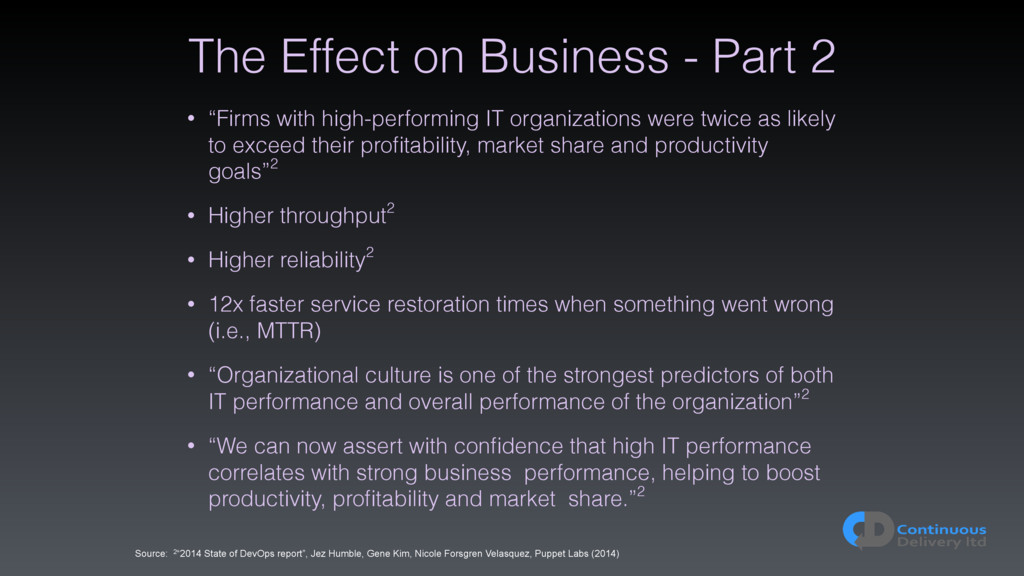
high-performing IT organizations were twice as likely to exceed their profitability, market share and productivity goals”2 • Higher throughput2 • Higher reliability2 • 12x faster service restoration times when something went wrong (i.e., MTTR) • “Organizational culture is one of the strongest predictors of both IT performance and overall performance of the organization”2 • “We can now assert with confidence that high IT performance correlates with strong business performance, helping to boost productivity, profitability and market share.”2 Source: 2“2014 State of DevOps report”, Jez Humble, Gene Kim, Nicole Forsgren Velasquez, Puppet Labs (2014)


 saec
saec
 ivry_presentationmaterials
 occhi
occhi
 codmoninc
 endonanana
 koukihosaka
 persolserverworks
 masakiokuda
 yamanoku
 tomokusaba
 moznion
 ueponx
 chriscoyier
 codingconduct
 auna
auna
 letsgokoyo
 mlcsv
mlcsv
 thirion
 addyosmani
 aleyda
 keavy
keavy
 philnash