Upgrade to Pro — share decks privately, control downloads, hide ads and more …

Node.js Memory Leaks - Sasha Goldshtein

Node.js Memory Leaks - Sasha Goldshtein

Avatar for Sela Developer Meetup

Sela Developer Meetup

April 25, 2018
Tweet

More Decks by Sela Developer Meetup

Other Decks in Technology

Transcript

  1. Node.js GC Internals V8 heap New-space To-space From-space Next object

    Old-pointer-space Old-data-space Large-object-space Code-space Cell, property, and map-spaces Promotion Promotion
  2. GC-Related Problems 1. Memory leaks occur when objects are unintentionally

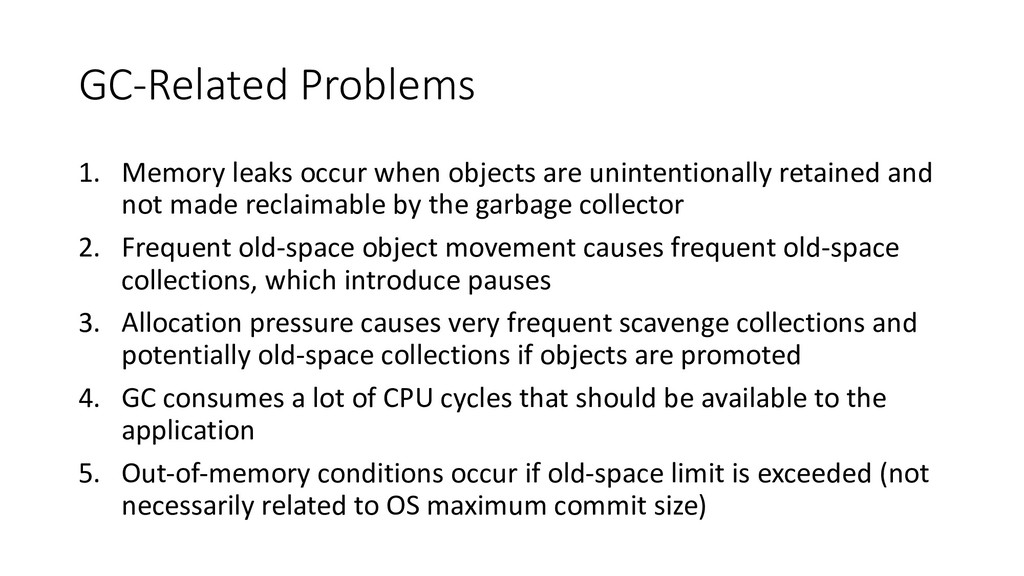
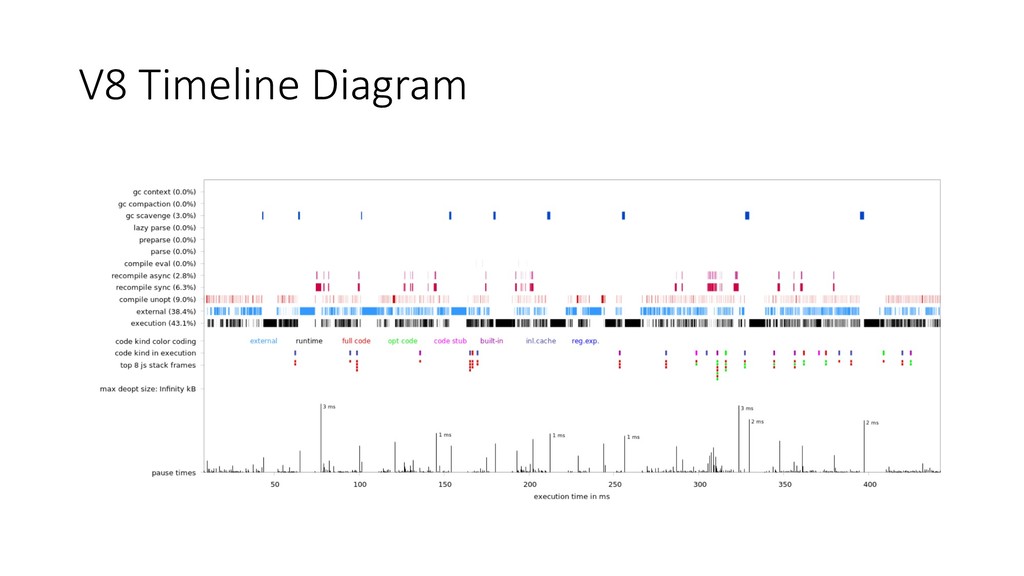
    retained and not made reclaimable by the garbage collector 2. Frequent old-space object movement causes frequent old-space collections, which introduce pauses 3. Allocation pressure causes very frequent scavenge collections and potentially old-space collections if objects are promoted 4. GC consumes a lot of CPU cycles that should be available to the application 5. Out-of-memory conditions occur if old-space limit is exceeded (not necessarily related to OS maximum commit size)
  3. GC Monitoring • Tracing command line options: • --trace-gc, --trace-gc-verbose

    GC tracking information • --trace-fragmentation Heap fragmentation tracking • In-process heap monitoring: • process.memoryUsage() • v8.getHeapStatistics(), getHeapSpaceStatistics() In v6.0.0 • Profiling coalesced with GC: • --prof --log-timer-events Produces isolate-nnnnn.log • d8/plot-timer-events Produces a timeline diagram • Allocation stack tracing: • --trace-allocation-stack-interval=N Sample each Nth alloc
  4. Common Node.js Memory Leaks • Out-of-control caches with no invalidation

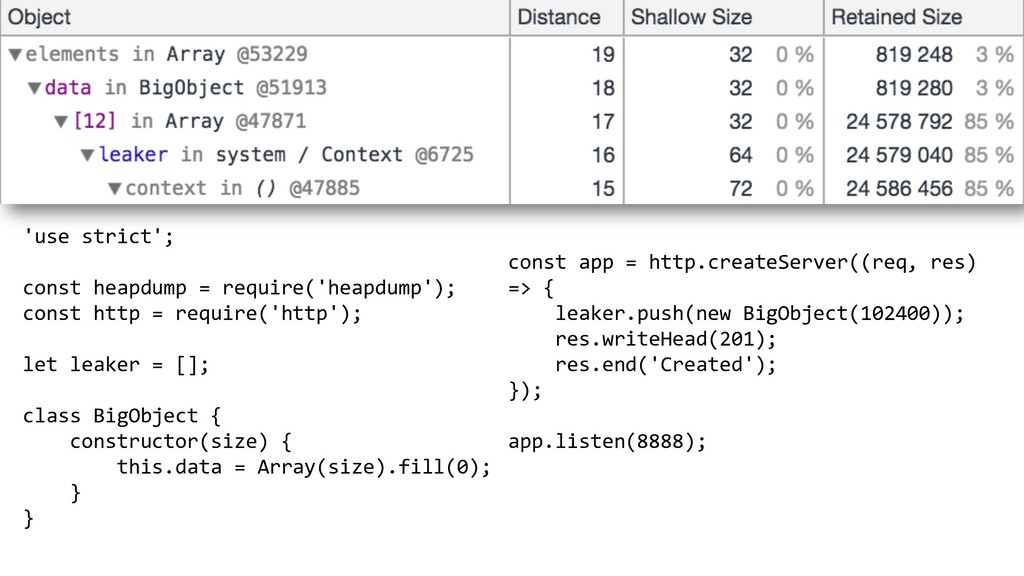
    policies • Unneeded references from observers or callbacks • Especially common with timers, e.g. setInterval callback that needs access to a large cache of objects • Infinite lists of closures [Meteor issue]
  5. Memory Leak Analysis Process 1. Ascertain that there is a

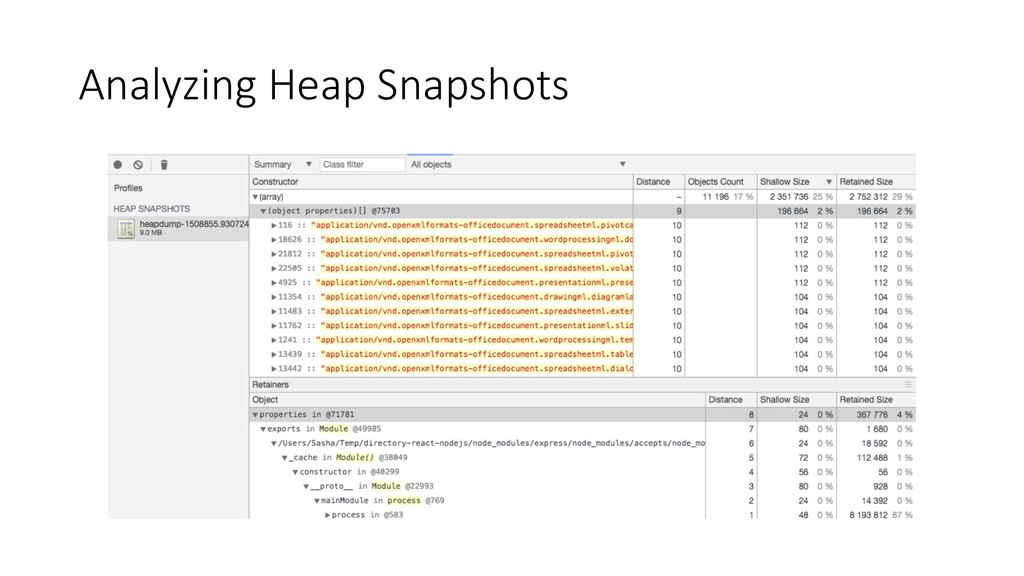
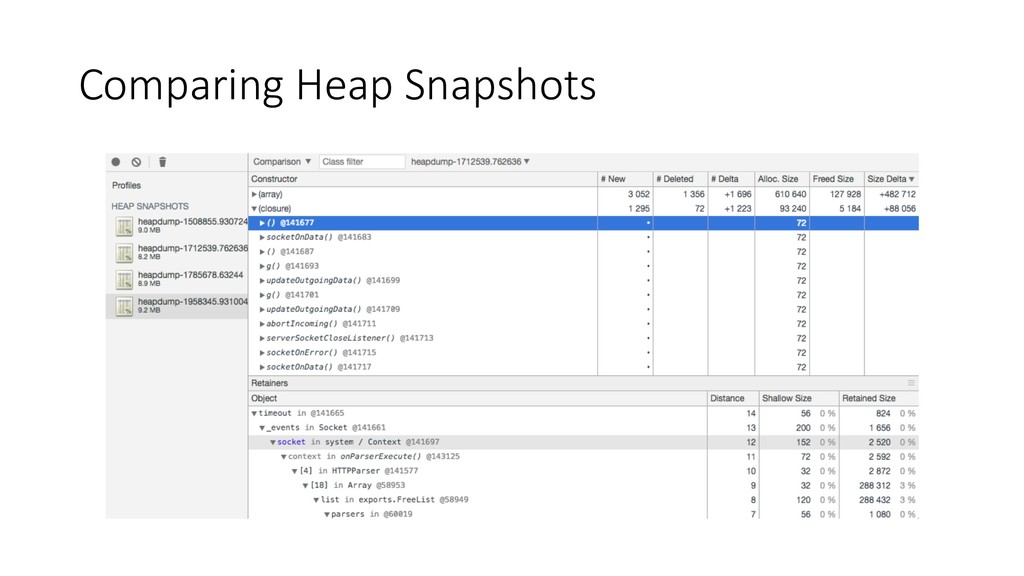
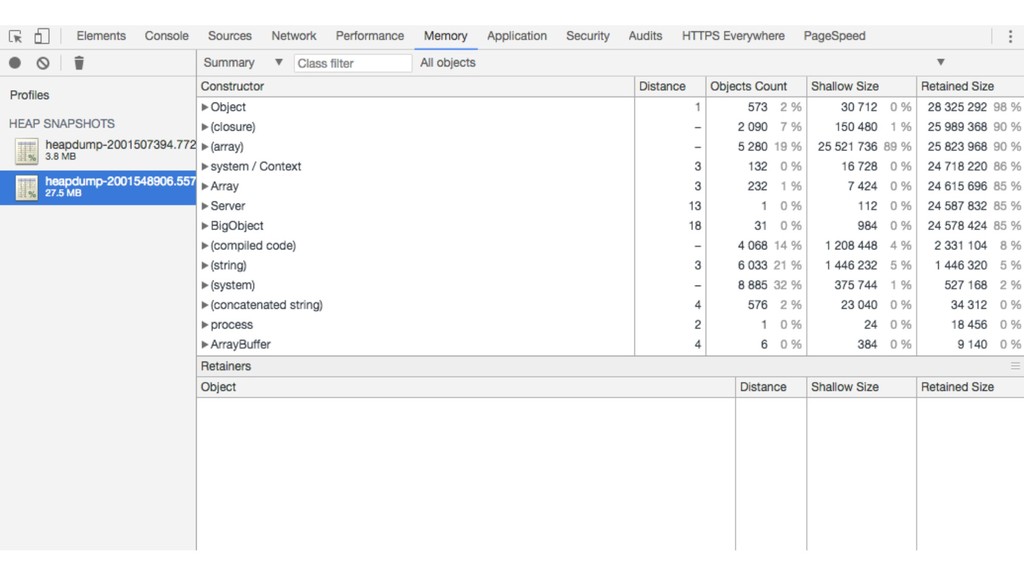
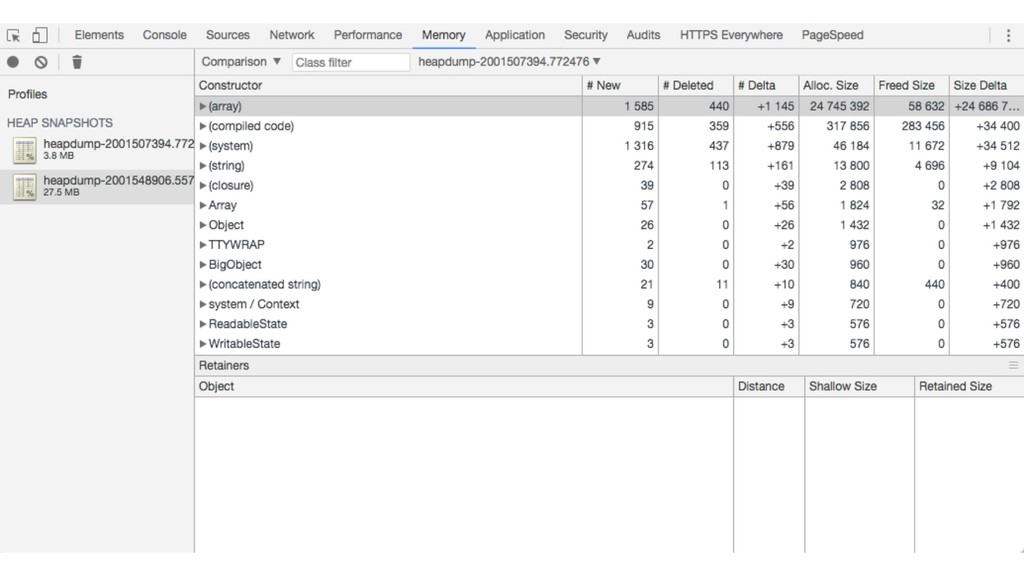
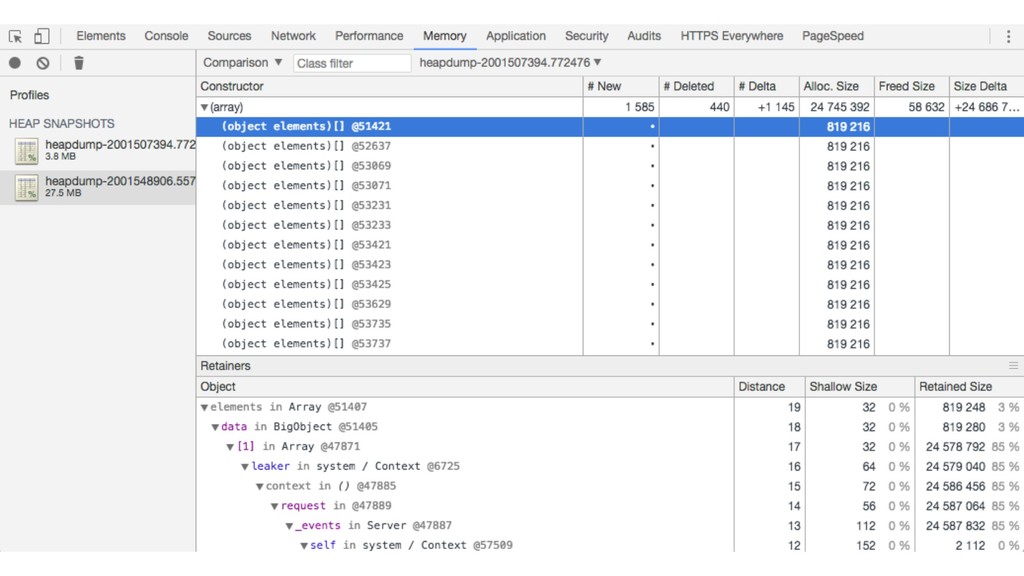
    memory leak Sweep (vs. compact) or low GC rates can mislead you into thinking there is a leak when there isn’t one 2. Capture multiple heap snapshots over time A heap snapshot contains heap objects and references between them 3. Find the delta between consecutive snapshots Which objects are being added to the heap and not removed? 4. Determine why the extraneous objects are not freed Which reference chain is responsible for retaining these objects?
  6. Heap Snapshots • To capture heap snapshots without core dumps,

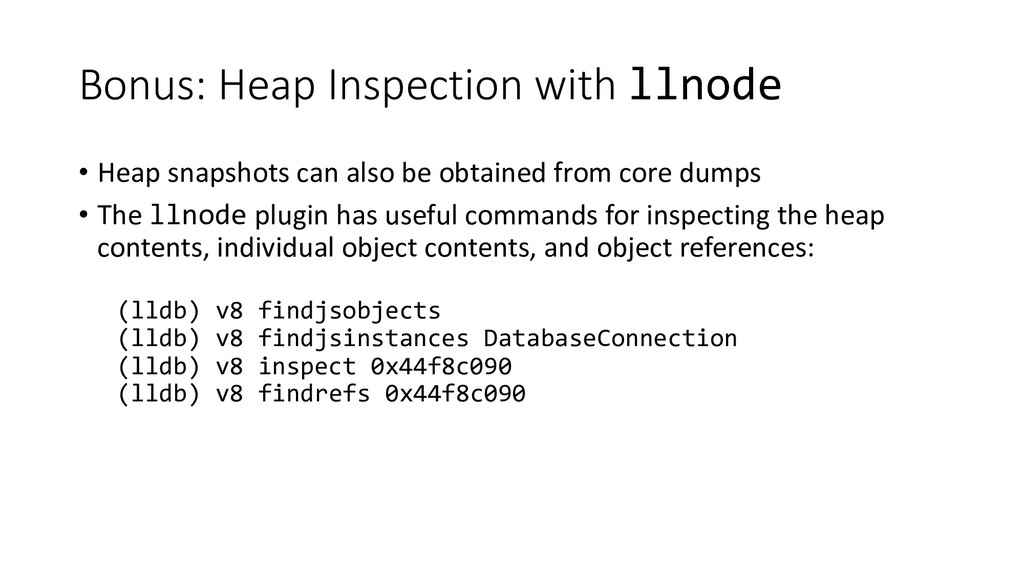
    use the v8-profiler module or the heapdump module • v8prof.takeSnapshot().export(…) • heapdump.writeSnapshot() • Can trigger snapshots on SIGUSR2 (kill -USR2 `pidof node`) • Snapshots are simple JSON documents with all the nodes and edges in the heap • Can also use memwatch to get an automatic snapshot diff from within the process
  7. 'use strict'; const heapdump = require('heapdump'); const http = require('http');

    let leaker = []; class BigObject { constructor(size) { this.data = Array(size).fill(0); } } const app = http.createServer((req, res) => { leaker.push(new BigObject(102400)); res.writeHead(201); res.end('Created'); }); app.listen(8888);
  8. Bonus: Heap Inspection with llnode • Heap snapshots can also

    be obtained from core dumps • The llnode plugin has useful commands for inspecting the heap contents, individual object contents, and object references: (lldb) v8 findjsobjects (lldb) v8 findjsinstances DatabaseConnection (lldb) v8 inspect 0x44f8c090 (lldb) v8 findrefs 0x44f8c090