‘x’ days of trading data and average it out. They help smooth price action and filter out the noise. • So a 200 day MA = sum of last 200 days worth day/200. • Simple right? Yup, its just too simple. Wednesday, May 8, 13
as they rely on past data - cant be used for short term trading. • MAs by themselves are too simplistic for today’s markets. MAs by themselves provide no reliable indicator of a trend and must be coupled with other trend following techniques. Not a good first step. Wednesday, May 8, 13
exponentially more reactive to market trends and hence they are a great way to do pick up trends and trading signals. • EMAs are a good enough first step for trend following. Wednesday, May 8, 13
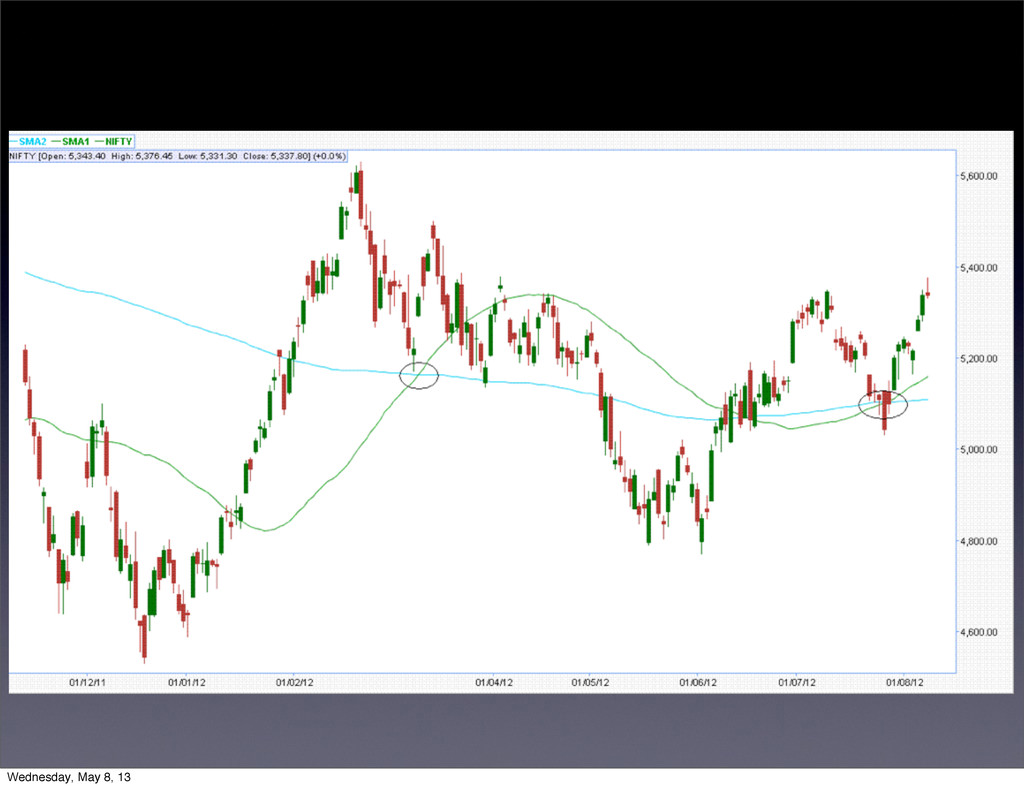
take 2 EMAs. One long, one short. Wait for them to crossover at a point, called the Golden Crossover in trading. • The Golden Crossover is a perfect place to execute a trade as they signal the beginning of an upward or a downward trend. Wednesday, May 8, 13
worth of historical data from Mt.Gox and calculate EMA upto the latest hour. • To use EMAs to find a golden crossover...and since the Bitcoin markets are volatile, to put it politely, we use a backup strategy that prevents mad buying and selling. Using thresholds for trade. Wednesday, May 8, 13
only if the difference between EMA(long) - EMA(short) is above a threshold. If the market is too volatile a lot of crossovers could occur and fuck us over. This strategy saves our asses always. Its called a Bollinger Band. Wednesday, May 8, 13
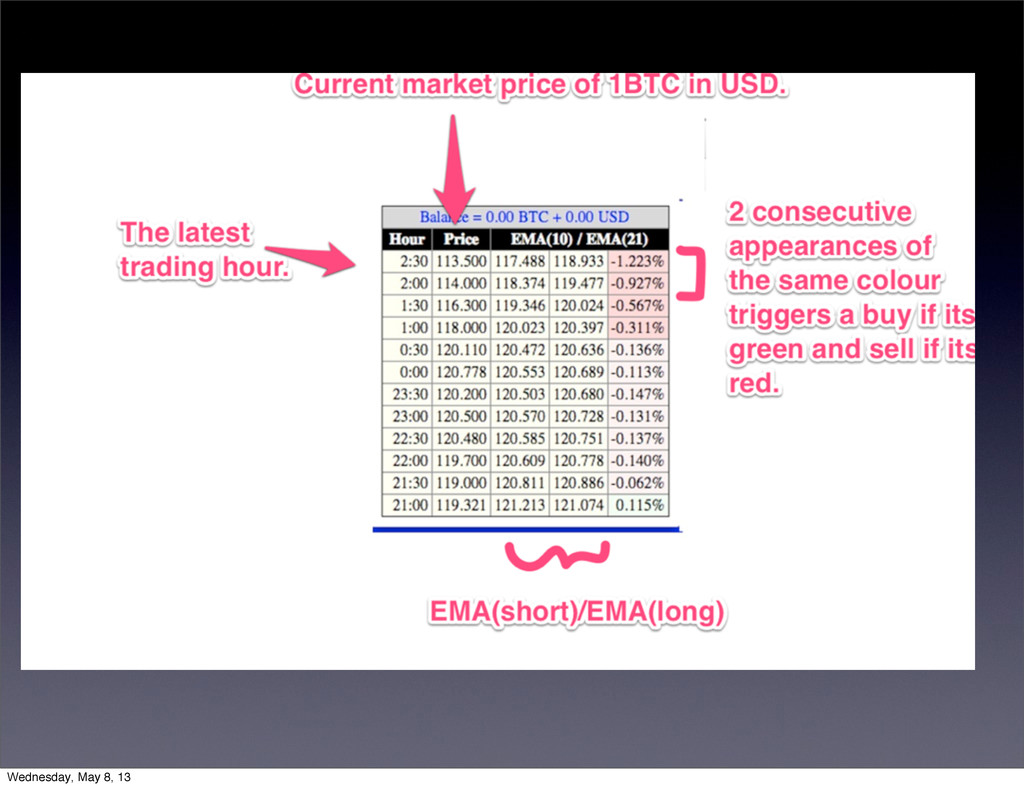
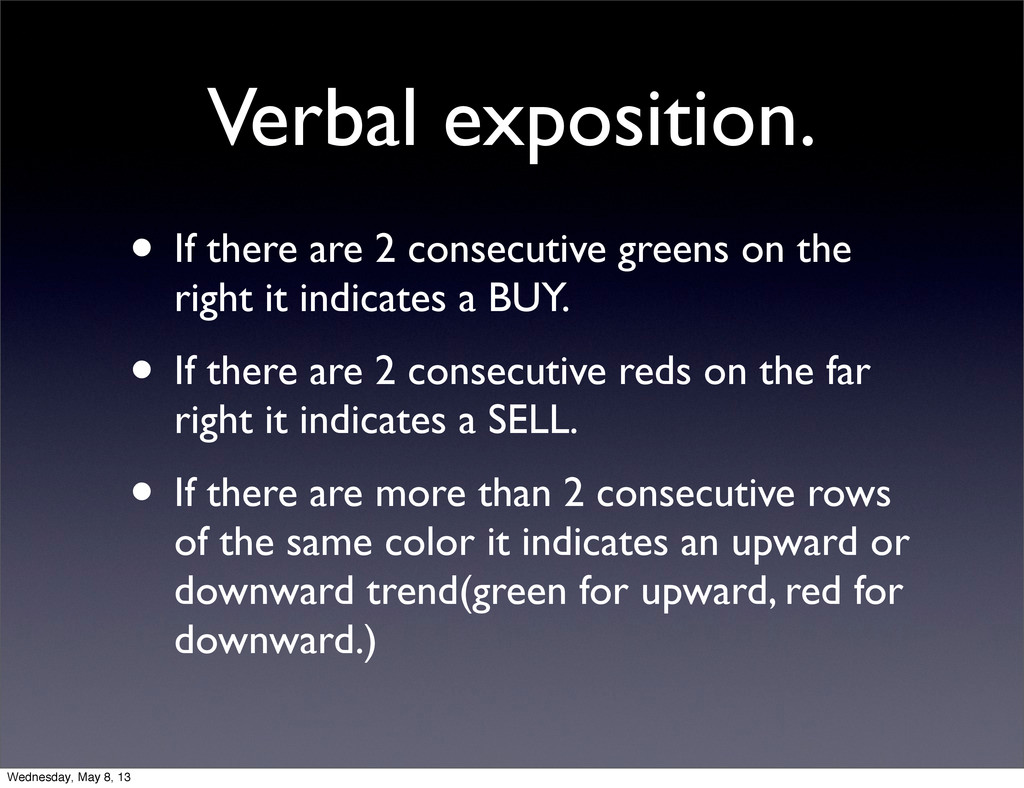
the right it indicates a BUY. • If there are 2 consecutive reds on the far right it indicates a SELL. • If there are more than 2 consecutive rows of the same color it indicates an upward or downward trend(green for upward, red for downward.) Wednesday, May 8, 13
the number past entries to study trends. • Making the EMA values shorter will trigger more crossovers and vice versa. • Making the threshold smaller will lead to more BUY/SELL calls. Not healthy unless you drink Felix Felicis or you’ve a lot of money to splash around. Wednesday, May 8, 13
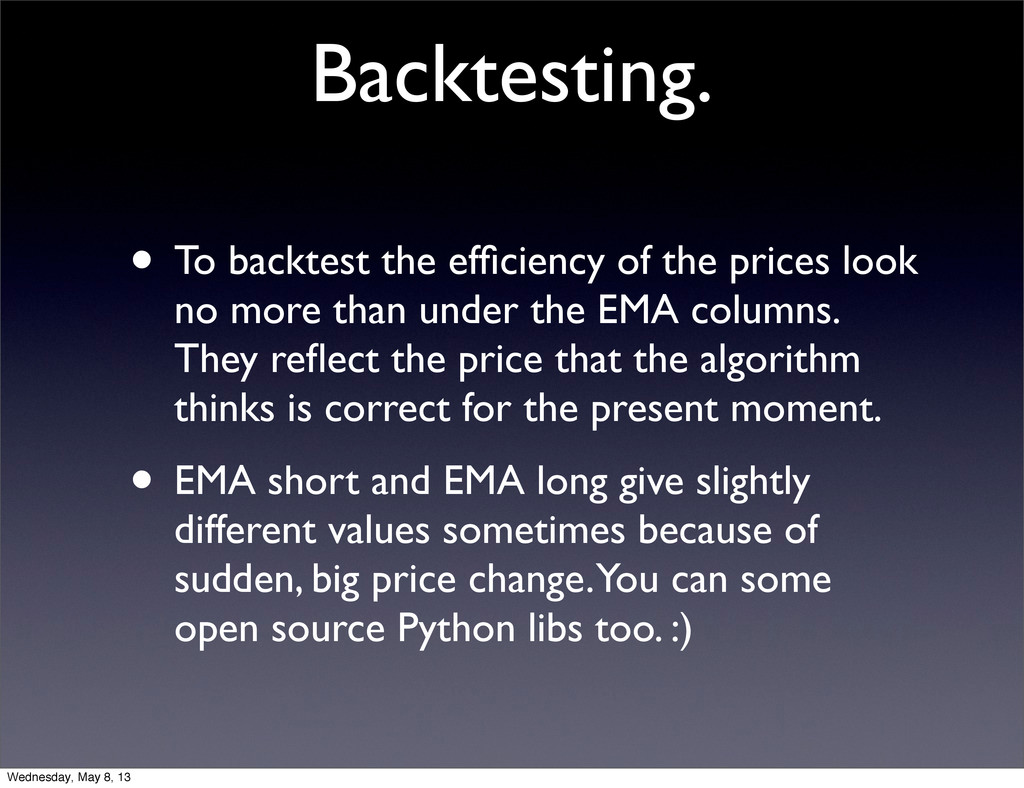
no more than under the EMA columns. They reflect the price that the algorithm thinks is correct for the present moment. • EMA short and EMA long give slightly different values sometimes because of sudden, big price change. You can some open source Python libs too. :) Wednesday, May 8, 13


 marcoroth
 mixplace
 gonta
 akihisaikeda
 siroemk
 teyamagu
 iwatsukayura
 findyinc
 clockmaker
 steliosf
 artoy
 koic
 katarinadahlin
 codingconduct
 danielanewman
 greggifford
 chriscoyier
 sabderemane
 jeffersonlam
 baasie
 eitanlees
 garrettdimon
 trallard
 tanoku