Upgrade to Pro — share decks privately, control downloads, hide ads and more …

Debug like a pro

Debug like a pro

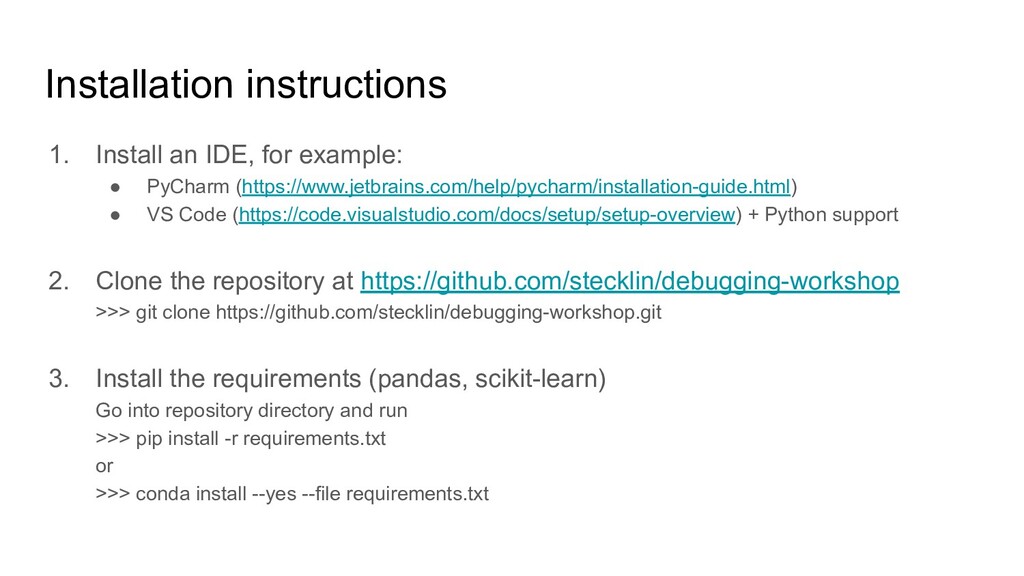
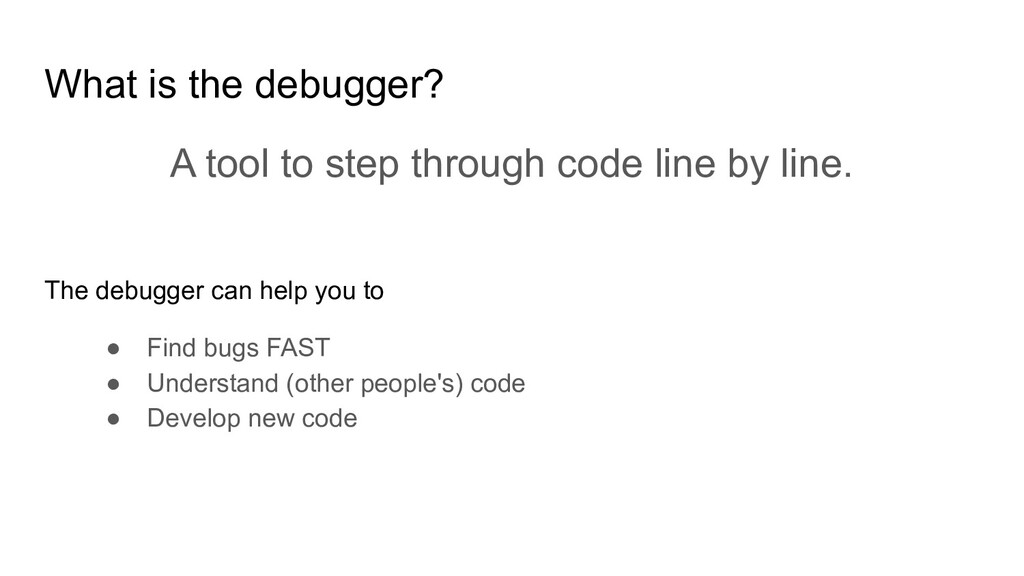
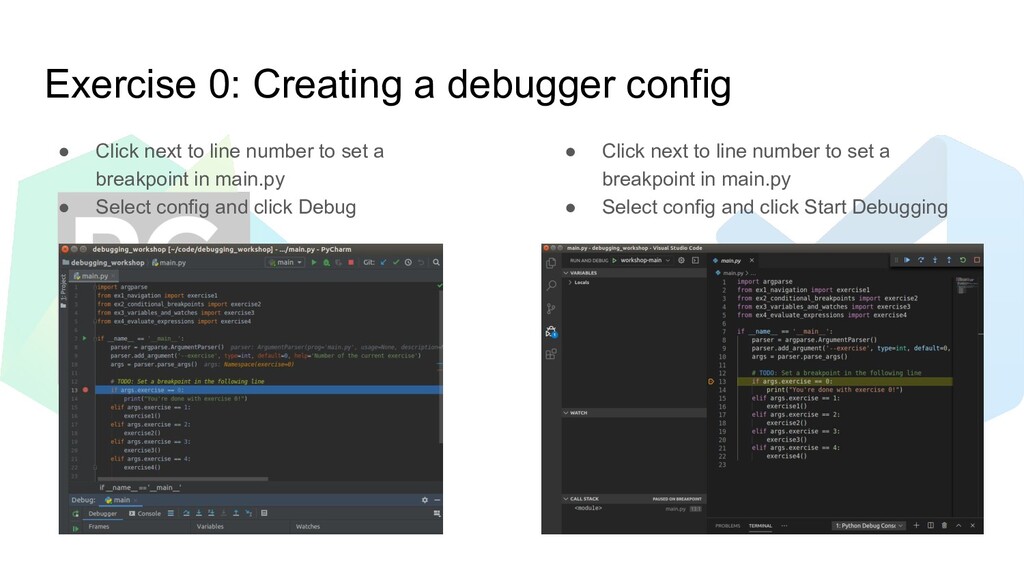
The debugger is a tool that lets you inspect your code line by line as it runs, and thereby discover bugs much faster. I find being able to use the debugger a very valuable skill – no matter what’s your programming level or your role. There is only little you need to know about the debugger, but practicing is the key and this is what this workshop is all about. I’ll show you the basic workflow and some more advanced debugger features, and you’ll have plenty of time to try it out on a toy code base. Whether you’ve never heard of the debugger or used it occasionally already, this workshop is for you!

Marianne Stecklina

March 11, 2020
Tweet

More Decks by Marianne Stecklina

Other Decks in Programming

Transcript

  1. Installation instructions 1. Install an IDE, for example: • PyCharm

    (https://www.jetbrains.com/help/pycharm/installation-guide.html) • VS Code (https://code.visualstudio.com/docs/setup/setup-overview) + Python support 2. Clone the repository at https://github.com/stecklin/debugging-workshop >>> git clone https://github.com/stecklin/debugging-workshop.git 3. Install the requirements (pandas, scikit-learn) Go into repository directory and run >>> pip install -r requirements.txt or >>> conda install --yes --file requirements.txt
  2. What is the debugger? A tool to step through code

    line by line. The debugger can help you to • Find bugs FAST • Understand (other people's) code • Develop new code
  3. How often do you use the debugger? 1) Regularly (=

    every week) 2) Seldom (= only for difficult bugs) 3) Never (= don’t like it / don’t know how)
  4. How this workshop works • Structured into 5 exercises •

    Starting point is always main.py For each exercise: • I’ll explain the theory • Instructions and screenshots for PyCharm and VS Code • 10 - 15 minutes for you to try it out • Follow the “TODO” comments in the code
  5. Exercise 0: Creating a debugger config • Run > Edit

    configurations… • Add new configuration (+) • Select script path • (Add parameters) • Run / Debug > Open configurations • Use “Python: Current File” config or add new Python config • New config: Type name and program • (Add args)
  6. Exercise 0: Creating a debugger config • Click next to

    line number to set a breakpoint in main.py • Select config and click Debug • Click next to line number to set a breakpoint in main.py • Select config and click Start Debugging
  7. Exercise 1: Navigation F9 Resume program / Continue Execute code

    until next breakpoint F5 F8 Step over Execute one line in the current file F10 F7 Step into Step into the function that is called in the current line F11 Shift + F8 Step out Execute code until the end of the current function, and step out to where function was called Shift + F11
  8. Exercise 2: Conditional breakpoints • Create a normal breakpoint •

    Right click on breakpoint • Insert condition • Create a normal breakpoint • Right click on breakpoint > Edit Breakpoint… • Insert condition
  9. Exercise 3: Variables and watches • Select a function from

    Frames / CallStack • Check variables • Add watches
  10. Exercise 4: Evaluate expressions • Click evaluate expression (Alt +

    F8) • Type a command • Open the tab Debug Console • Type a command