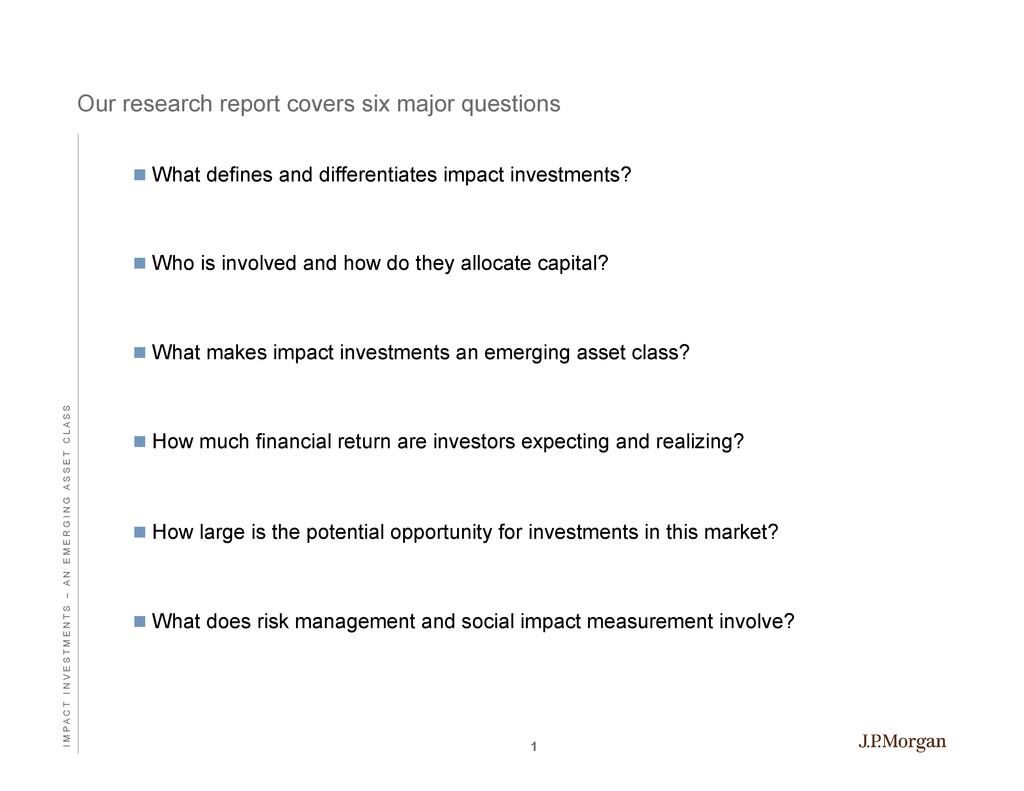
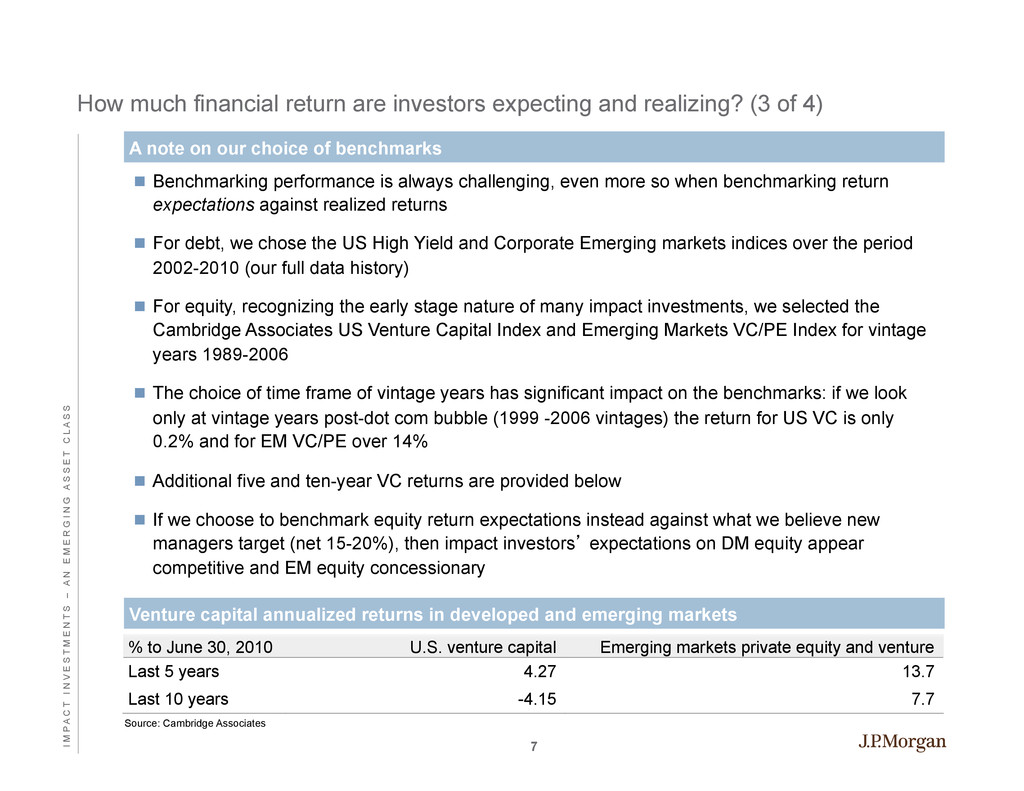
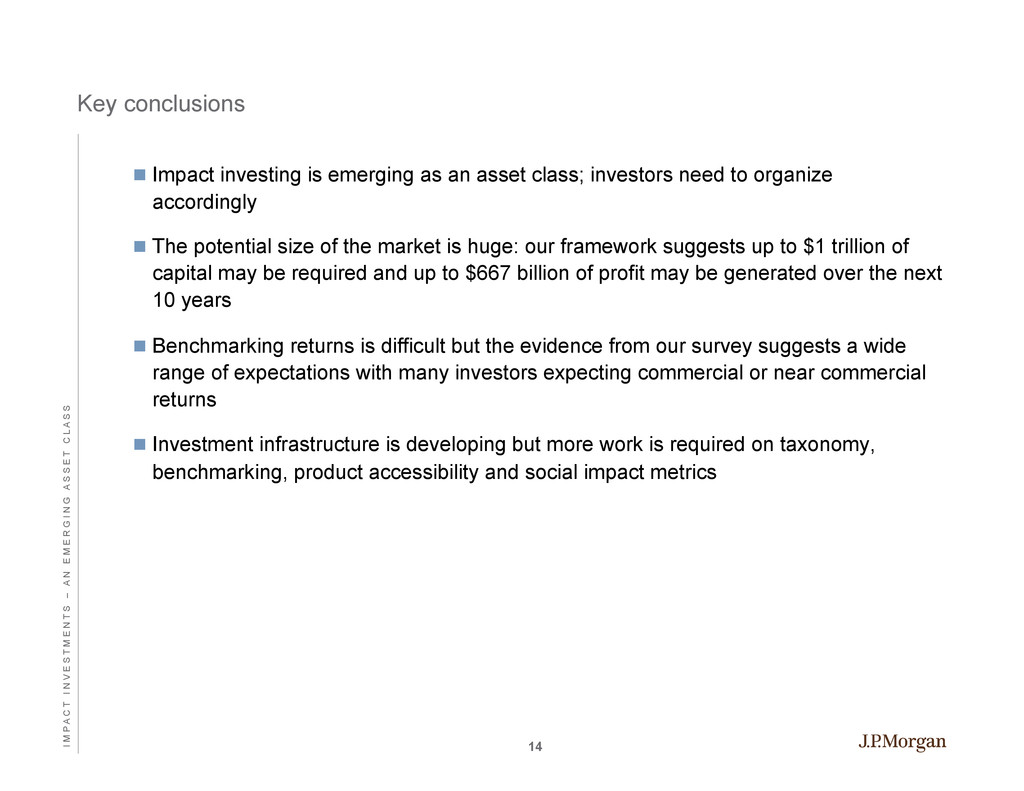
24% 30% Return expectations vs. benchmarks: Average return expectations by instrument and region Source: GIIN, J.P. Morgan. Horizontal bars: Average realized returns for benchmark and average expected returns for impact investments, gross annual IRR or yield, in USD. Vertical lines: Range of expected returns reported, gross annual IRR or yield, in USD. Note: Benchmark returns are average annual returns for: J.P. Morgan’s Developed Markets High Yield index and Corporate Emerging Market Bond (“CEMBI”) Index, over the period 2002 – 2010 (our full data history); and Cambridge Associates US Venture Capital Index and Emerging Markets Venture Capital and Private Equity Index, for vintage years over the period 1989 – 2006. Impact investment return expectations are calculated by taking an average of survey responses (each of which represents a range of expected returns for a given investment instrument in a specified region) across the population of reported investments. The number of investors who responded for each instrument, and the number of investments in the sample (respectively) are: Dev mkt HY debt = 9, 219; EM HY debt = 10, 411; Dev mkt venture capital = 6, 91; EM venture capital = 15, 119. Readers should note the low number of Dev mkt venture capital investors represented. Note that the range of expected returns for developed market debt excludes a single investment reported by one respondent with an expected range of returns of 20-25%; all other data points fall within the range shown. Both the developed market and emerging market venture capital ranges include investments with expectations of 25%+ return (the range was not specified above that level). How much financial return are investors expecting and realizing? (2 of 4) Developed market high yield corporate debt Emerging markets corporate debt Developed market venture capital Emerging market venture capital Benchmark 11% Impact 0-5% Benchmark 9% Impact 8-12% Benchmark 28% Impact 15-20% Benchmark 10% Impact 12-15% n Return expectations vary substantially, from competitive to concessionary n Average expectations for EM debt and equity impact investments appear competitive against traditional benchmarks while expectations for DM debt and equity suggest some trade-off n But these results depend on our choice of benchmarks (next slide) 6 I M P A C T I N V E S T M E N T S – A N E M E R G I N G A S S E T C L A S S