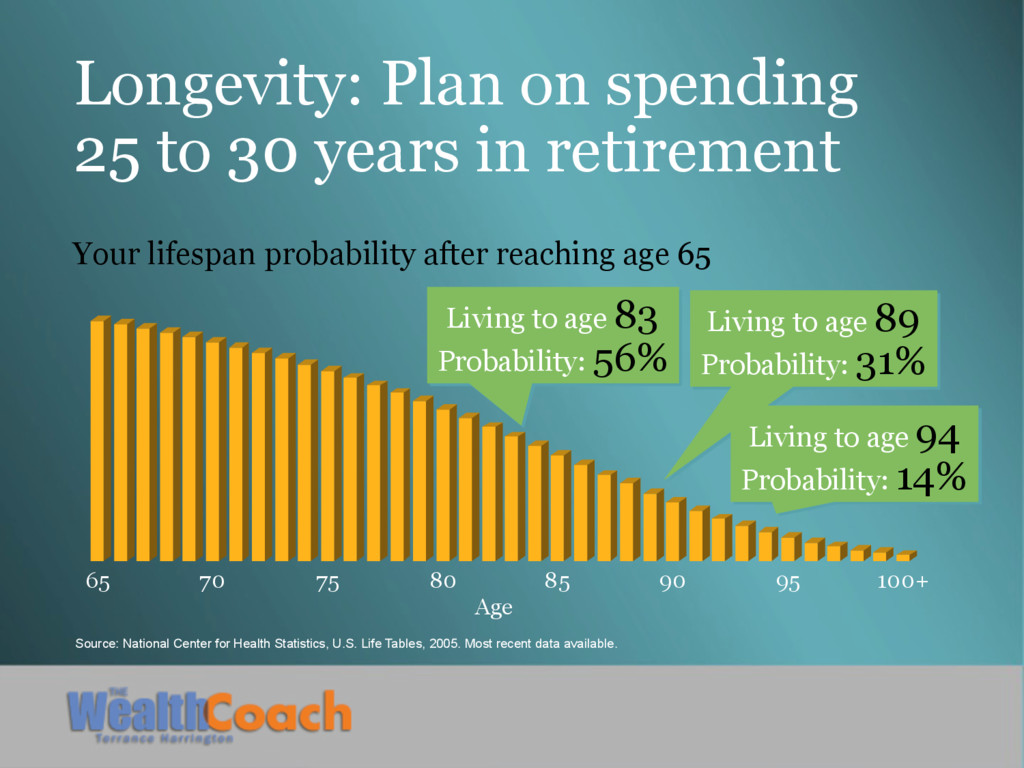
on spending 25 to 30 years in retirement Source: National Center for Health Statistics, U.S. Life Tables, 2005. Most recent data available. Age Your lifespan probability after reaching age 65 Living to age 83 Probability: 56% Living to age 89 Probability: 31% Living to age 94 Probability: 14%
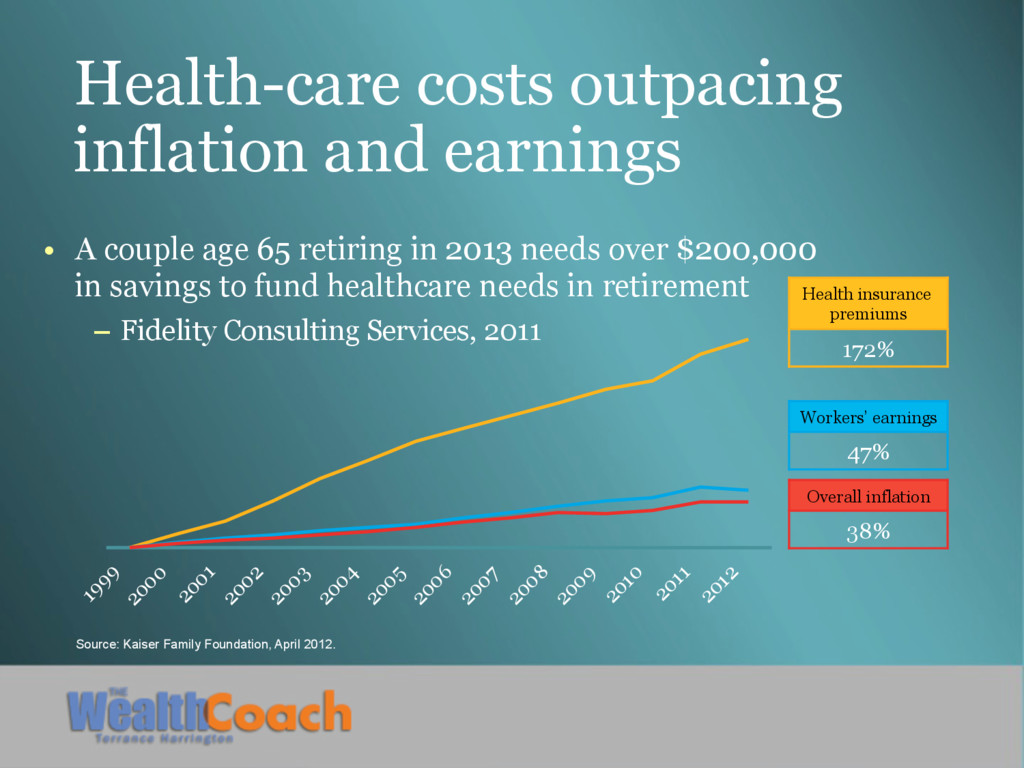
2009 2010 2011 2012 Health-care costs outpacing inflation and earnings • A couple age 65 retiring in 2013 needs over $200,000 in savings to fund healthcare needs in retirement – Fidelity Consulting Services, 2011 Source: Kaiser Family Foundation, April 2012. Health insurance premiums 172% Workers’ earnings 47% Overall inflation 38%
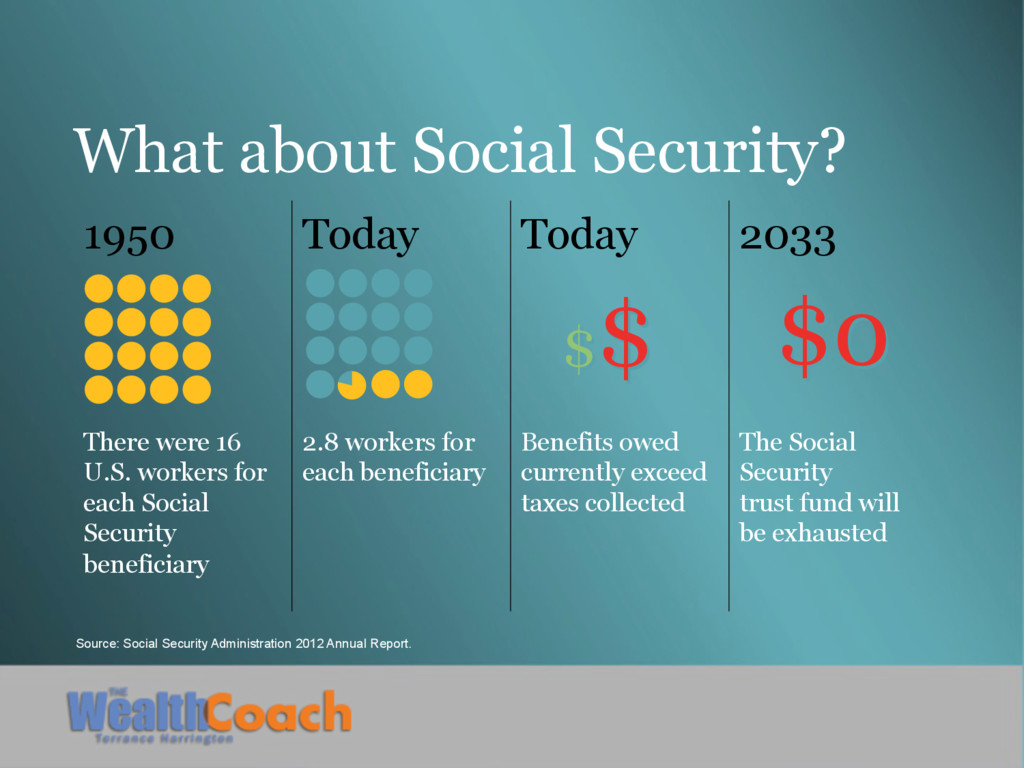
Report. 1950 Today Today 2033 There were 16 U.S. workers for each Social Security beneficiary 2.8 workers for each beneficiary Benefits owed currently exceed taxes collected The Social Security trust fund will be exhausted $$ $0
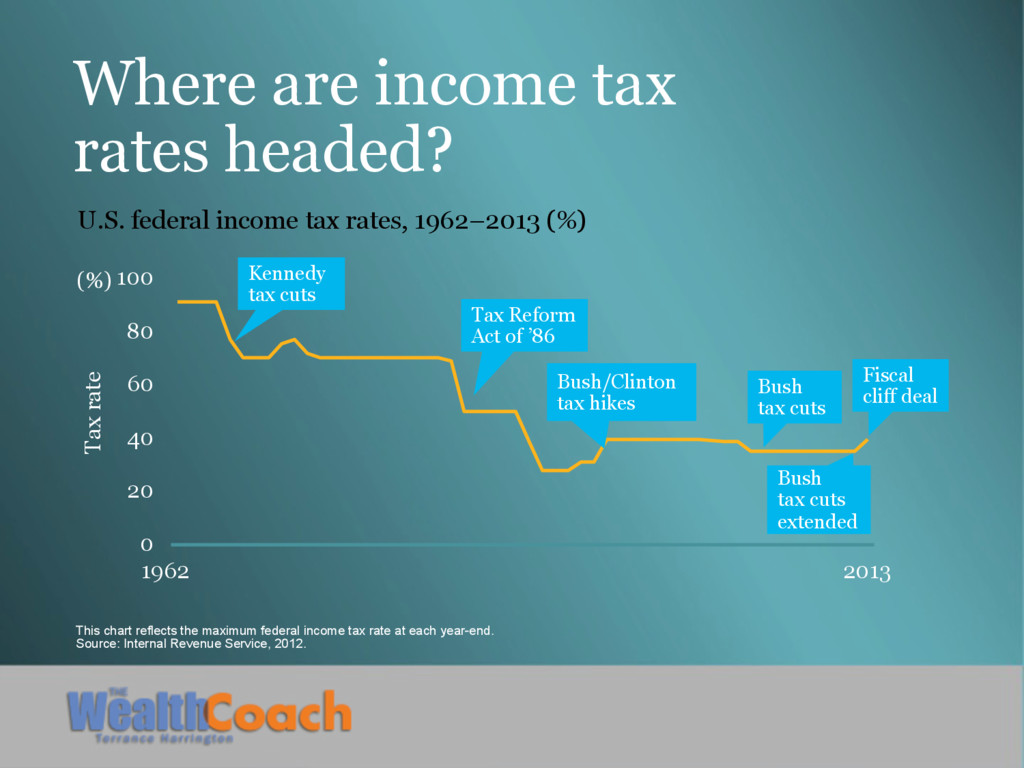
rates headed? This chart reflects the maximum federal income tax rate at each year-end. Source: Internal Revenue Service, 2012. U.S. federal income tax rates, 1962–2013 (%) Tax rate (%) 1962 2013 Kennedy tax cuts Tax Reform Act of ’86 Bush/Clinton tax hikes Bush tax cuts Bush tax cuts extended Fiscal cliff deal
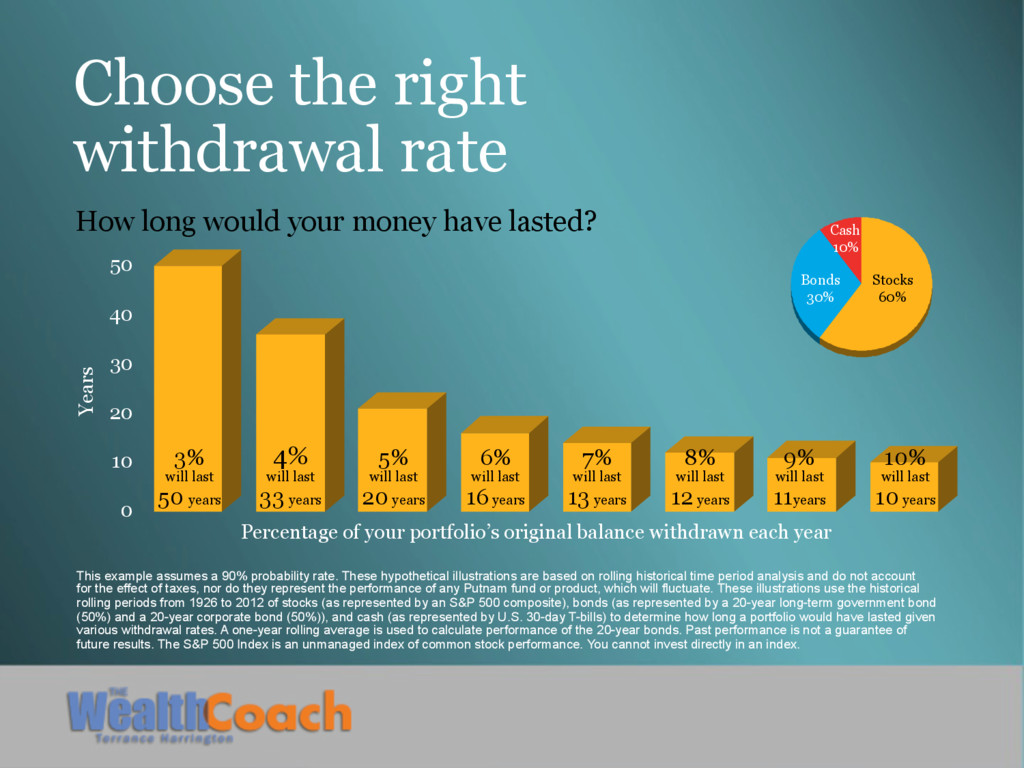
probability rate. These hypothetical illustrations are based on rolling historical time period analysis and do not account for the effect of taxes, nor do they represent the performance of any Putnam fund or product, which will fluctuate. These illustrations use the historical rolling periods from 1926 to 2012 of stocks (as represented by an S&P 500 composite), bonds (as represented by a 20-year long-term government bond (50%) and a 20-year corporate bond (50%)), and cash (as represented by U.S. 30-day T-bills) to determine how long a portfolio would have lasted given various withdrawal rates. A one-year rolling average is used to calculate performance of the 20-year bonds. Past performance is not a guarantee of future results. The S&P 500 Index is an unmanaged index of common stock performance. You cannot invest directly in an index. 0 10 20 30 40 50 Years Percentage of your portfolio’s original balance withdrawn each year How long would your money have lasted? 10% will last 10 years 9% will last 11years 4% will last 33 years 5% will last 20 years 6% will last 16 years 7% will last 13 years 8% will last 12 years 3% will last 50 years Stocks 60% Bonds 30% Cash 10%
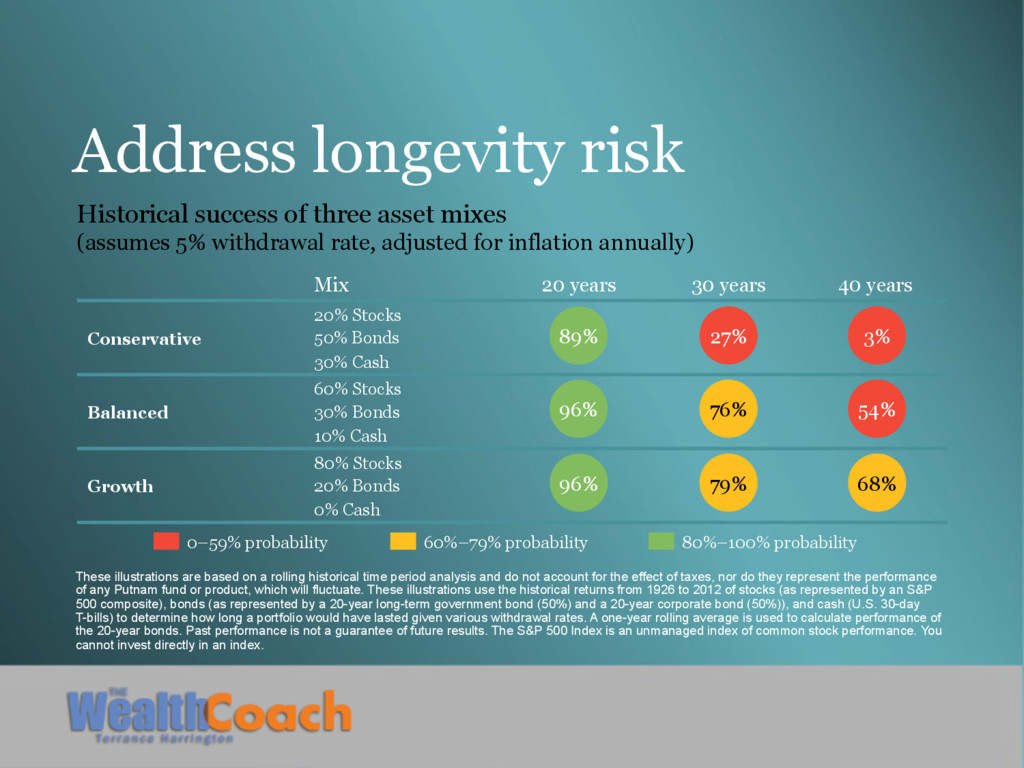
Conservative 20% Stocks 50% Bonds 30% Cash Balanced 60% Stocks 30% Bonds 10% Cash Growth 80% Stocks 20% Bonds 0% Cash Historical success of three asset mixes (assumes 5% withdrawal rate, adjusted for inflation annually) These illustrations are based on a rolling historical time period analysis and do not account for the effect of taxes, nor do they represent the performance of any Putnam fund or product, which will fluctuate. These illustrations use the historical returns from 1926 to 2012 of stocks (as represented by an S&P 500 composite), bonds (as represented by a 20-year long-term government bond (50%) and a 20-year corporate bond (50%)), and cash (U.S. 30-day T-bills) to determine how long a portfolio would have lasted given various withdrawal rates. A one-year rolling average is used to calculate performance of the 20-year bonds. Past performance is not a guarantee of future results. The S&P 500 Index is an unmanaged index of common stock performance. You cannot invest directly in an index. 96% 96% 76% 79% 54% 68% 89% 3% 27% 80%–100% probability 60%–79% probability 0–59% probability
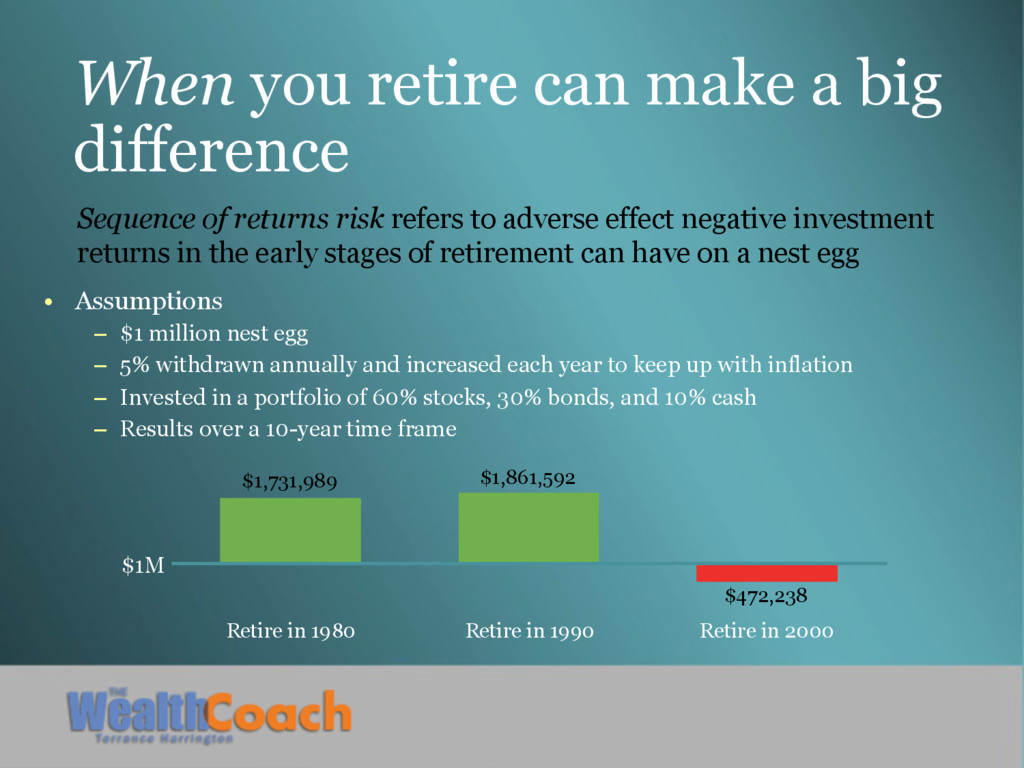
– $1 million nest egg – 5% withdrawn annually and increased each year to keep up with inflation – Invested in a portfolio of 60% stocks, 30% bonds, and 10% cash – Results over a 10-year time frame Sequence of returns risk refers to adverse effect negative investment returns in the early stages of retirement can have on a nest egg Retire in 1980 Retire in 1990 Retire in 2000 $1M $1,731,989 $1,861,592 $472,238
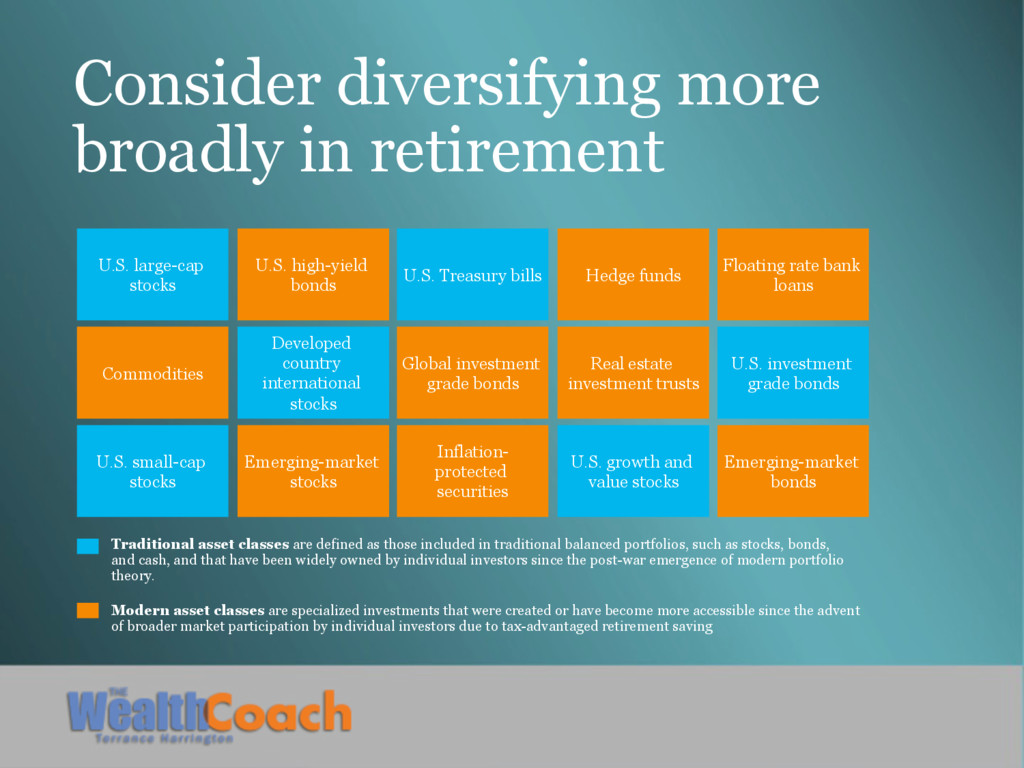
U.S. small-cap stocks U.S. high-yield bonds Developed country international stocks Emerging-market stocks U.S. Treasury bills Global investment grade bonds Inflation- protected securities Hedge funds Real estate investment trusts U.S. growth and value stocks Floating rate bank loans U.S. investment grade bonds Emerging-market bonds Traditional asset classes are defined as those included in traditional balanced portfolios, such as stocks, bonds, and cash, and that have been widely owned by individual investors since the post-war emergence of modern portfolio theory. Modern asset classes are specialized investments that were created or have become more accessible since the advent of broader market participation by individual investors due to tax-advantaged retirement saving
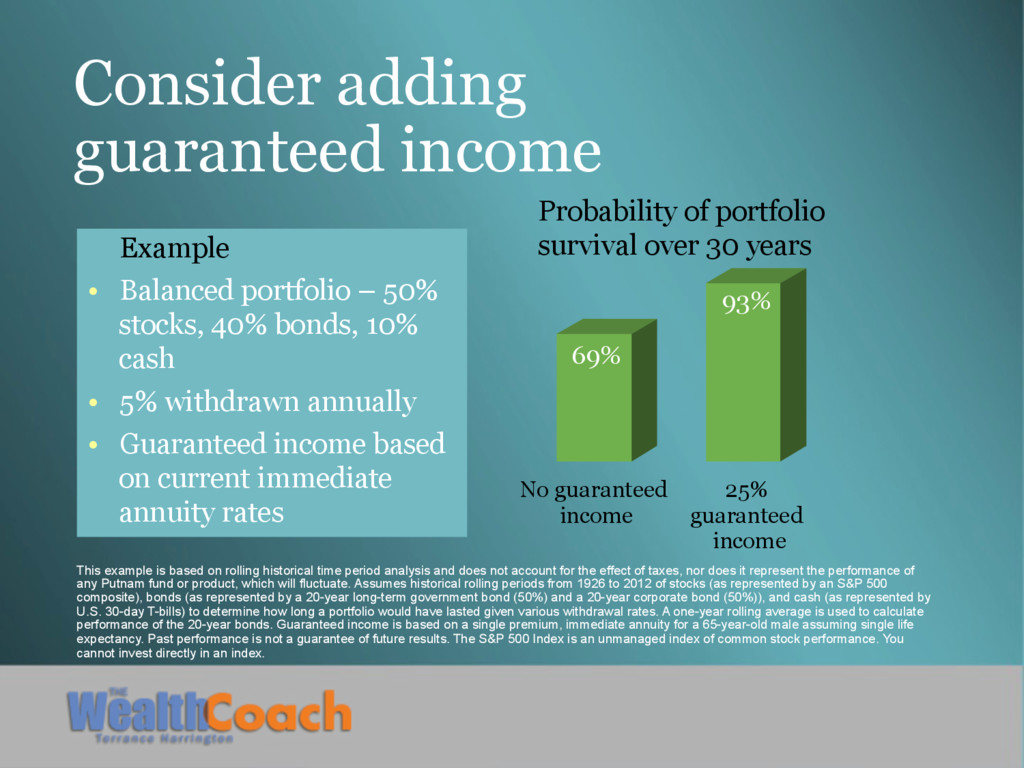
stocks, 40% bonds, 10% cash • 5% withdrawn annually • Guaranteed income based on current immediate annuity rates 69% 93% Probability of portfolio survival over 30 years No guaranteed income 25% guaranteed income This example is based on rolling historical time period analysis and does not account for the effect of taxes, nor does it represent the performance of any Putnam fund or product, which will fluctuate. Assumes historical rolling periods from 1926 to 2012 of stocks (as represented by an S&P 500 composite), bonds (as represented by a 20-year long-term government bond (50%) and a 20-year corporate bond (50%)), and cash (as represented by U.S. 30-day T-bills) to determine how long a portfolio would have lasted given various withdrawal rates. A one-year rolling average is used to calculate performance of the 20-year bonds. Guaranteed income is based on a single premium, immediate annuity for a 65-year-old male assuming single life expectancy. Past performance is not a guarantee of future results. The S&P 500 Index is an unmanaged index of common stock performance. You cannot invest directly in an index.
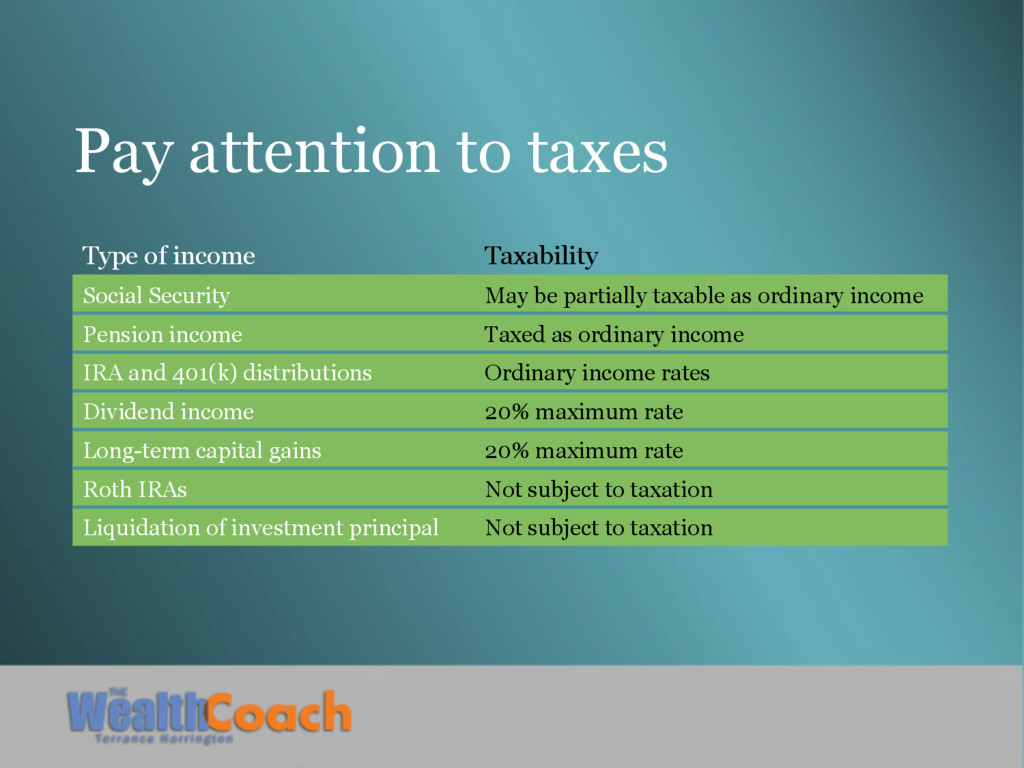
May be partially taxable as ordinary income Pension income Taxed as ordinary income IRA and 401(k) distributions Ordinary income rates Dividend income 20% maximum rate Long-term capital gains 20% maximum rate Roth IRAs Not subject to taxation Liquidation of investment principal Not subject to taxation
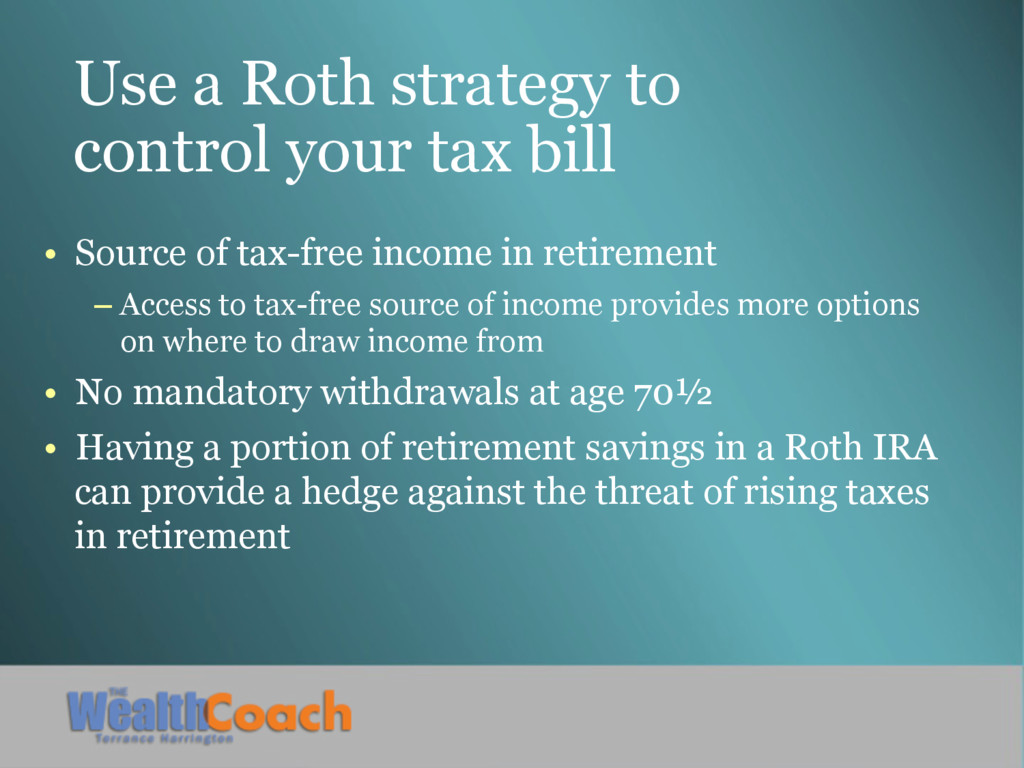
Source of tax-free income in retirement – Access to tax-free source of income provides more options on where to draw income from • No mandatory withdrawals at age 70½ • Having a portion of retirement savings in a Roth IRA can provide a hedge against the threat of rising taxes in retirement
situation Proposed course of action Lower marginal tax rate Draw from traditional retirement accounts to maximize use of lower relative tax bracket, which may help to reduce RMDs at age 70½ Higher marginal tax rate Use tax-free or taxable assets to avoid higher income tax rates and potentially take advantage of lower capital gains rates Significant appreciation in a taxable account If leaving an inheritance, preserve taxable assets to take advantage of “stepped-up” cost basis at death Working in retirement Avoid traditional retirement accounts, which will increase overall income (higher income could trigger taxes on Social Security benefits)
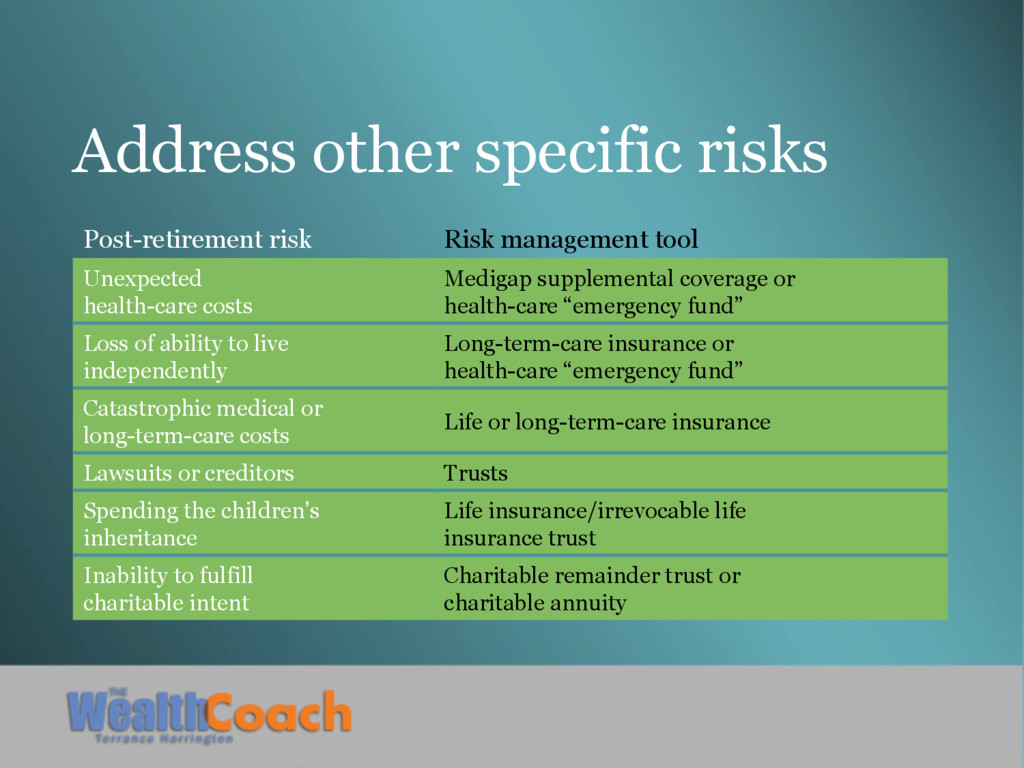
health-care costs Medigap supplemental coverage or health-care “emergency fund” Loss of ability to live independently Long-term-care insurance or health-care “emergency fund” Catastrophic medical or long-term-care costs Life or long-term-care insurance Lawsuits or creditors Trusts Spending the children’s inheritance Life insurance/irrevocable life insurance trust Inability to fulfill charitable intent Charitable remainder trust or charitable annuity
• It’s critical for investors to prepare for certain (and uncertain!) risks • A thoughtful income strategy can help you address these challenges and attain the lifestyle in retirement you desire • Meet with your financial advisor to assess your personal situation
Theodore Roszak • AgeQuake, Paul Wallace • Age Power: How the 21st Century Will Be Ruled by the New Old, Ken Dychtwald, Ph.D. • We're Not in Kansas Anymore: Strategies for Retiring Rich in a Totally Changed World, Walter Updegrave • How Not to Die Broke at 102, Adriane Berg On the web • AARP, www.aarp.org • Social Security Administration, www.ssa.gov • American Savings Education Council, www.asec.org • ElderWeb, www.elderweb.com • Medicare, www.medicare.gov • National Association of Home Care Providers, www.nahc.org