$30 off During Our Annual Pro Sale. View Details »

D3 or not D3

D3 or not D3

In overview of why D3 might be for you, these slides accompany a deep dive into javascript code using d3 and the customising power it can offer.

Tess Barnes

March 12, 2018
Tweet

More Decks by Tess Barnes

Other Decks in Programming

Transcript

  1. D3 or not D3
    Whether it is nobler to use chartjs with mvc

    View Slide

  2. Who am I?
    ● Full stack developer since 2005
    ● Made a few mistakes
    ● Learned a lot
    ● Happy to share
    ● Work in payroll
    Tess Barnes
    @crataegustess
    linkedin.com/in/tessbarnes
    [email protected]

    View Slide

  3. What is D3?
    JS library created by Mike Bostock: https://en.wikipedia.org/wiki/Mike_Bostock
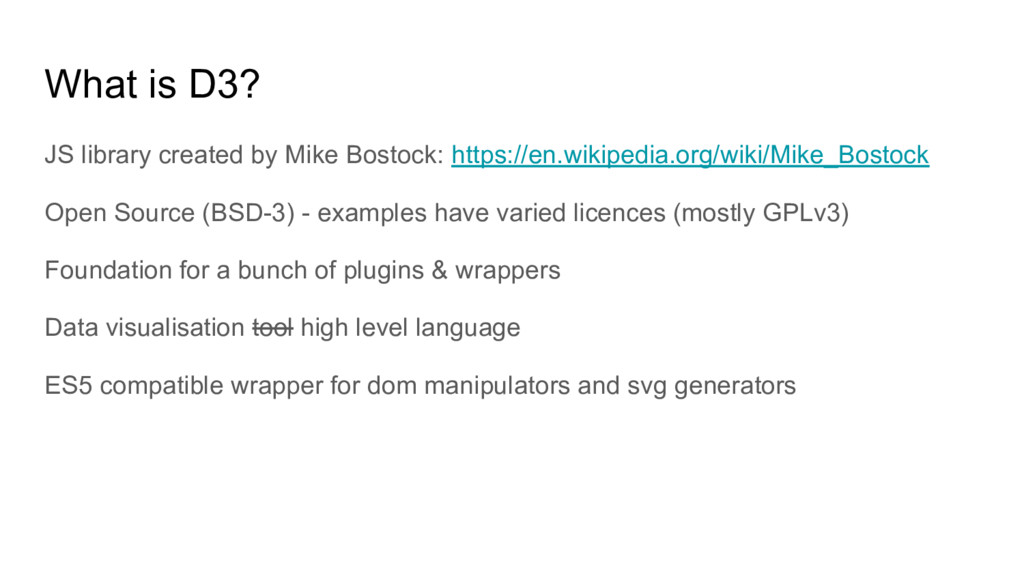
    Open Source (BSD-3) - examples have varied licences (mostly GPLv3)
    Foundation for a bunch of plugins & wrappers
    Data visualisation tool high level language
    ES5 compatible wrapper for dom manipulators and svg generators

    View Slide

  4. What graphs did my boss like?

    View Slide

  5. The graphs I thought we needed

    View Slide

  6. Other contenders
    Kendo
    ● Costs money
    ● Limited range of charts
    ● Hard coded colours
    ChartJS
    ● Limited range of charts (v1)
    ● Built for ES6 (v2 available 4/2016)
    ● Limited configuration
    Google charts
    ● Google hosted services
    ● Limited range of charts
    ● Harder to customise colours
    dynamically
    Must Integrate with MVC
    Must Work in IE10 & IE11

    View Slide

  7. Demo 1… The other contenders
    After the talk we also briefly discussed c3 : http://c3js.org/gettingstarted.html
    This is a d3 wrapper but doesn’t look like you can drill into the d3
    underneath. MIT licence.

    View Slide

  8. Why was d3 a good fit
    Flexible - not just ‘ordinary’ graphs
    Interactive -
    ● Easily filtered data
    ● Relative sizing
    ● Zoomable (https://bl.ocks.org/mbostock/4348373)
    ● Selectable (http://bl.ocks.org/tylercraft/3630001)
    ● Rollover behaviour
    Didn’t cost any money
    Worked with C# MVC
    Worked in IE

    View Slide

  9. What made it usable
    Just javascript (ES5 style)
    Styled with 
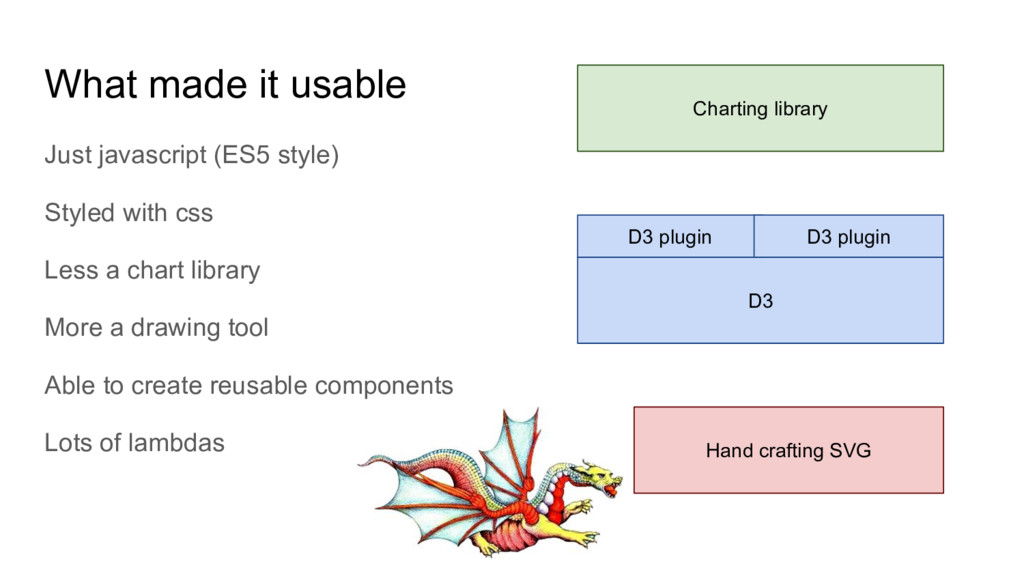
css
    Less a chart library
    More a drawing tool
    Able to create reusable components
    Lots of lambdas
    Charting library
    D3
    Hand crafting SVG
    D3 plugin D3 plugin

    View Slide

  10. Why else was d3 a good fit
    Configurable - our own dynamic colour scheme - write once, use everywhere
    g.append("path")
    .attr("d", arc)
    .attr("fill", function (d, i) {
    return c.getColor(def.baseHue, def.baseSaturation, i, data.items.length, def.theme); })
    getColor : function(hue, sat, itemIndex, numItems, theme) {
    var lightness = 0;
    if (theme === "Dark") {
    lightness = (((itemIndex + 2) / (numItems + 2)).toFixed(2));
    } else {
    lightness = 1 - (((itemIndex + 2) / (numItems + 2)).toFixed(2));
    }
    return d3.hsl(hue, sat, lightness); },

    View Slide

  11. Demo 2: Let’s dive in...

    View Slide

  12. What I actually needed

    View Slide

  13. Trips and Traps
    V3 or V4 (released June 2016) - Ch-ch-changes: https://github.com/d3/d3/blob/master/CHANGES.md
    Open source plugins (https://github.com/d3/d3/wiki/Plugins)
    Example frenzy (https://github.com/d3/d3/wiki/Gallery)
    Licencing / giving credit
    Wrapper libraries - dimple (not IE), NVD3 (not IE & abandoned 2014)
    MVC integration, webpack builds and the joys of RequireJS.NET
    Post pub discussion: Rendering as canvas for performance:
    https://medium.freecodecamp.org/d3-and-canvas-in-3-steps-8505c8b27444

    View Slide

  14. Bonus round - Maps
    To do maps you need a 
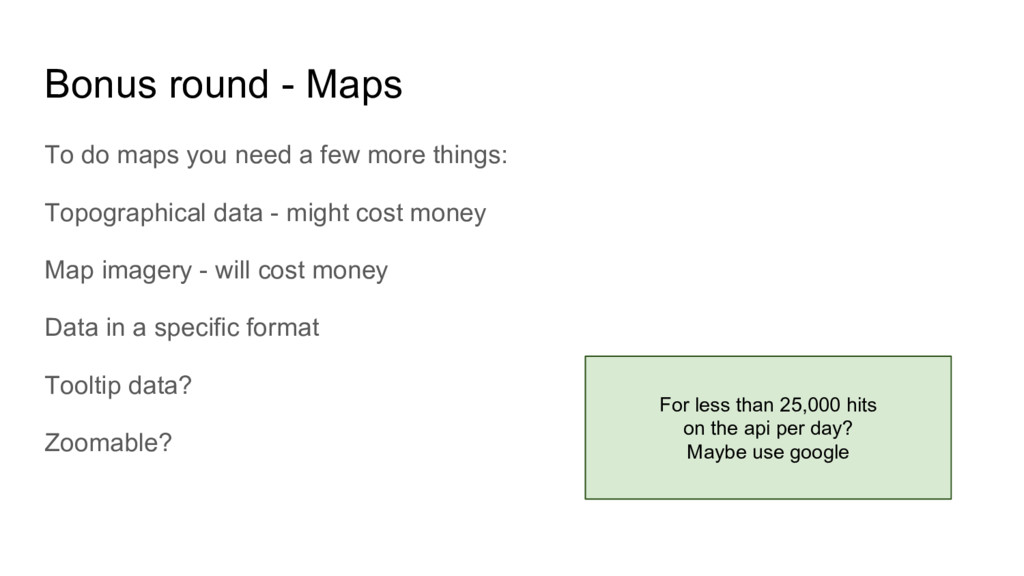
few more things:
    Topographical data - might cost money
    Map imagery - will cost money
    Data in a specific format
    Tooltip data?
    Zoomable?
    For less than 25,000 hits
    on the api per day?
    Maybe use google

    View Slide

  15. Bonus round - 3D
    Additional library - https://github.com/x3dom/x3dom, http://x3dom.org
    Uses 
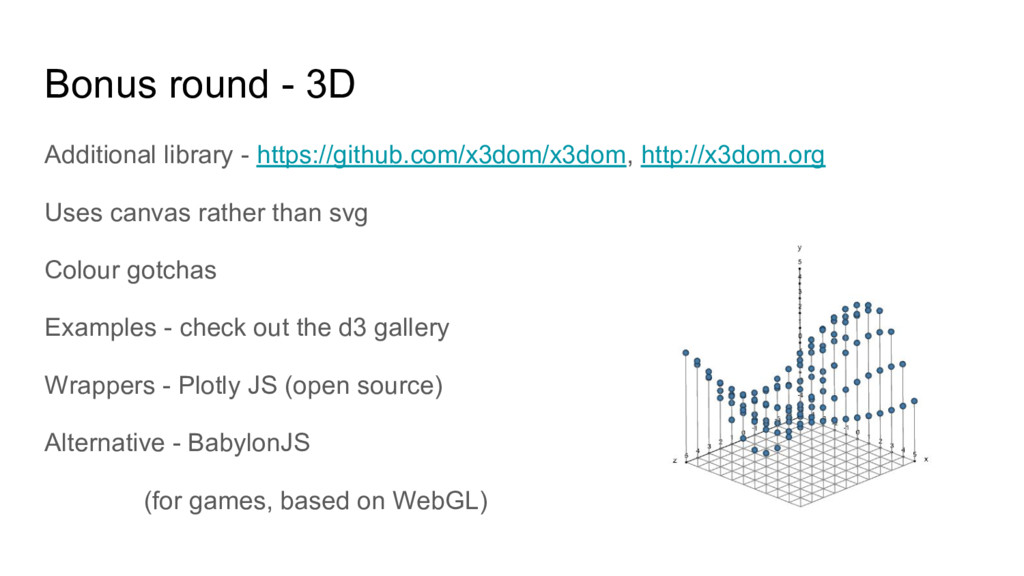
canvas rather than svg
    Colour gotchas
    Examples - check out the d3 gallery
    Wrappers - Plotly JS (open source)
    Alternative - BabylonJS
    (for games, based on WebGL)

    View Slide

  16. The real use case for d3
    Creating a space where:
    ● Data is fun
    ● Data is interactive
    ● One key element emphasised
    Animation: https://bl.ocks.org/mbostock/raw/1136236/
    Force graphs bonus
    Further reading: https://www.analyticsvidhya.com/blog/2017/08/visualizations-with-d3-js/
    Best when:
    ● Data is not just maths
    ● Users have time to explore
    ● Problem space is a one off event

    View Slide

  17. credits
    All d3 chart images copied or streamed from https://github.com/d3/d3/wiki/Gallery;
    licenced by their authors.
    Dragon - free range from the public domain
    Thanks for listening! Any questions?

    View Slide