Upgrade to Pro — share decks privately, control downloads, hide ads and more …

Consistency in Observability of Microservices at Lyft (Monitorama 2017 PDX)

Consistency in Observability of Microservices at Lyft (Monitorama 2017 PDX)

Yann Ramin

May 24, 2017
Tweet

More Decks by Yann Ramin

Other Decks in Technology

Transcript

  1. Consistency in Monitoring Observability of Microservices @ Fighting Entropy and

    Delaying the Heat Death of the Universe Yann Ramin @theatrus - [email protected]
  2. Monitorama 2017 PDX / @theatrus Hi! I’m Yann 
 @theatrus

    Engineering Manager
 Observability Team @ Lyft
 Logging, TSDBs, performance profiling, low-level infrastructure
 
 Previously from the world of embedded systems
 “C is the best programming language”
  3. Monitorama 2017 PDX / @theatrus Approaches and techniques to avoid

    production incidents with hundreds of micro services and diverse teams
  4. What are we trying to solve? When developers are on-call

    with microservices or scaling operational mindfulness
  5. Monitorama 2017 PDX / @theatrus “I clicked production deploy and

    Jenkins went green! [closes laptop, goes home]” This is an opportunity for excellence
  6. Monitorama 2017 PDX / @theatrus “No one setup a PagerDuty

    rotation before going to production!”
  7. Monitorama 2017 PDX / @theatrus “We need alarms on thingX!

    Lets copy and paste them from my last service!”
  8. Monitorama 2017 PDX / @theatrus ~ Today Python, PHP, and

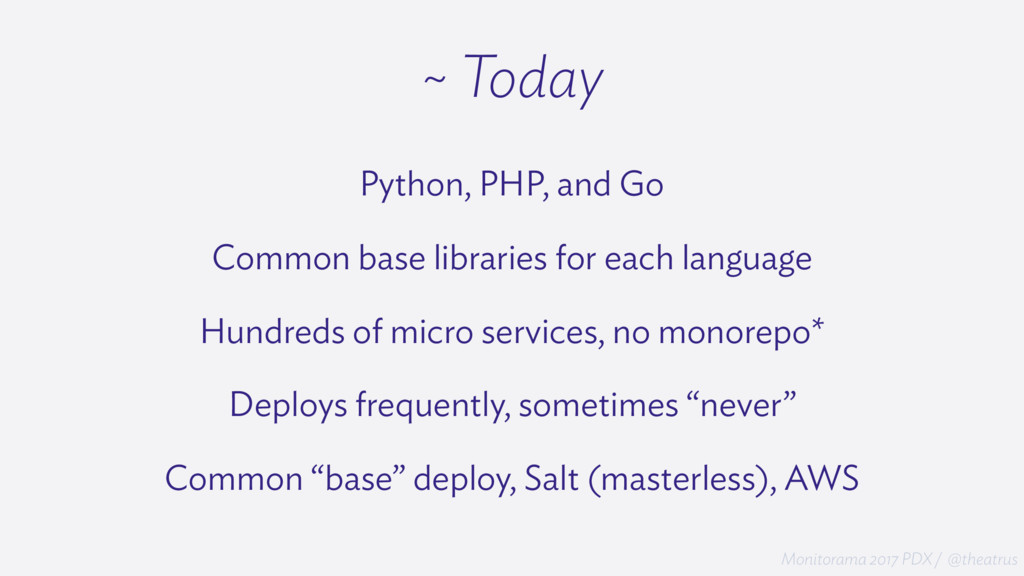
    Go Common base libraries for each language Hundreds of micro services, no monorepo* Deploys frequently, sometimes “never” Common “base” deploy, Salt (masterless), AWS
  9. Monitorama 2017 PDX / @theatrus DevOps? Teams on-call for their

    services No operations No SRE Infrastructure team enables, not operates
  10. Monitorama 2017 PDX / @theatrus Data you get Service level

    aggregates centrally (correct histograms)
 Per host data processed locally Default 60 second period(!), option for 1 second
  11. Monitorama 2017 PDX / @theatrus So many events Billions per

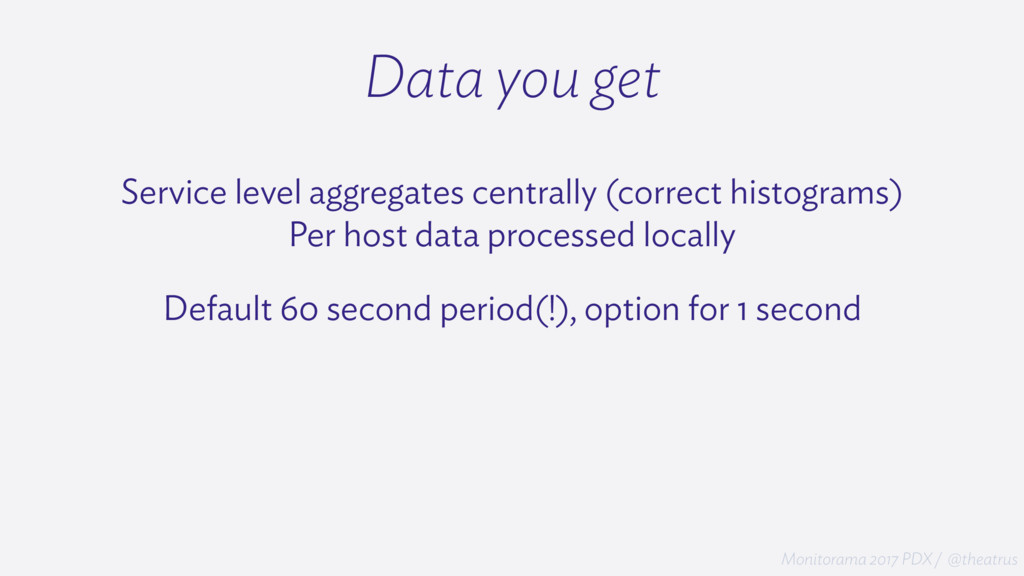
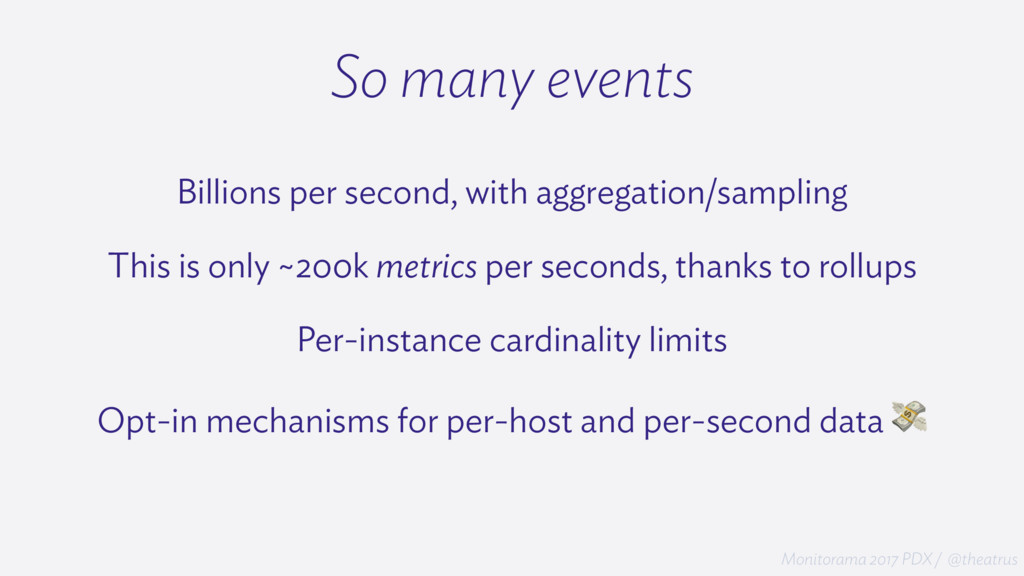
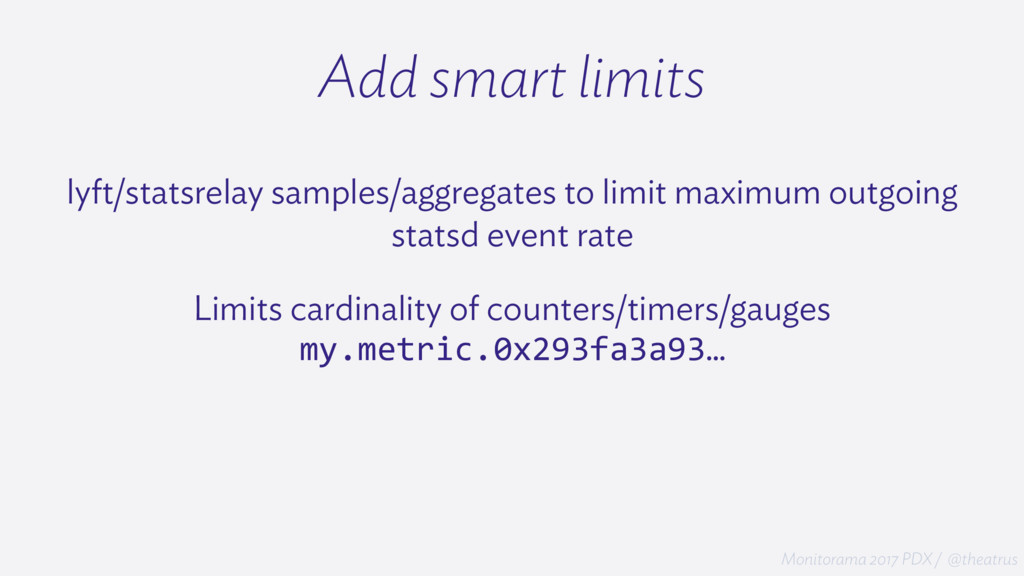
    second, with aggregation/sampling This is only ~200k metrics per seconds, thanks to rollups Per-instance cardinality limits Opt-in mechanisms for per-host and per-second data
  12. Monitorama 2017 PDX / @theatrus System metrics CollectD Custom scripts

    Even some bash functions All to local statsrelay
  13. Monitorama 2017 PDX / @theatrus What do we get? Comprehensive

    system metrics All metric producers are sandboxed, rate limited, and monitored No UDP spam over the network LIFO queueing
  14. Monitorama 2017 PDX / @theatrus Problem Developers add metrics after

    it already broke once Adding metrics on core functions is not DRY Not all developers think in terms of metrics
  15. Monitorama 2017 PDX / @theatrus Instrument the RPC Record RPC

    inbound errors, successes, timings in core servers 
 Gunicorn + https://pypi.python.org/pypi/blinker + statsd
  16. Monitorama 2017 PDX / @theatrus What do we get? Consistent

    Measurement Consistent Visibility Point to Point Debugging Unified Tracing
  17. Monitorama 2017 PDX / @theatrus orca Salt module for “Orchestration”

    Provisions all remote resources a service needs during deploy Interacts with PagerDuty, makes sure a PD service is created Makes sure an on-call schedule is associated Otherwise blocks production deploy
  18. Monitorama 2017 PDX / @theatrus Python from lyft_stats.stats import get_stats


    stat_handler = get_stats(‘my_prefix’).scope(‘foo’)
 
 stat_handler.incr('foo.counter')
 
 stat_handler.incr('counter.example', 10, tags={'bar': 'baz'})
 
 stat_handler.timer('sample.timer', 10.0, per_host=True)
  19. Monitorama 2017 PDX / @theatrus Gripes statsd calls are not

    cheap (syscalls) Various workarounds (.pipeline())
  20. Monitorama 2017 PDX / @theatrus Further Improvements libtelem - native

    library to handle consistent instrumentation, shared memory views Unified tracing, logging and metrics
  21. Monitorama 2017 PDX / @theatrus Multiple System Syndrome CloudWatch is

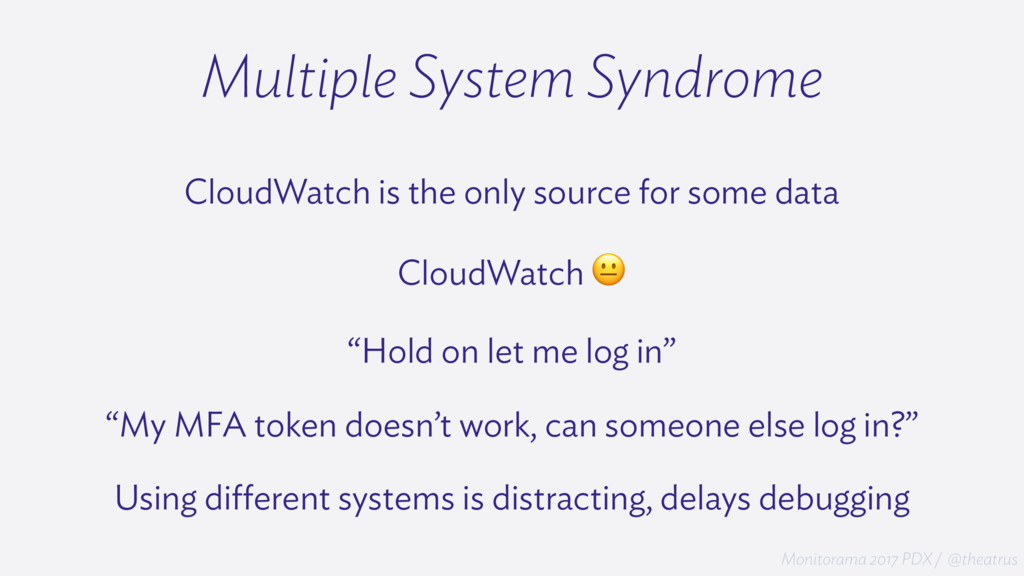
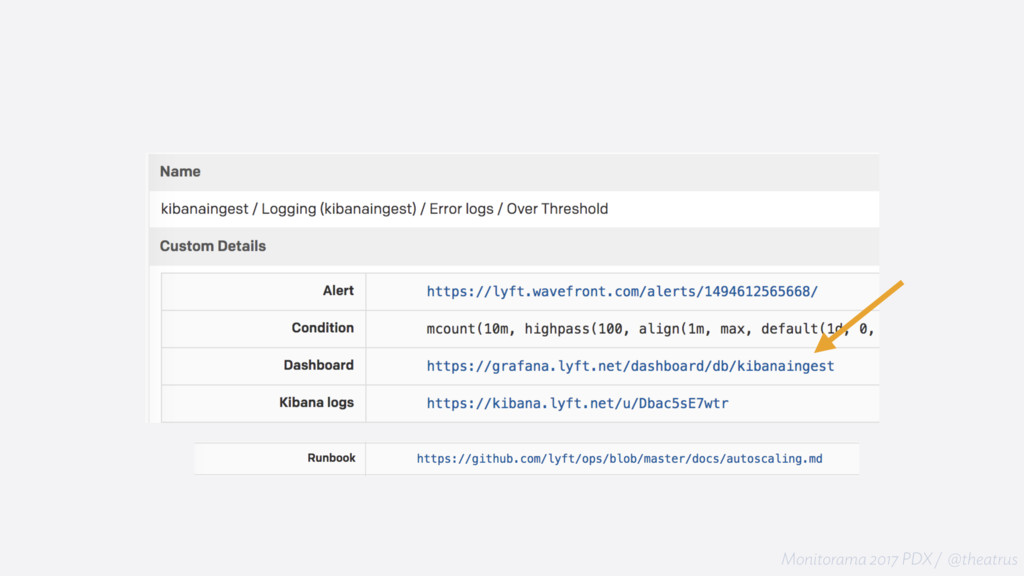
    the only source for some data CloudWatch “Hold on let me log in” “My MFA token doesn’t work, can someone else log in?” Using different systems is distracting, delays debugging
  22. Monitorama 2017 PDX / @theatrus Less tools The less tools

    for triage, the better Context switching is expensive Put everything up front, or one click away
  23. Monitorama 2017 PDX / @theatrus Central Monitoring and Alarm Hub

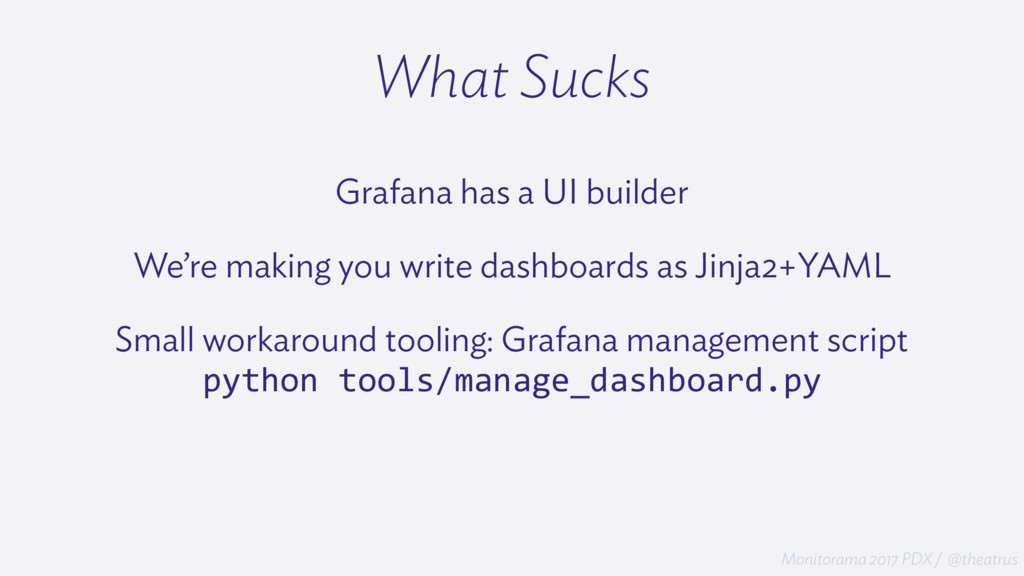
    Git Monorepo Ties in with our Salt infrastructure Dashboards defined as Salt states, deploys like a service Iteration to staging Grafana Manages Grafana, Wavefront, other services
  24. Monitorama 2017 PDX / @theatrus Add Services define extra resources

    they use in a Salt pillar Can also define custom rows and targets
  25. Monitorama 2017 PDX / @theatrus Other advantages Alarms exist on

    dashboards Less copy and paste Global refactoring Customize alarms without learning about all the nuances
  26. Monitorama 2017 PDX / @theatrus Even more features Contains a

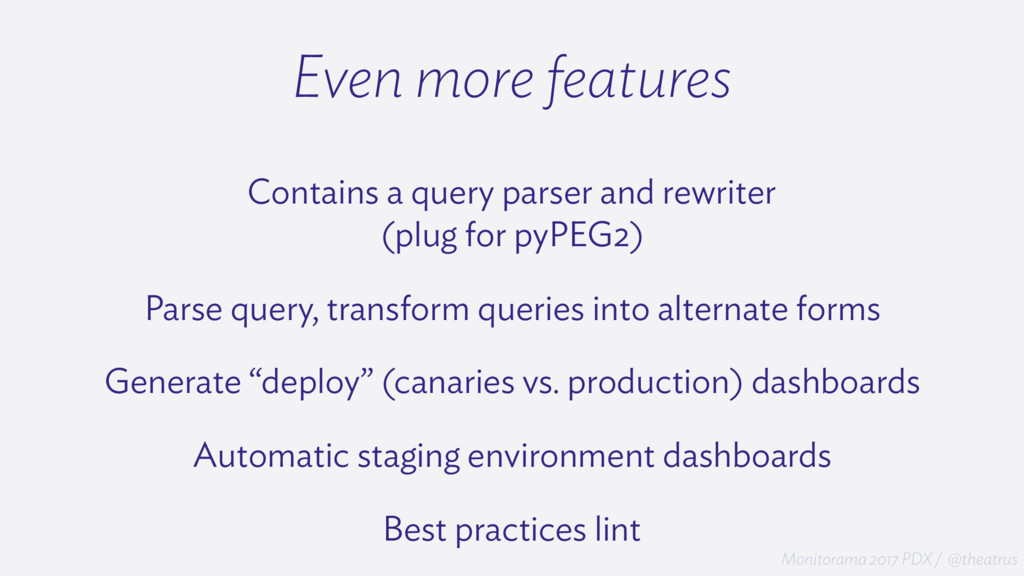
    query parser and rewriter
 (plug for pyPEG2) Parse query, transform queries into alternate forms Generate “deploy” (canaries vs. production) dashboards Automatic staging environment dashboards Best practices lint
  27. Monitorama 2017 PDX / @theatrus What Sucks Grafana has a

    UI builder We’re making you write dashboards as Jinja2+YAML Small workaround tooling: Grafana management script
 python tools/manage_dashboard.py
  28. Monitorama 2017 PDX / @theatrus What Sucks Monorepo was great

    to bootstrap and iterate Poor in all the classic monorepo ways
  29. Monitorama 2017 PDX / @theatrus Query languages, alarming, and UX

    far too difficult For non-experts, and we shouldn’t expect our
 users to become experts in the field
  30. Trust and Self Defense Will the dashboard load? Can I

    trust the data? Can you take it down?
  31. Monitorama 2017 PDX / @theatrus Provide visibility, out of band,

    of monitoring health Updates every 15s Updates … a few hours later?
  32. Monitorama 2017 PDX / @theatrus Add smart limits lyft/statsrelay samples/aggregates

    to limit maximum outgoing statsd event rate Limits cardinality of counters/timers/gauges
 my.metric.0x293fa3a93…