Upgrade to Pro — share decks privately, control downloads, hide ads and more …

xdebug: shedding light on your code.

xdebug: shedding light on your code.

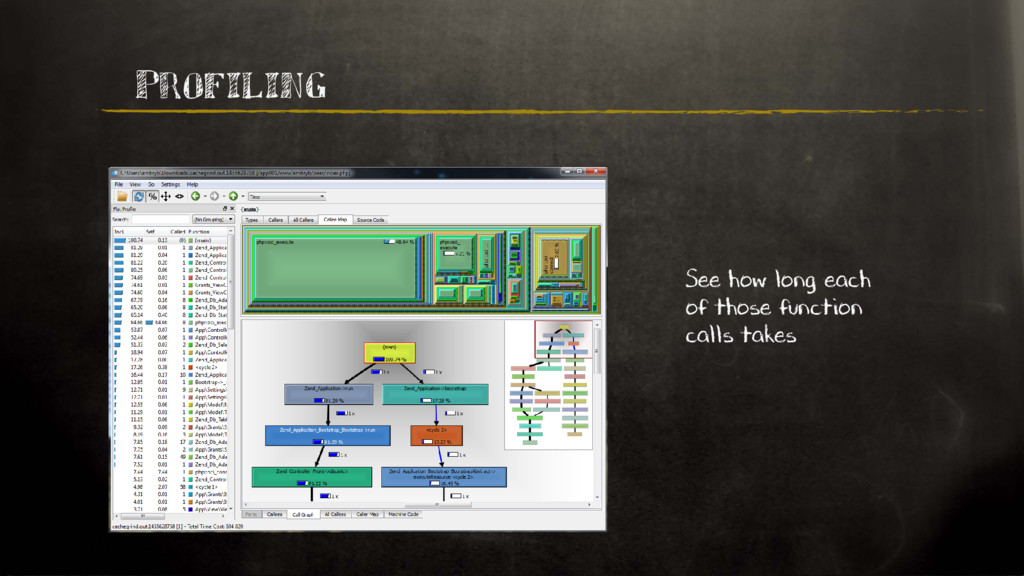
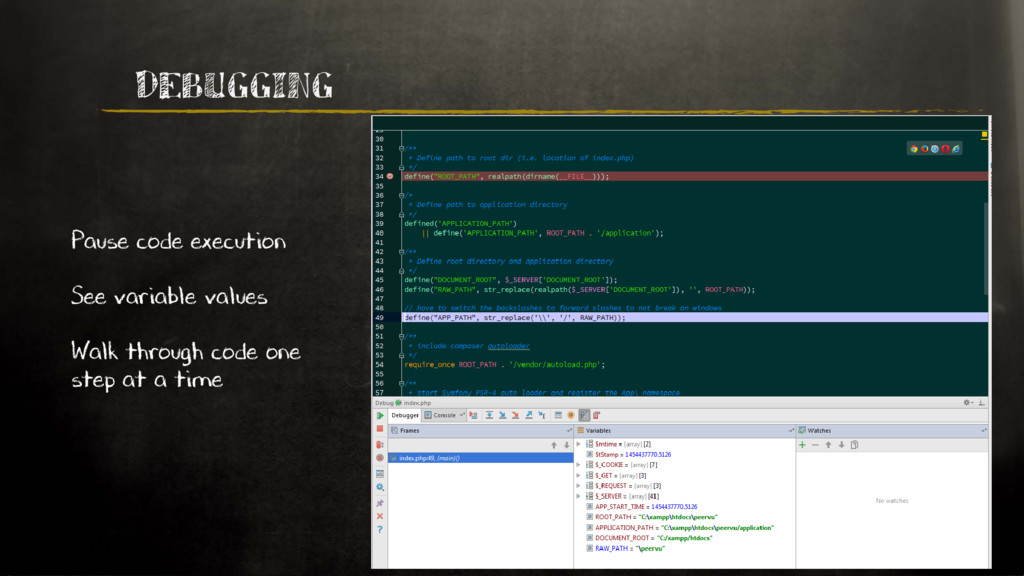
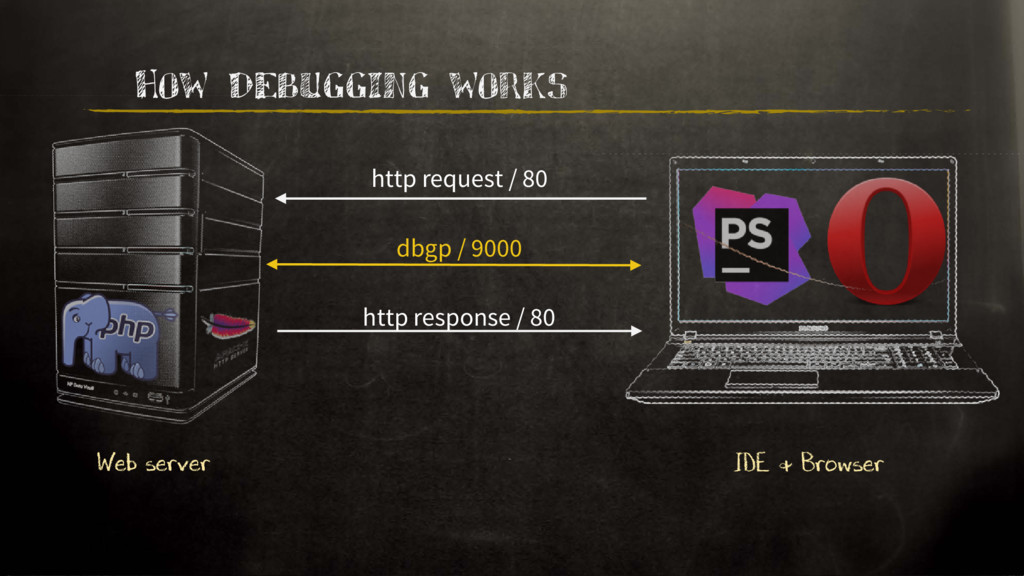
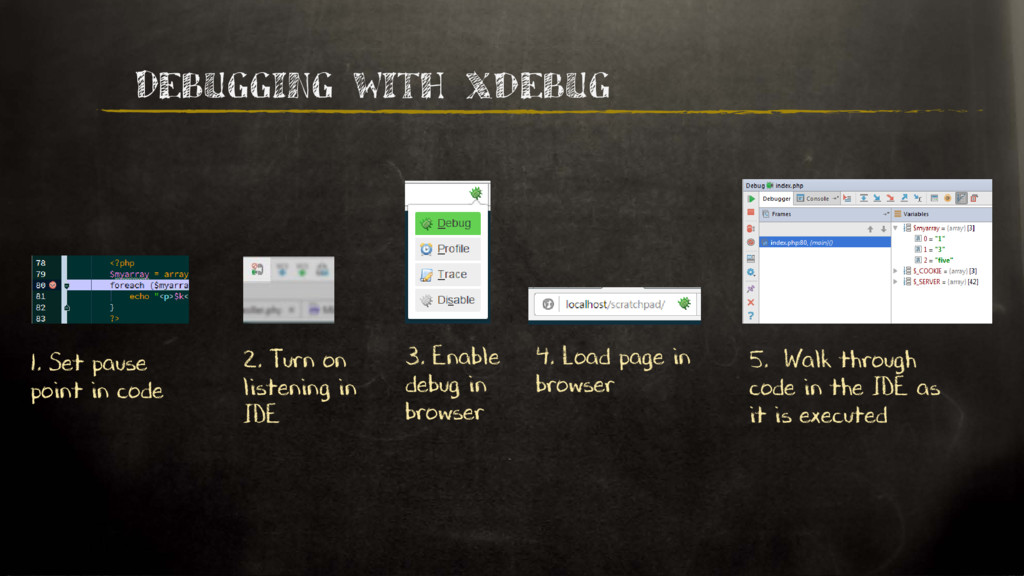
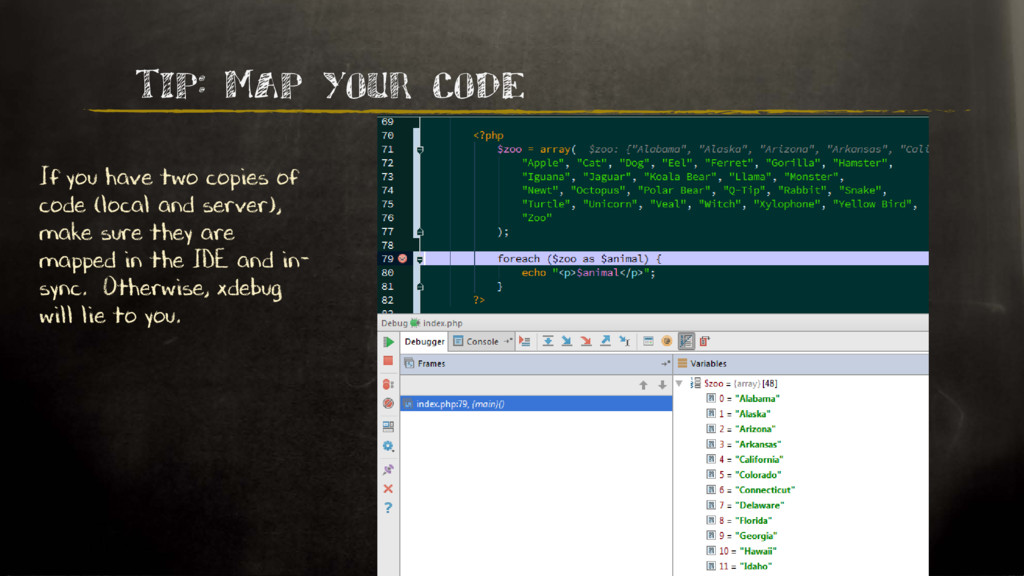
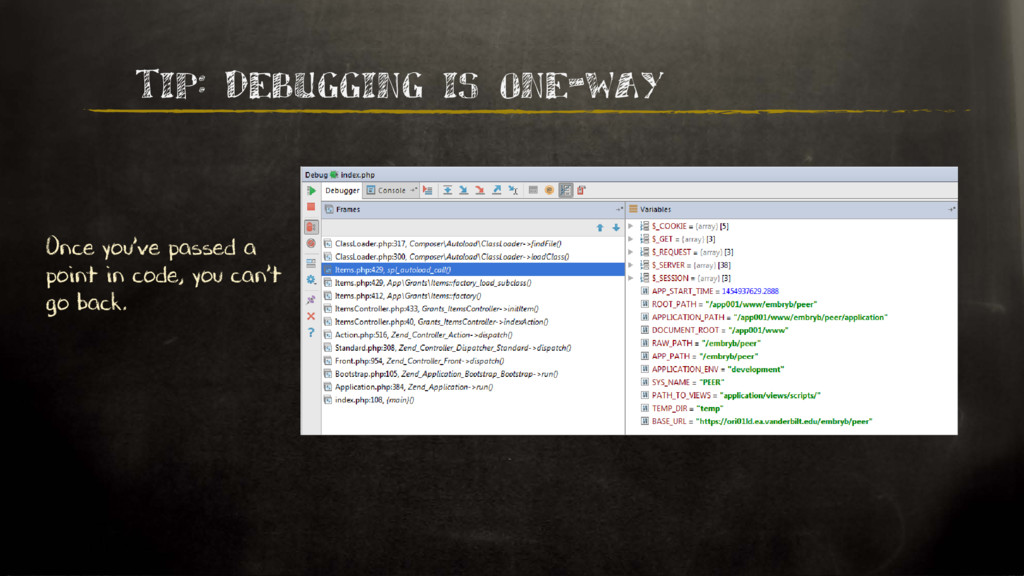
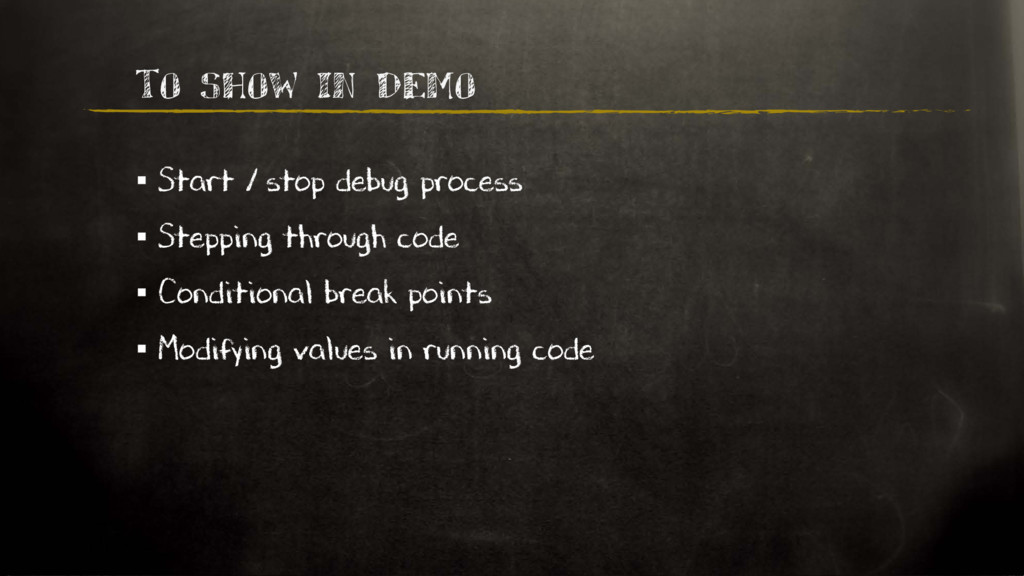
Programming doesn’t have to be a dark art. If you’re still relying on var_dump and echo statements to peek into the shadows of your code, then it’s time to step into the light. Xdebug is a standard PHP extension that illuminates your code while it’s running, allowing you to see in real-time the dumb mistake you made on line 247. In this foundational session, learn how to configure xdebug and effectively use it to pause, modify, and gingerly step through running code. But beware: once you’ve walked in the light, you can never go back to the dark side.

Bryce Embry

April 01, 2016
Tweet

More Decks by Bryce Embry

Other Decks in Programming

Transcript

  1. Who Is This Guy? Bryce Embry Application Developer at Vanderbilt

    University Medical Center Devoted user of Opera web browser Ambivalent user of Windows Desktop Handyman, cook, musician, husband, & father
  2. In this session… ▪ What is xdebug? ▪ Getting Started

    ▪ Tracing ▪ Profiling ▪ Debugging ▪ Debug Demo
  3. Code Coverage Identify which lines of a script have been

    executed during a request. This feature is used by other programs to create test coverage reports
  4. Two Part Install ▪ Server: – Install xdebug extension to

    PHP – Configure php.ini – Restart web server ▪ Client – Install browser extension
  5. Client: URL Triggers To trigger xdebug, need to use a

    cookie or add parameters to the URL. Doing this by hand violates the programming principle, “Work hard to be lazy”.
  6. Client: Bookmarklets PHPStorm has a site to create “bookmarklets” to

    add trigger parameters to your URL. https://www.jetbrains.com/phpstorm/marklets/
  7. Running a trace 1. In browser, activate trace 2. Load

    web page 3. On server, find trace file 4. Review trace file
  8. Configuration Options trace_enable_trigger Turn “on” to allow traces trace_enable_trigger_value Sets

    a passcode that must be passed by browser to start a trace trace_format Sets the output format for a trace as human-readable, machine readable, or HTML trace_options Turn “on” to have trace data appended to a file instead of creating new file. trace_output_dir Sets directory where trace file will be saved. Make sure this directory is readable by the PHP process (ie Apache) If using HTML output, set this as a web-accessible directory trace_output_name Sets name for trace file. The extension “.xt” will be appended by default. Can include variables such as: %t = timestamp %R = $_SERVER[‘REQUEST_URI’]
  9. Running a profile 1. In browser, activate profile 2. Load

    web page 3. Look for new cachegrind file on server. 4. Open in IDE or KcacheGrind
  10. Configuration Options profiler_append Turn “on” to have data appended to

    existing file instead of creating a new file. profiler_enable Turn “on” if you want constant profiling. (Hint: You don’t.) profiler_enable_trigger Turn “on” to allow profiling to be activated by a browser trigger profiler_enable_trigger_value Sets a passcode that must be passed by browser to start a profile profiler_output_dir Sets directory where profile file will be saved. Make sure this directory is readable by the PHP process (ie Apache) profiler_output_name Sets name for profile file. Can include variables such as: %t = timestamp %s = script name
  11. How debugging works Web server IDE & Browser http request

    / 80 dbgp / 9000 http response / 80
  12. Debugging with xdebug 1. Set pause point in code 2.

    Turn on listening in IDE 3. Enable debug in browser 5. Walk through code in the IDE as it is executed 4. Load page in browser
  13. Configuration Options remote_enable Turn “on” to enable debugging Remote_host Set

    the host name or IP address of the debugging client computer. Can only have one value, so good way to lock down xdebug to only one user. Remote_connect_back Turn “on” to ignore the remote_host setting and connect back to any xdebug client. Useful if multiple developers are running from same debug server. Remote_port Set the port xdebug uses for communication. Default is 9000. Remote_mode Set to “req” to connect to debug client when code begins. Set to “jit” to connect to debut client only on failure.
  14. Tip: Map your code If you have two copies of

    code (local and server), make sure they are mapped in the IDE and in- sync. Otherwise, xdebug will lie to you.
  15. To show in demo ▪ Start / stop debug process

    ▪ Stepping through code ▪ Conditional break points ▪ Modifying values in running code
  16. End Notes Resources: xdebug.org www.thornview.com Presentation by: [email protected] Fonts: Sketchy

    - http://dl.dafont.com/dl/?f=sketchy DJB Chalk It Up - http://dl.dafont.com/dl/?f=djb_chalk_it_up Source Sans Pro - http://www.fontsquirrel.com/fonts/source-sans-pro