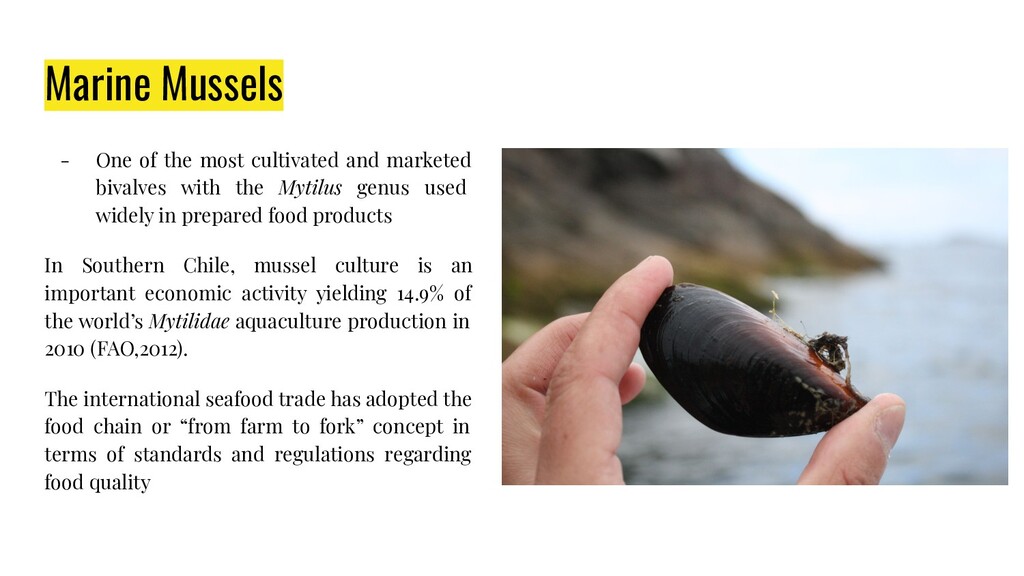
bivalves with the Mytilus genus used widely in prepared food products In Southern Chile, mussel culture is an important economic activity yielding 14.9% of the world’s Mytilidae aquaculture production in 2010 (FAO,2012). The international seafood trade has adopted the food chain or “from farm to fork” concept in terms of standards and regulations regarding food quality
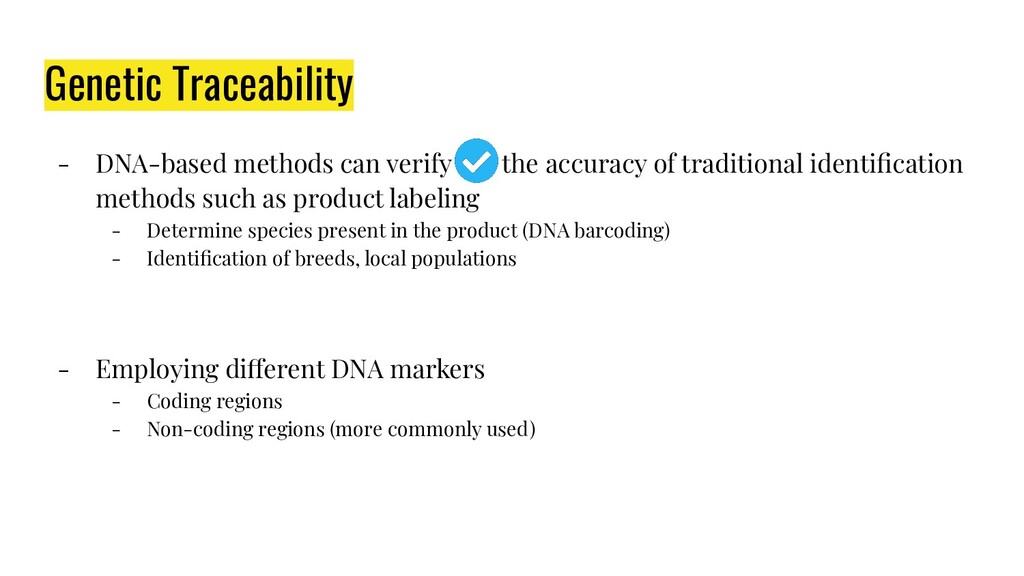
traditional identification methods such as product labeling - Determine species present in the product (DNA barcoding) - Identification of breeds, local populations - Employing different DNA markers - Coding regions - Non-coding regions (more commonly used)
commercial fraud by species substitution • PCR-based assays allows for identification of various Mytilus species ◦ RAPD (randomly amplified polymorphic DNA) ◦ FINS (forensically relevant nucleotide sequencing) ◦ AFLP (amplified fragment length polymorphisms
merely by identifying the species due to worldwide distribution of Mytilus • Equivalent to identifying its biological population (Ogden, 2008) • Various chemical markers have been used (trace elements coupled with volatile compound analysis) • DNA-based methods to study genetic diversity and population structure ◦ Allozymes ◦ Mitochondrial COI gene sequence ◦ SNPs ◦ Microsatellites
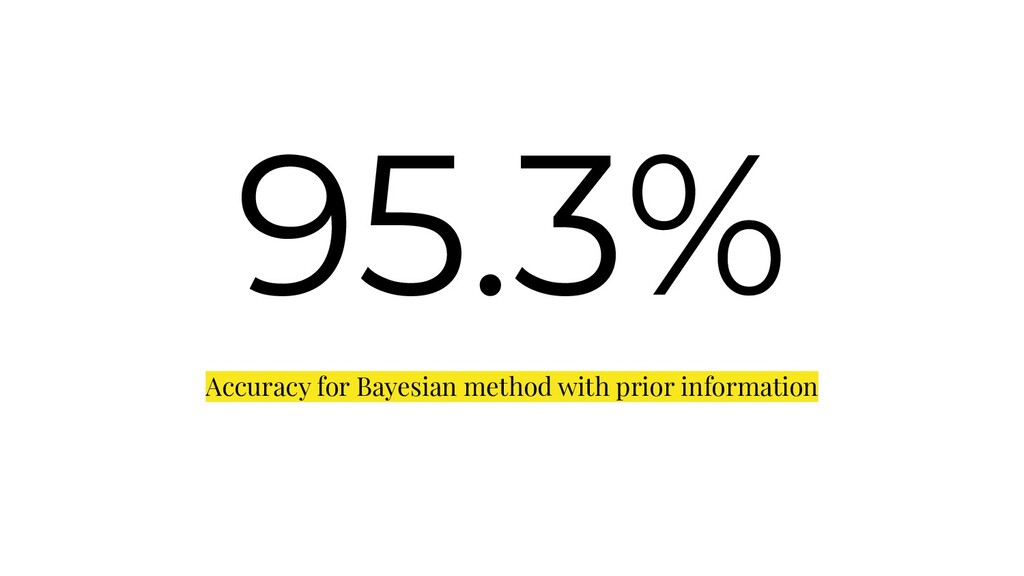
population (predefined) or cluster (non-predefined) membership of individuals • Frequentist or likelihood methods ◦ Frequentist - statistical hypothesis testing, giving a p value derived from a frequency distribution ◦ Likelihood - assumes that observed data arises from a probabilistic model with unknown parameters • Bayesian approach ◦ Derives the posterior distribution, taking into account prior probability and a likelihood function derived from the observed data, allowing for incorporation of existing knowledge into data analysis
(n=50 by location) were collected in Southern Chile in six sites (inc. 1 wild population and 5 seed collection centers) - DNA extraction by phenol-chloroform method - Amplification of 9 SSR loci - Genotyping: polyacrylamide gels (6%) with silver staining
presence of null alleles, stuttering and large allele dropout • GENEPOP 4.0.10 - used to test for Hardy Weinberg equilibrium and estimate Wright’s fixation index (FST )
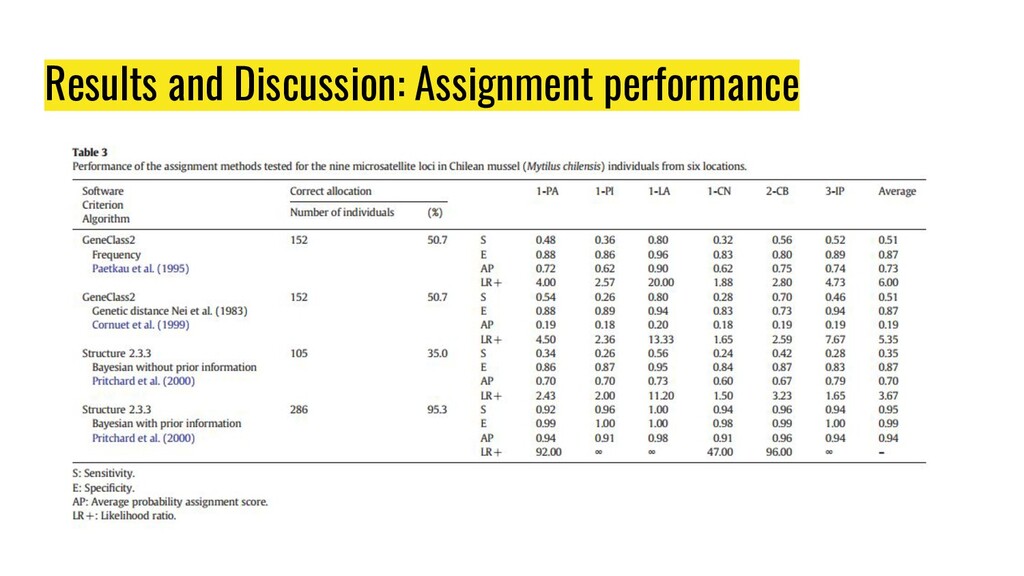
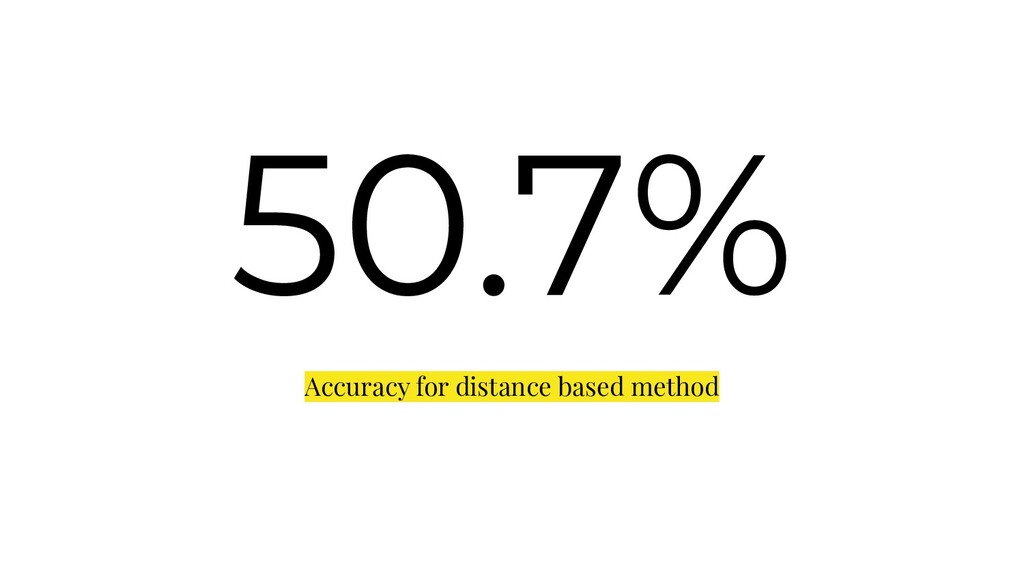
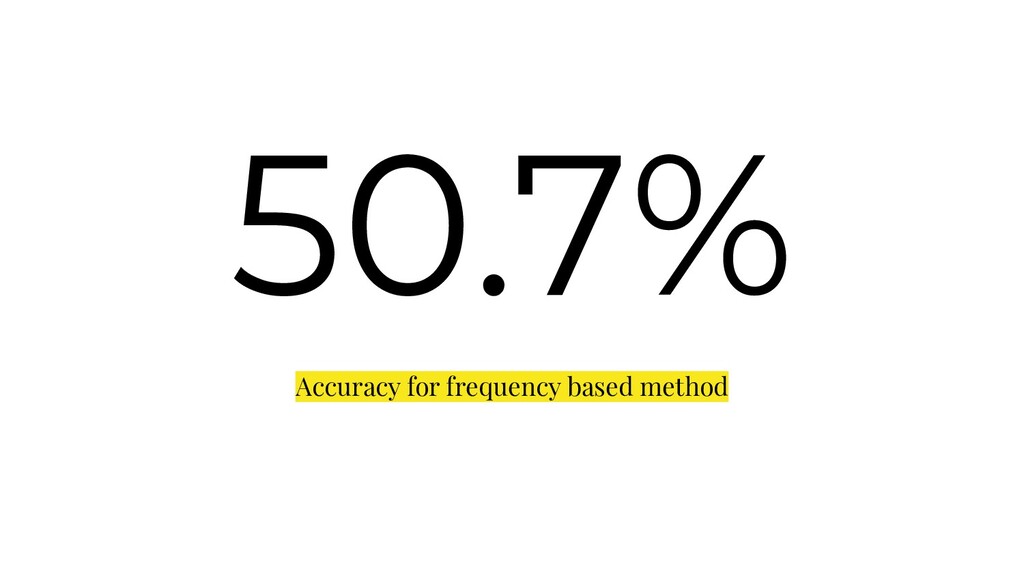
possible origin of individuals: • Genetic distance-based criterion • Frequency-based method • Bayesian-based method - operating in an “unsupervised” mode • Bayesian-based method - operating in a “supervised” mode
allele frequency - assigning a population of origin for each individual • Structure 2.3.3 - used for Bayesian method - assignment of individuals were conducted under the mixture model - 50,000 initial burn-in, 100,000 Markov chain iterations - K = 6
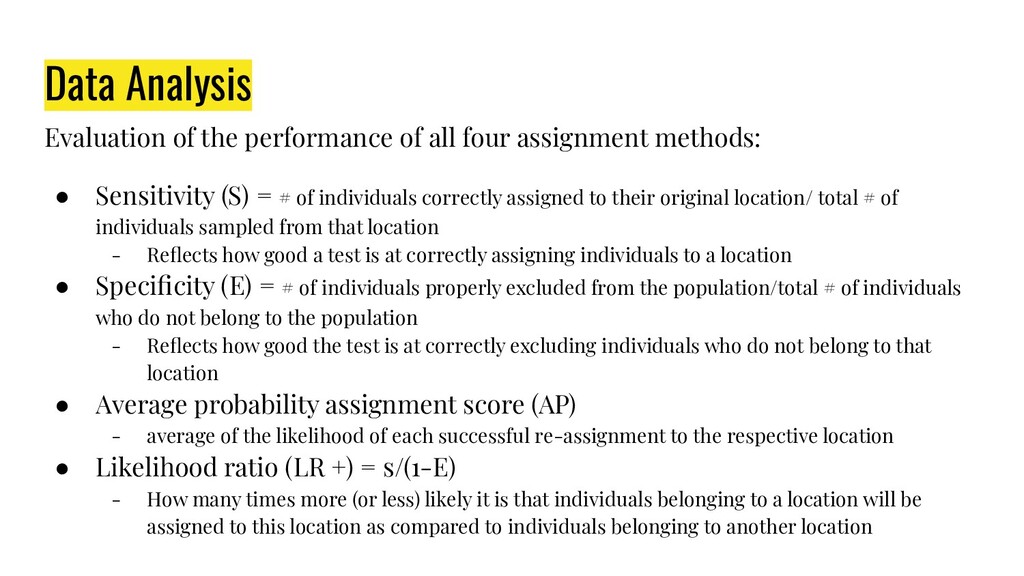
methods: • Sensitivity (S) = # of individuals correctly assigned to their original location/ total # of individuals sampled from that location - Reflects how good a test is at correctly assigning individuals to a location • Specificity (E) = # of individuals properly excluded from the population/total # of individuals who do not belong to the population - Reflects how good the test is at correctly excluding individuals who do not belong to that location • Average probability assignment score (AP) - average of the likelihood of each successful re-assignment to the respective location • Likelihood ratio (LR +) = s/(1-E) - How many times more (or less) likely it is that individuals belonging to a location will be assigned to this location as compared to individuals belonging to another location
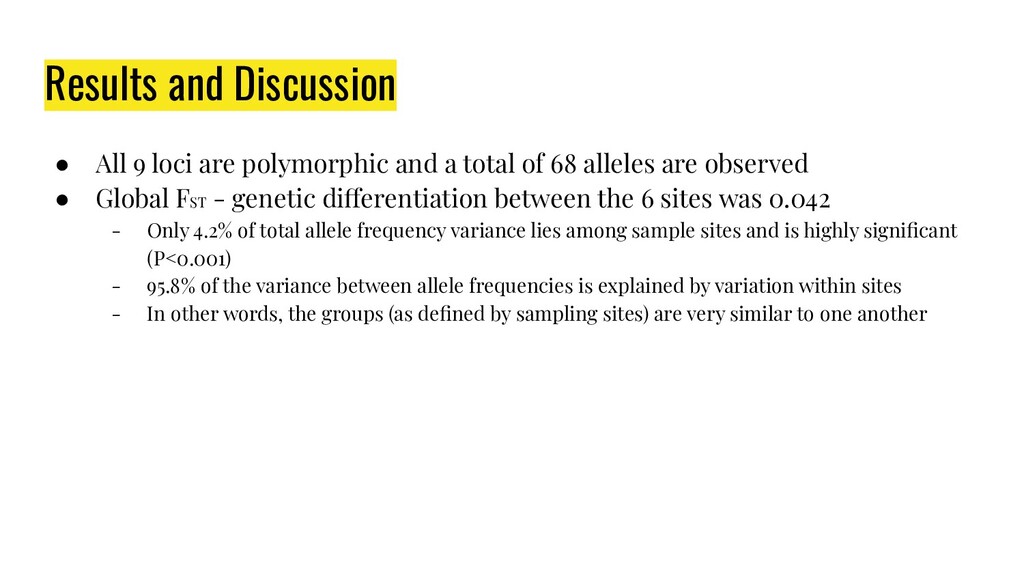
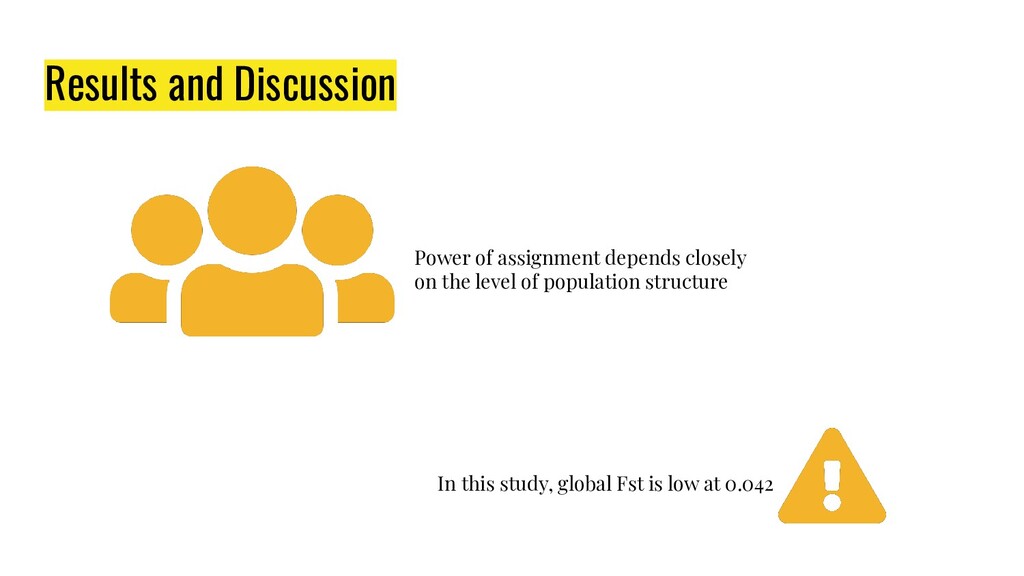
a total of 68 alleles are observed • Global FST - genetic differentiation between the 6 sites was 0.042 - Only 4.2% of total allele frequency variance lies among sample sites and is highly significant (P<0.001) - 95.8% of the variance between allele frequencies is explained by variation within sites - In other words, the groups (as defined by sampling sites) are very similar to one another
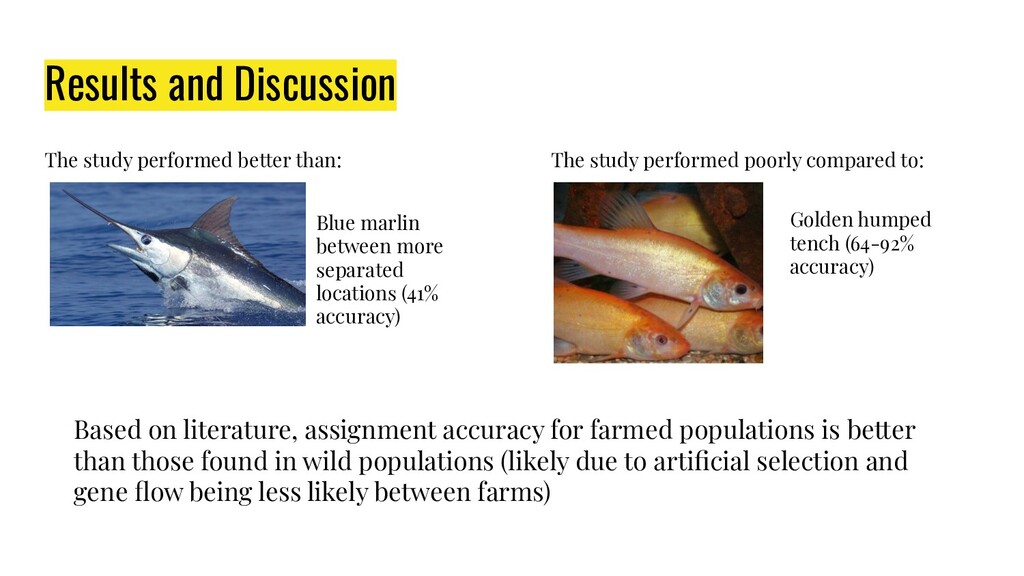
performed poorly compared to: Blue marlin between more separated locations (41% accuracy) Golden humped tench (64-92% accuracy) Based on literature, assignment accuracy for farmed populations is better than those found in wild populations (likely due to artificial selection and gene flow being less likely between farms)
matching Mytilus individuals from Southern Chile to their geographical origin - 50% of correct assignment in a challenging scenario with low genetic differentiation among locations (Global Fst = 0.042)