Upgrade to Pro — share decks privately, control downloads, hide ads and more …

Request Tracing in Cassandra

Request Tracing in Cassandra

A quick talk on using tracing in Cassandra given at the 01/05/2015 MSP Cassandra Meetup (http://www.meetup.com/Minneapolis-St-Paul-Cassandra-Meetup/events/218752010/)

Andrew Tolbert

January 05, 2015
Tweet

More Decks by Andrew Tolbert

Other Decks in Programming

Transcript

  1. Request Tracing ✲ Tracks what happens in Cassandra to complete

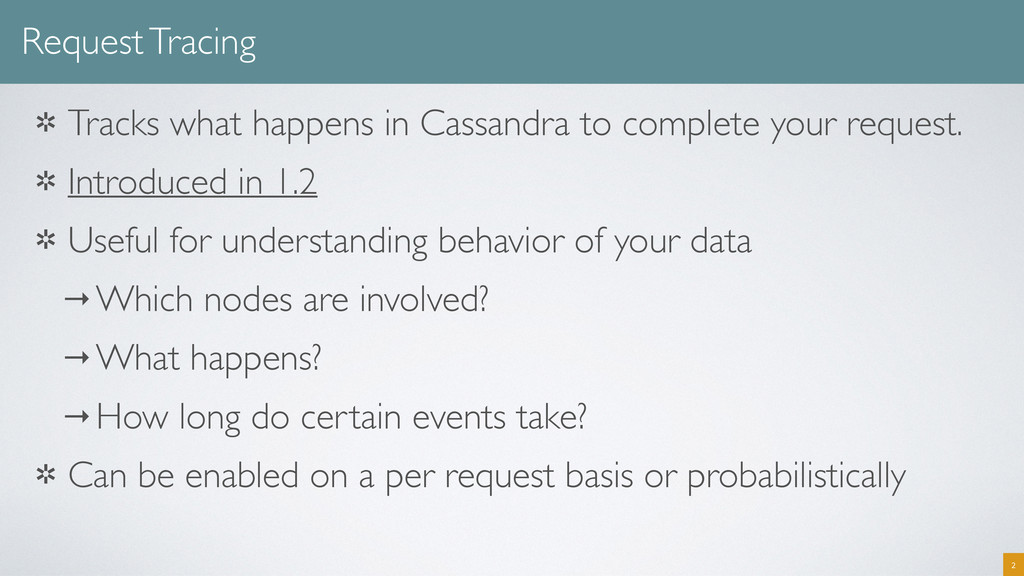
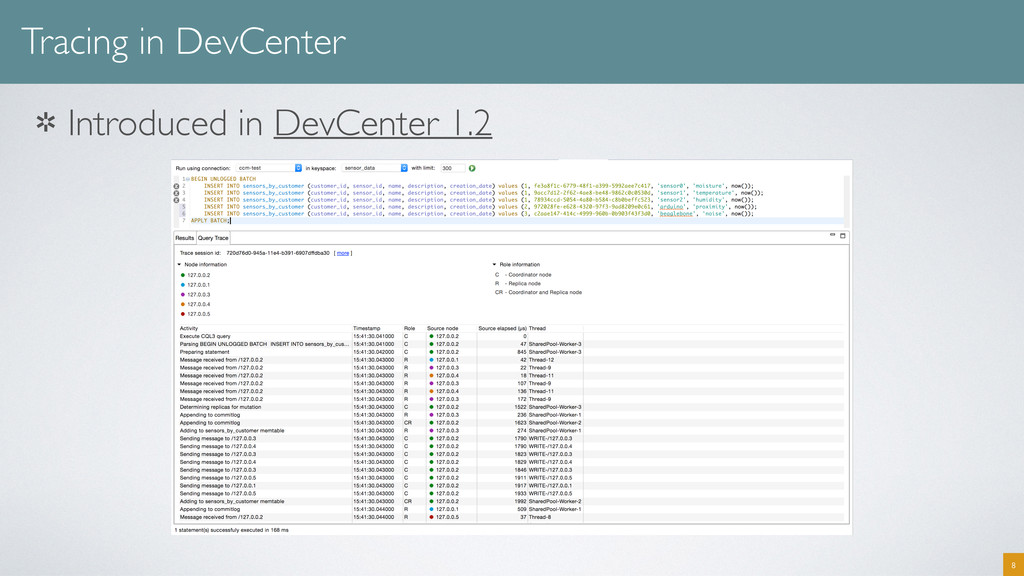
    your request. ✲ Introduced in 1.2 ✲ Useful for understanding behavior of your data →Which nodes are involved? →What happens? →How long do certain events take? ✲ Can be enabled on a per request basis or probabilistically 2
  2. Enabling via Nodetool ✲ settraceprobability - probabilistically enables request tracing.

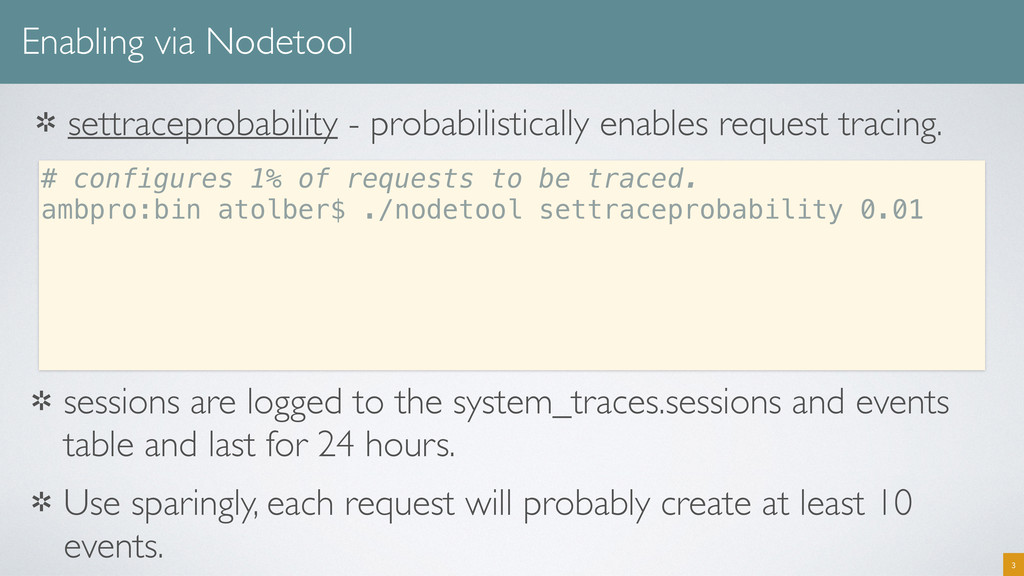
    # configures 1% of requests to be traced. ambpro:bin atolber$ ./nodetool settraceprobability 0.01 3 ✲ sessions are logged to the system_traces.sessions and events table and last for 24 hours. ✲ Use sparingly, each request will probably create at least 10 events.
  3. system_traces.sessions ✲ Shows captured requests →What coordinator executed them →When

    they ran (started_at) →How long they took (duration - microseconds) →session_id is used to look up events. 4 cqlsh> select * from system_traces.sessions; session_id | coordinator | duration | parameters | request | started_at --------------------------------------+-------------+----------+--------------------------------------------------------------------|--------------------|------------------------- 3b28d850-944e-11e4-b391-6907dffdba30 | 127.0.0.2 | 116573 | {'query': 'create keyspace if not exists "sensor_data”\.. | Execute CQL3 query | 2015-01-04 14:14:04-0600 3c5857a1-944e-11e4-b391-6907dffdba30 | 127.0.0.2 | 1225 | {'query': 'SELECT schema_version FROM system.local WHERE key='...} | Execute CQL3 query | 2015-01-04 14:14:06-0600 3bda26f0-944e-11e4-b391-6907dffdba30 | 127.0.0.2 | 2411 | {'query': 'SELECT peer, rpc_address, schema_version FROM syste.... | Execute CQL3 query | 2015-01-04 14:14:06-0600 408c1640-944e-11e4-b391-6907dffdba30 | 127.0.0.2 | 202429 | {'query': 'create table if not exists "sensors_by_customer (cus... | Execute CQL3 query | 2015-01-04 14:14:13-0600 448f7610-944e-11e4-b391-6907dffdba30 | 127.0.0.2 | 139 | {'query': 'USE "sensor_data"'} | Execute CQL3 query | 2015-01-04 14:14:20-0600 448f7613-944e-11e4-b391-6907dffdba30 | 127.0.0.2 | 4539 | {'query': 'BEGIN UNLOGGED BATCH\n\tINSERT INTO sensors... | Execute CQL3 query | 2015-01-04 14:14:20-0600 4799cfe0-944e-11e4-b391-6907dffdba30 | 127.0.0.2 | 2329 | {'query': 'select * from sensors_by_customer where customer_id=1'} | Execute CQL3 query | 2015-01-04 14:14:25-0600 4ab5dcf0-944e-11e4-b391-6907dffdba30 | 127.0.0.2 | 4926 | {'query': 'select * from sensors_by_customer\nLIMIT 300'} | Execute CQL3 query | 2015-01-04 14:14:30-0600
  4. system_traces.events ✲ Shows all events captured for a given request

    session. → What happened (activity) → Where it happened (source, thread) → How long it took (source_elapsed) 5 cqlsh> select activity,source,source_elapsed,thread from system_traces.events where session_id=4ab5dcf0-944e-11e4-b391-6907dffdba30; activity | source | source_elapsed | thread ------------------------------------------------------------------------------------------------+-----------+----------------+--------------------- Parsing select * from sensors_by_customer\nLIMIT 300 | 127.0.0.2 | 38 | SharedPool-Worker-3 Preparing statement | 127.0.0.2 | 130 | SharedPool-Worker-3 Computing ranges to query | 127.0.0.2 | 264 | SharedPool-Worker-3 Submitting range requests on 5 ranges with a concurrency of 1 (0.0 rows per range expected) | 127.0.0.2 | 397 | SharedPool-Worker-3 Enqueuing request to /127.0.0.4 | 127.0.0.2 | 731 | SharedPool-Worker-3 Submitted 1 concurrent range requests covering 3 ranges | 127.0.0.2 | 754 | SharedPool-Worker-3 Sending message to /127.0.0.4 | 127.0.0.2 | 1108 | WRITE-/127.0.0.4 Message received from /127.0.0.2 | 127.0.0.4 | 19 | Thread-11 Executing seq scan across 0 sstables for [min(-9223372036854775808), max(1844674407370955161)] | 127.0.0.4 | 214 | SharedPool-Worker-1 Read 3 live and 0 tombstoned cells | 127.0.0.4 | 457 | SharedPool-Worker-1 Scanned 1 rows and matched 1 | 127.0.0.4 | 508 | SharedPool-Worker-1 Enqueuing response to /127.0.0.2 | 127.0.0.4 | 592 | SharedPool-Worker-1 Sending message to /127.0.0.2 | 127.0.0.4 | 683 | WRITE-/127.0.0.2 Message received from /127.0.0.4 | 127.0.0.2 | 4374 | Thread-6 Processing response from /127.0.0.4 | 127.0.0.2 | 4446 | SharedPool-Worker-1 Submitted 1 concurrent range requests covering 2 ranges | 127.0.0.2 | 4637 | SharedPool-Worker-3 Executing seq scan across 0 sstables for (max(1844674407370955161), min(-9223372036854775808)] | 127.0.0.2 | 4715 | SharedPool-Worker-4 Scanned 0 rows and matched 0 | 127.0.0.2 | 4805 | SharedPool-Worker-4 (18 rows)
  5. cqlsh > TRACING ON; ✲ settraceprobability is nice, but what

    if you just want to see what happens for a given query? ✲ TRACING ON; in cqlsh will log the trace events in a nice format after each query is executed. 6 cqlsh> TRACING ON; Now tracing requests. cqlsh> select * from sensor_data.sensors_by_customer where customer_id=1; customer_id | sensor_id | creation_date | description | name -------------+--------------------------------------+--------------------------------------+-------------+--------- 1 | 78934ccd-5054-4a80-b584-c8b0beffc523 | 448fc432-944e-11e4-b391-6907dffdba30 | humidity | sensor2 ... (3 rows) Tracing session: 38dc56a0-9456-11e4-80d7-6907dffdba30 activity | timestamp | source | source_elapsed --------------------------------------------------------------------------------------------------------------+----------------------------+-----------+---------------- Execute CQL3 query | 2015-01-04 15:11:17.002000 | 127.0.0.1 | 0 Parsing select * from sensor_data.sensors_by_customer where customer_id=1 LIMIT 10000; [SharedPool-Worker-1] | 2015-01-04 15:11:17.002000 | 127.0.0.1 | 65 ... Sending message to /127.0.0.4 [WRITE-/127.0.0.4] | 2015-01-04 15:11:17.003000 | 127.0.0.1 | 1138 Message received from /127.0.0.1 [Thread-12] | 2015-01-04 15:11:17.003000 | 127.0.0.4 | 57 Sending message to /127.0.0.3 [WRITE-/127.0.0.3] | 2015-01-04 15:11:17.003000 | 127.0.0.1 | 1150 Message received from /127.0.0.1 [Thread-10] | 2015-01-04 15:11:17.004000 | 127.0.0.3 | 68 Executing single-partition query on sensors_by_customer [SharedPool-Worker-1] | 2015-01-04 15:11:17.004000 | 127.0.0.4 | 415 ... Enqueuing response to /127.0.0.1 [SharedPool-Worker-1] | 2015-01-04 15:11:17.004001 | 127.0.0.4 | 852 Message received from /127.0.0.4 [Thread-9] | 2015-01-04 15:11:17.005000 | 127.0.0.1 | 3659 Executing single-partition query on sensors_by_customer [SharedPool-Worker-1] | 2015-01-04 15:11:17.005000 | 127.0.0.3 | 542 Sending message to /127.0.0.1 [WRITE-/127.0.0.1] | 2015-01-04 15:11:17.005000 | 127.0.0.4 | 1115 ... Sending message to /127.0.0.1 [WRITE-/127.0.0.1] | 2015-01-04 15:11:17.005001 | 127.0.0.3 | 1261 Processing response from /127.0.0.4 [SharedPool-Worker-4] | 2015-01-04 15:11:17.006000 | 127.0.0.1 | 4611 Message received from /127.0.0.3 [Thread-8] | 2015-01-04 15:11:17.007000 | 127.0.0.1 | 4926 Processing response from /127.0.0.3 [SharedPool-Worker-3] | 2015-01-04 15:11:17.007000 | 127.0.0.1 | 4964 Request complete | 2015-01-04 15:11:17.007435 | 127.0.0.1 | 5435
  6. Tracing with a Driver ✲ Can be activated in the

    Datastax drivers on a per query basis. ✲ Useful as the driver be configured in different ways (load balancing policy, consistency, etc.) which impact behavior. 7 // Java Driver Example Query insert = QueryBuilder.insertInto("simplex", "songs") .value("id", UUID.randomUUID()) .value("title", "Golden Brown") .value("album", "La Folie") .value("artist", "The Stranglers") .setConsistencyLevel(ConsistencyLevel.ONE).enableTracing(); ResultSet results = getSession().execute(insert); ExecutionInfo executionInfo = results.getExecutionInfo(); System.out.printf( "Host (queried): %s\n", executionInfo.getQueriedHost().toString() ); for (Host host : executionInfo.getTriedHosts()) { System.out.printf( "Host (tried): %s\n", host.toString() ); } QueryTrace queryTrace = executionInfo.getQueryTrace(); System.out.printf("Trace id: %s\n\n", queryTrace.getTraceId()); System.out.println("---------------------------------------+--------------+------------+--------------"); for (QueryTrace.Event event : queryTrace.getEvents()) { System.out.printf("%38s | %12s | %10s | %12s\n", event.getDescription(), millis2Date(event.getTimestamp()), event.getSource(), event.getSourceElapsedMicros()); }
  7. Example Use Cases ✲ Measuring Impact of: →Using different Consistency

    Levels →Having a lot of Deleted/Expired Data (tombstones) →Very Wide Partitions →Bloom Filter Configuration →Secondary Indexes ✲ Cross Datacenter considerations ✲ Understanding anti-patterns (Queues, Cross-Partition Batching) 9
  8. Quick Demonstration: Secondary Indexes vs Denormalization ✲ Working with MLB

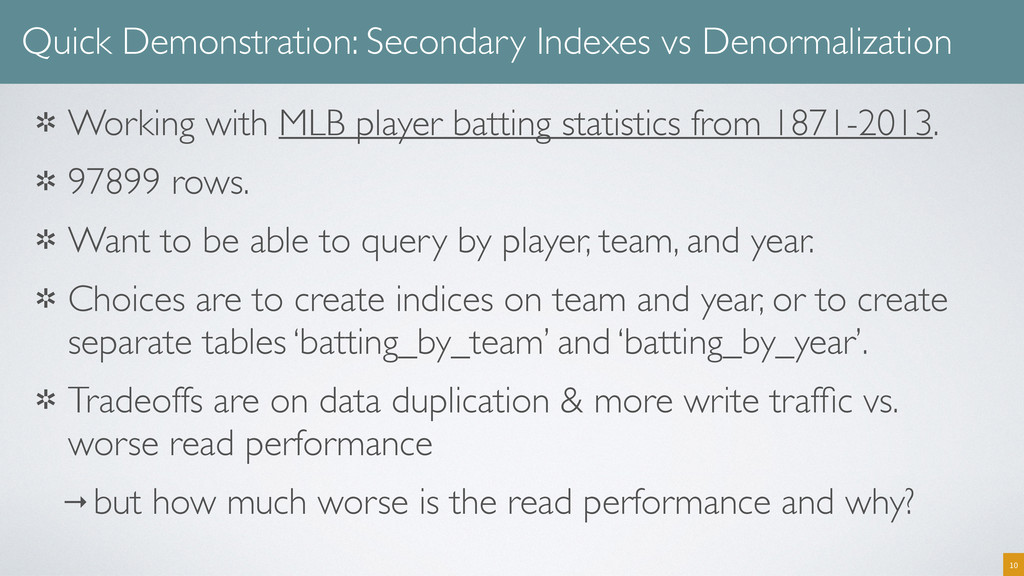
    player batting statistics from 1871-2013. ✲ 97899 rows. ✲ Want to be able to query by player, team, and year. ✲ Choices are to create indices on team and year, or to create separate tables ‘batting_by_team’ and ‘batting_by_year’. ✲ Tradeoffs are on data duplication & more write traffic vs. worse read performance →but how much worse is the read performance and why? 10