Upgrade to Pro — share decks privately, control downloads, hide ads and more …

Tech Talk Performance 2021 of Merpay Frontend

toshick
August 04, 2021
97

Tech Talk Performance 2021 of Merpay Frontend

Tech talk doc of our actions on frontend performance

toshick

August 04, 2021
Tweet

Transcript

  1. 2 Frontend Engineer, Merpay
 
 - Joined to Merpay on

    March 2020
 - Like Vue, Nuxt, (Svelte? Learning now)
 - A Capoeirista.
 
 Toshick of the world

  2. 4 Performance and Web Vitals Jakob Nielsen Says I Say

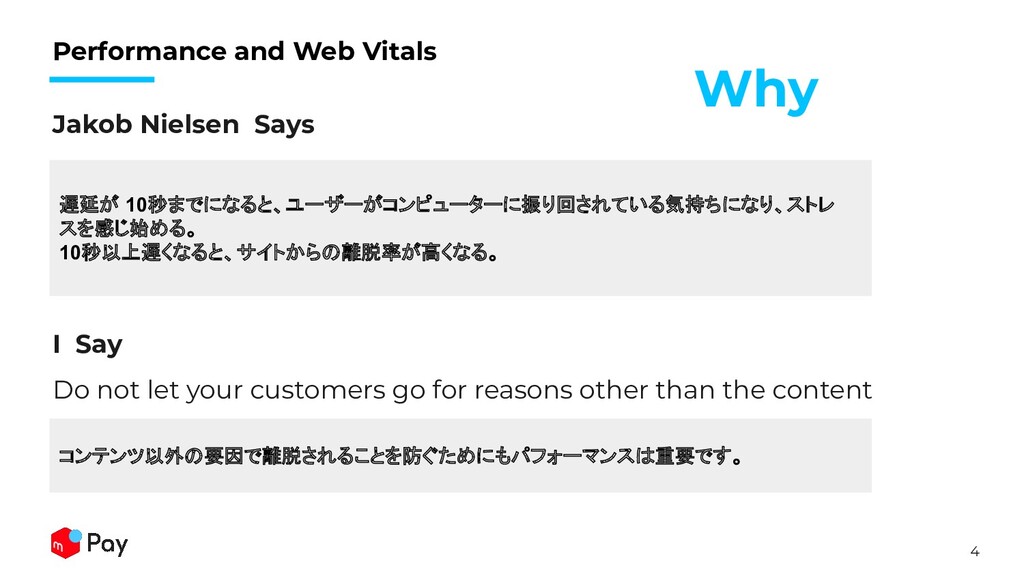
    Do not let your customers go for reasons other than the content 遅延が 10秒までになると、ユーザーがコンピューターに振り回されている気持ちになり、ストレ スを感じ始める。 10秒以上遅くなると、サイトからの離脱率が高くなる。 コンテンツ以外の要因で離脱されることを防ぐためにもパフォーマンスは重要です。 Why
  3. 5 Performance and Web Vitals We need to provide information

    the customer wants without any annoying experience. How Can we prove that?
  4. 6 Performance and Web Vitals https://web.dev/vitals/ Web Vitals is an

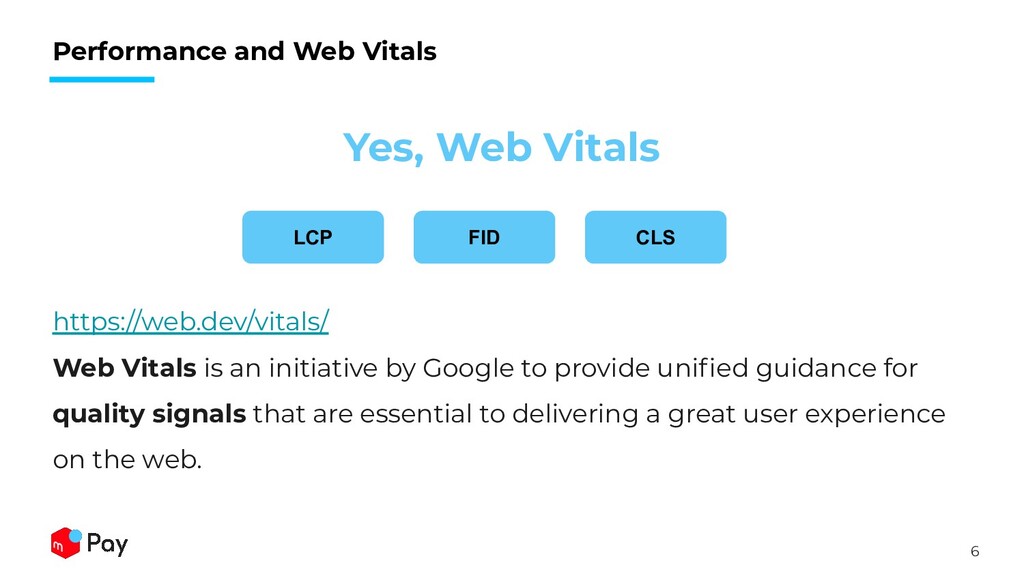
    initiative by Google to provide unified guidance for quality signals that are essential to delivering a great user experience on the web. Yes, Web Vitals LCP FID CLS
  5. 8 We have decided to check these 4 metrics LCP

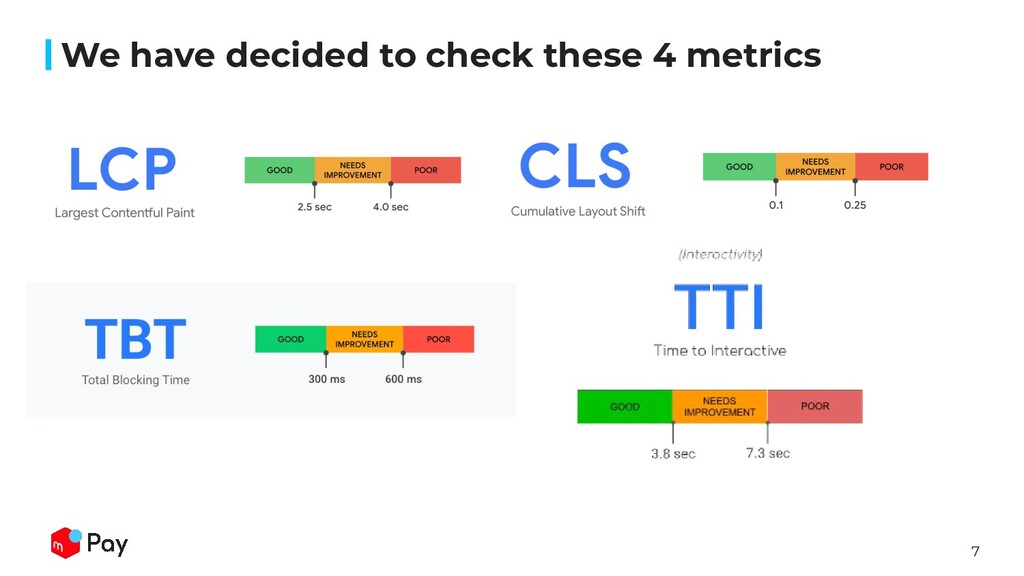
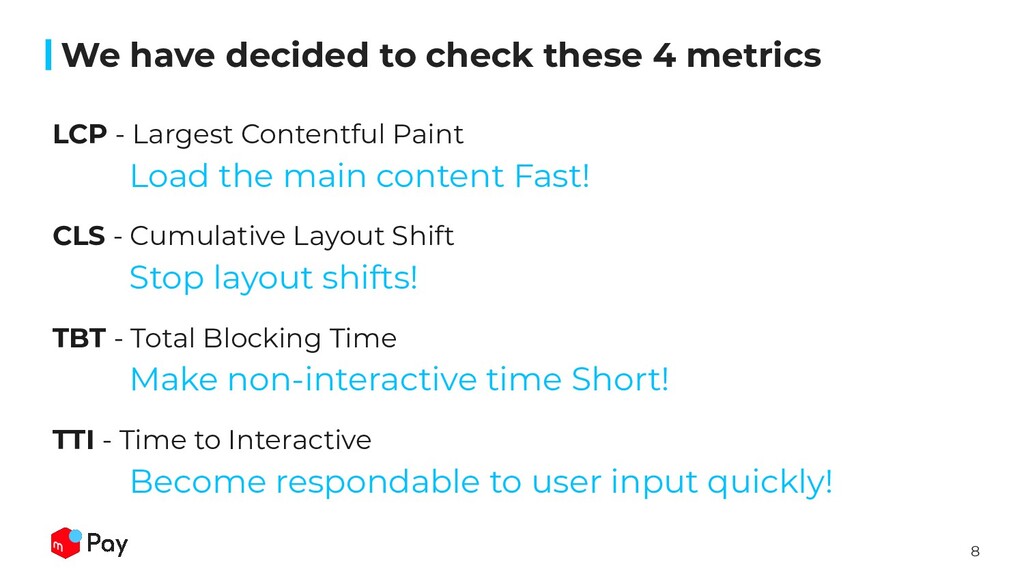
    - Largest Contentful Paint Load the main content Fast! CLS - Cumulative Layout Shift Stop layout shifts! TBT - Total Blocking Time Make non-interactive time Short! TTI - Time to Interactive Become respondable to user input quickly!
  6. 9 Why we do not target FID? Tools like Lighthouse

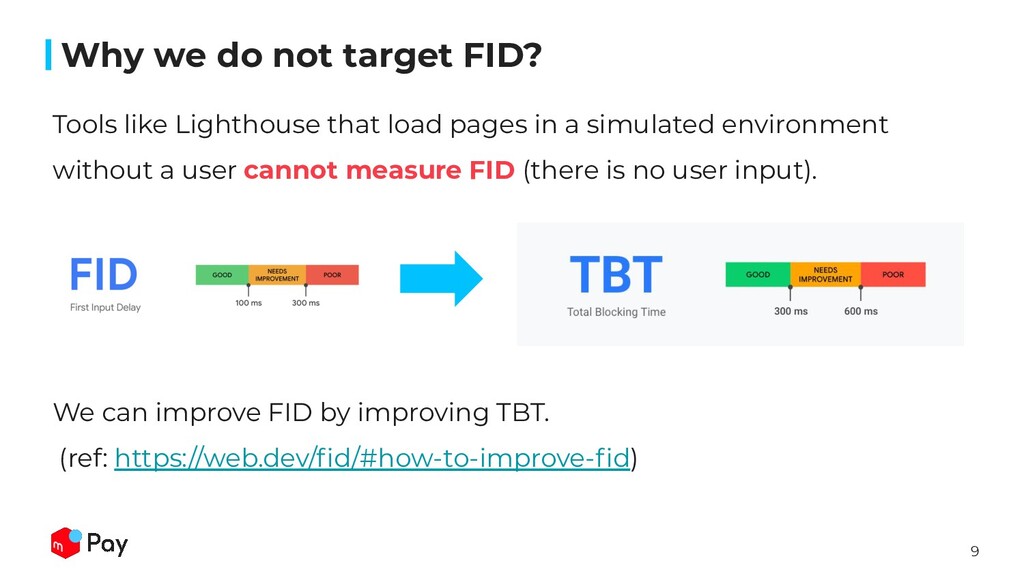
    that load pages in a simulated environment without a user cannot measure FID (there is no user input). We can improve FID by improving TBT. (ref: https://web.dev/fid/#how-to-improve-fid)
  7. 10 Visualizing our Performance by Looker We make graphs by

    script corresponding to each url that we want to check. LCP TBT CLS TTI
  8. 11 Visualizing our Performance by Looker Store data nightly by

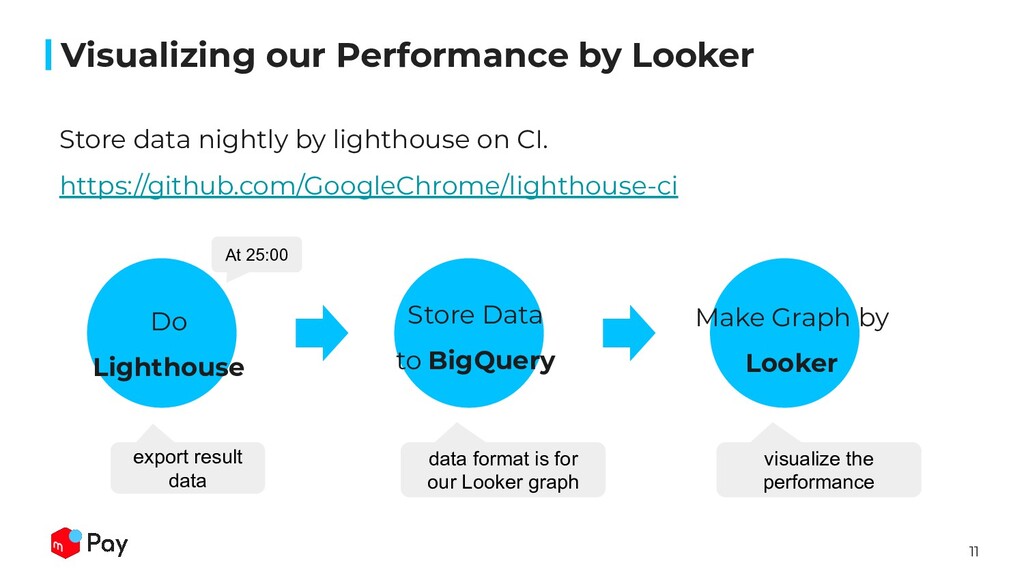
    lighthouse on CI. https://github.com/GoogleChrome/lighthouse-ci Do Lighthouse Store Data to BigQuery Make Graph by Looker At 25:00 export result data data format is for our Looker graph visualize the performance
  9. 12 Visualizing our Performance by Looker We create the Lighthouse

    data format for Looker. (by cherry picking) { "id": "first-contentful-paint", "title": "First Contentful Paint", "description": "....", "score": 1, "scoreDisplayMode": "numeric", "numericValue": 1262.196, "numericUnit": "millisecond", "displayValue": "1.3 s" }, { "id": "total-blocking-time", ... }, ... ↓ significant params for graph score 100% score (0-1) numericValue real value data from lighthouse
  10. 13 Visualizing our Performance by Looker The blue bar represents

    100% score which means how healthy the vitals are. The red line represents the absolute score of each metrics calculated by lighthouse
  11. 14 Visualizing our Performance by Looker The horizontal lines are

    standard scores from web vital team. We aim for all 4 metrics to reach the green line in absolute score.
  12. 15 Compare two graphs We can not say the trial

    improvement worked or not from just 1 or 2 times results. The result is swaying. My Improvement worked! TBT time has reduced! ?
  13. 16 Compare two graphs We compare the result of a

    week. In Merpay, We can create multiple app versions in Test environment. Original Trial
  14. 17 Next Actions Gather Best Practices and Share Watch PayLoad

    Size To Prevent Performance Down Analyze Customer behavior by Performance aspect Check User Input Performance like FID 02 03 04 01
  15. 18 We need more people who is interested in Perf

    Improvement Thank you! Welcome