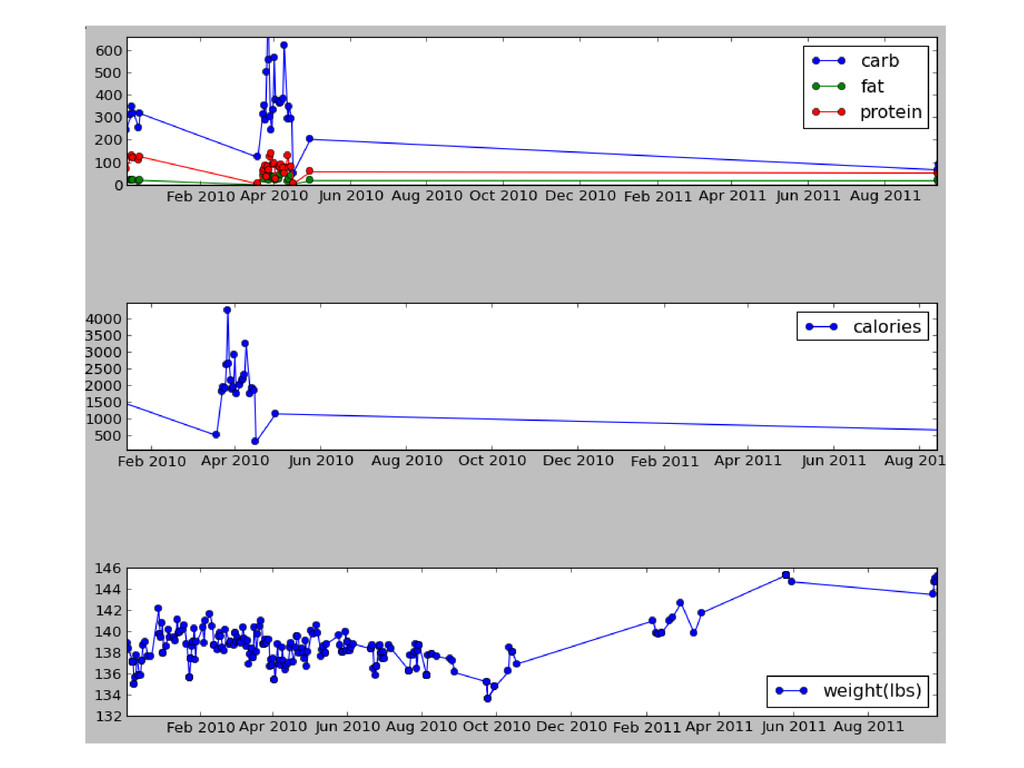
alter it results in measurable change. • Start tracking, weight goes down without conscious effort. • Stop tracking/ track sporadically and weight goes up.
days with gymnastics workouts • Number of repetitions of skill-based exercises greatly increased • Currently trying refined version of the experiment where only carbs are cycled but calories kept as close to constant as possible
• Flickr • Python code available here: – https://github.com/trtg – Writeups (in progress) at my octopress blog here: • http://trtg.github.com/ • Older projects here: http://www.keyboardmods.com