Upgrade to Pro
— share decks privately, control downloads, hide ads and more …
Speaker Deck
Features
Speaker Deck
PRO
Sign in
Sign up for free
Search
Search
Analytics for Developers
Search
Trent Hauck
May 05, 2013
Programming
420
1
Share
Embed
Copy iframe code
Copy JS code
Copy link
Start on current slide
Analytics for Developers
A talk I gave at Kansas City Developer Conference 2013.
Trent Hauck
May 05, 2013
Other Decks in Programming
See All in Programming
RTSPクライアントを自作してみた話
simotin13
0
610
Vite+ Unified Toolchain for the Web
naokihaba
0
320
メソッドのジェネリクスでGoの夢は広がるか? / Kyoto.go #65
utgwkk
3
800
コンテキストの使い捨てをやめる — ビジネスルール駆動開発と miko —
ioki
0
210
The NotImplementedError Problem in Ruby
koic
1
810
Spring Security 実践 ─ GraphQL APIで実務に役立つ 認証・認可 を学ぶ
wagyu
0
240
JavaDoc 再入門
nagise
1
360
軽量Java基盤の設計 DIコンテナに頼らない、長期保守と1秒起動の実現 JJUG CCC 2026 Spring
macha64
0
540
Semantic Version 単位で戦略を柔軟に変えて、パッケージアップデートを自動化する
daitasu
1
240
スマートグラスで並列バイブコーディング
hyshu
0
150
生成AI時代にこそ効くGo | Why Go Works in the Age of Generative AI
mom0tomo
8
3.2k
Vue × Nuxt × Oxc どこまで使える?実運用の現在地
andpad
0
260
Featured
See All Featured
Deep Space Network (abreviated)
tonyrice
0
170
Reality Check: Gamification 10 Years Later
codingconduct
0
2.2k
Improving Core Web Vitals using Speculation Rules API
sergeychernyshev
21
1.5k
[RailsConf 2023] Rails as a piece of cake
palkan
59
6.7k
Game over? The fight for quality and originality in the time of robots
wayneb77
1
200
Making Projects Easy
brettharned
120
6.7k
Navigating the moral maze — ethical principles for Al-driven product design
skipperchong
2
390
How to Grow Your eCommerce with AI & Automation
katarinadahlin
PRO
1
210
SEO Brein meetup: CTRL+C is not how to scale international SEO
lindahogenes
1
2.7k
HTML-Aware ERB: The Path to Reactive Rendering @ RubyCon 2026, Rimini, Italy
marcoroth
1
200
BBQ
matthewcrist
89
10k
Skip the Path - Find Your Career Trail
mkilby
1
150
Transcript
Analytics for Developers and Developing for Analytics
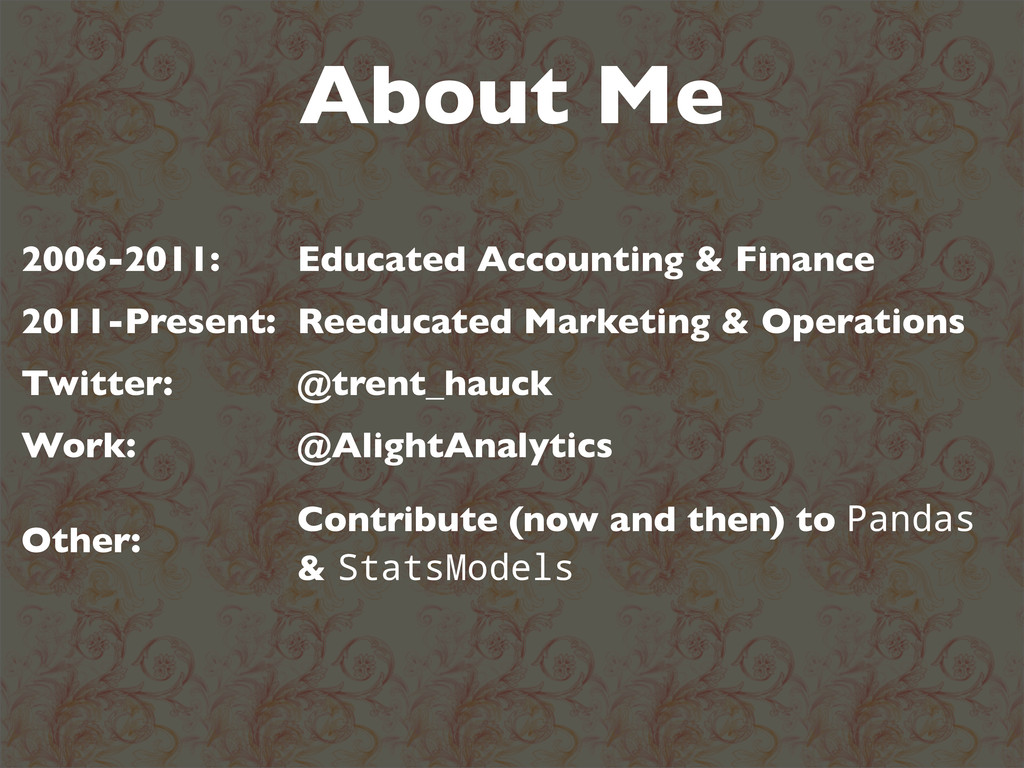
About Me 2006-2011: Educated Accounting & Finance 2011-Present: Reeducated Marketing
& Operations Twitter: @trent_hauck Work: @AlightAnalytics Other: Contribute (now and then) to Pandas & StatsModels
Two Parts Analytics (more) Development (less)
Why should you care?
“In God we trust; all others must bring data.”
To do analytics you need x
Where x is data collection...
Site Analytics Should be a 1st Class Citizen of Development
Collect More Than You Need Now
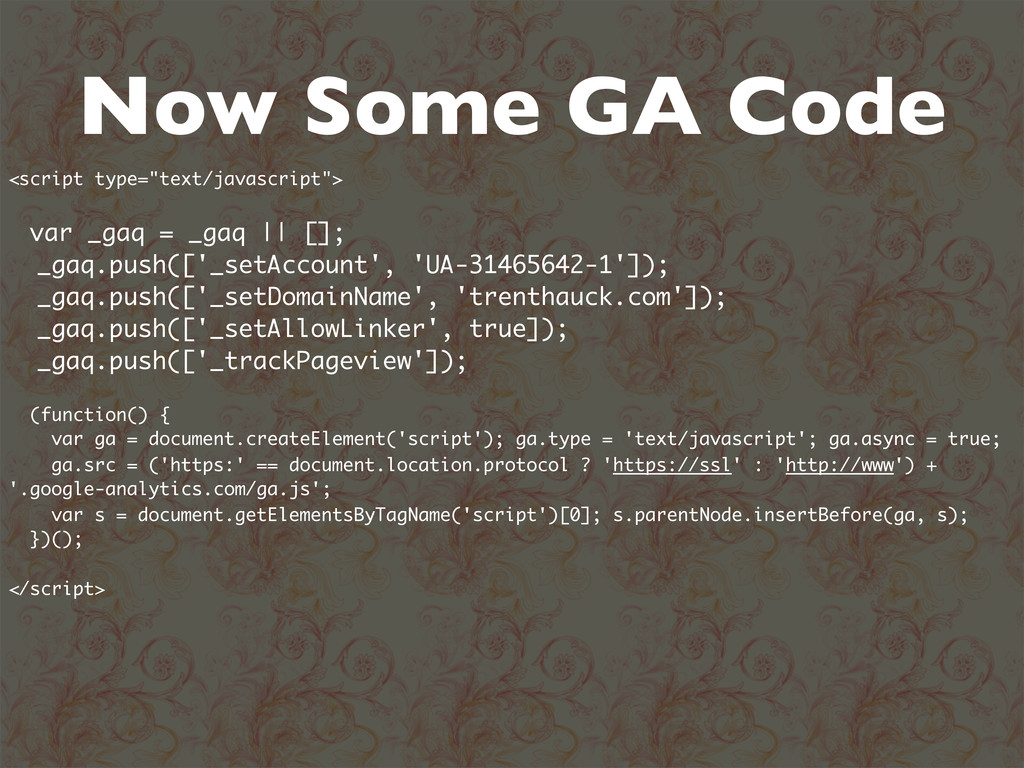
Now Some GA Code <script type="text/javascript"> var _gaq = _gaq
|| []; _gaq.push(['_setAccount', 'UA-31465642-1']); _gaq.push(['_setDomainName', 'trenthauck.com']); _gaq.push(['_setAllowLinker', true]); _gaq.push(['_trackPageview']); (function() { var ga = document.createElement('script'); ga.type = 'text/javascript'; ga.async = true; ga.src = ('https:' == document.location.protocol ? 'https://ssl' : 'http://www') + '.google-analytics.com/ga.js'; var s = document.getElementsByTagName('script')[0]; s.parentNode.insertBefore(ga, s); })(); </script>
Next Steps Events _gaq.push(['_trackEvent', 'Cat', 'Act', ‘Label’]); Custom Variables _gaq.push(['_setCustomVar',
1, ‘key’, ‘value’, 1])
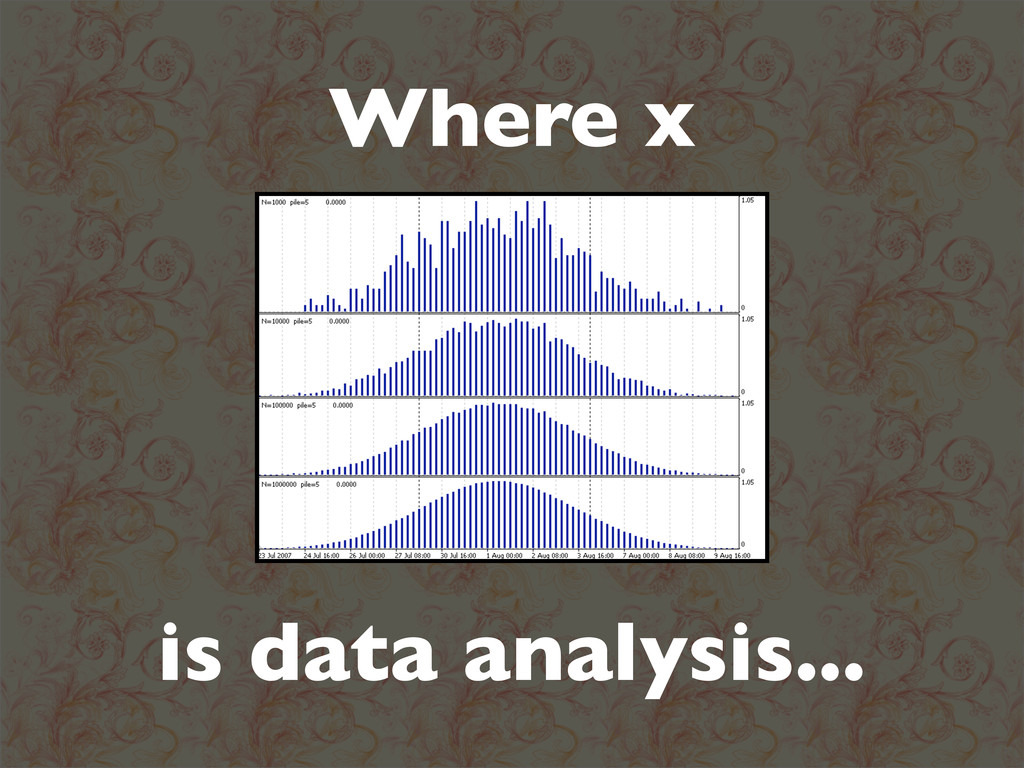
Where x is data analysis...
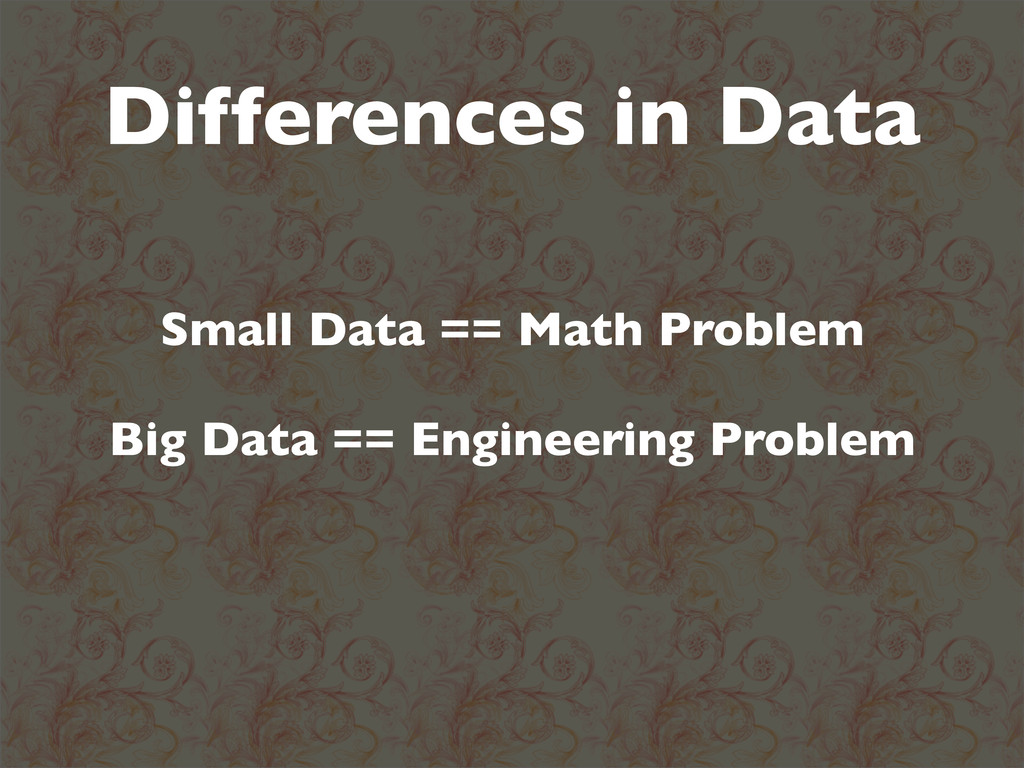
Differences in Data Small Data == Math Problem Big Data
== Engineering Problem
The Math Problem
Descriptive Stats (please compute these) Max, Min Quartiles Mean Variance
Mode
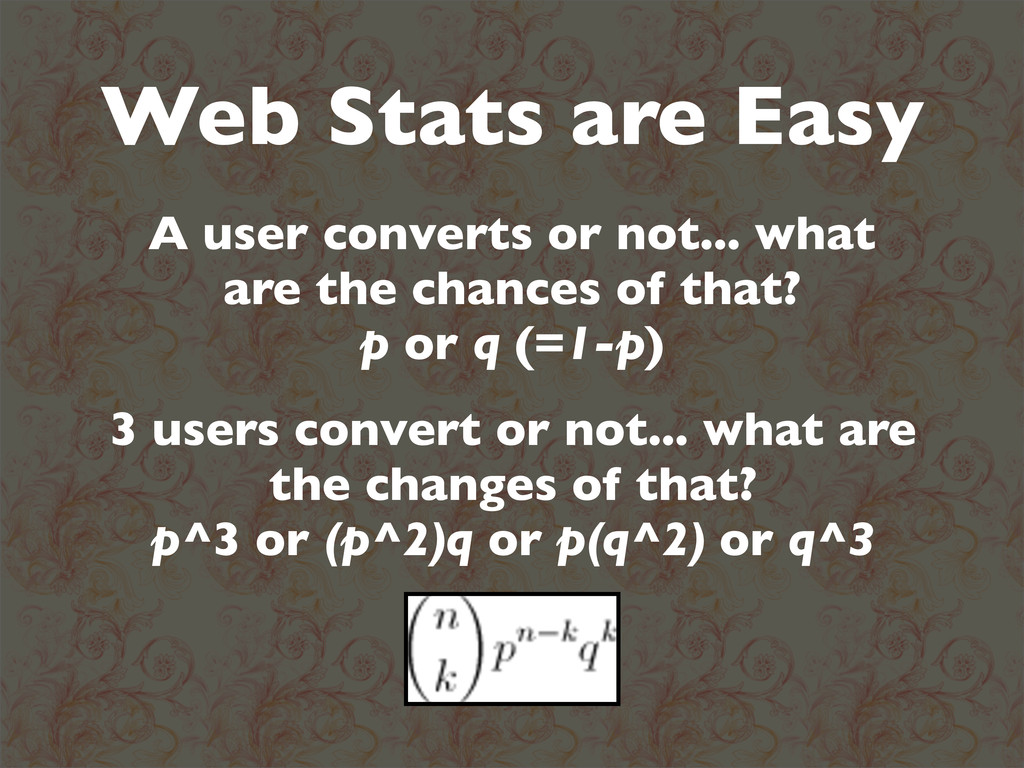
Web Stats are Easy A user converts or not... what
are the chances of that? p or q (=1-p) 3 users convert or not... what are the changes of that? p^3 or (p^2)q or p(q^2) or q^3
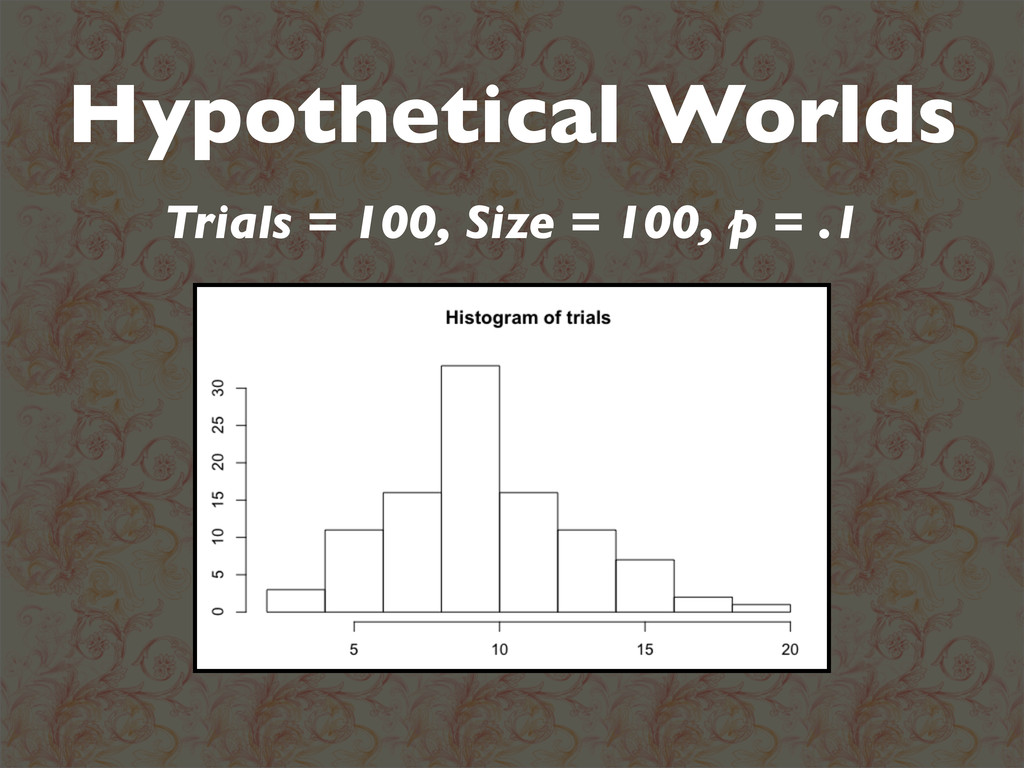
Hypothetical Worlds Trials = 100, Size = 100, p =
.1
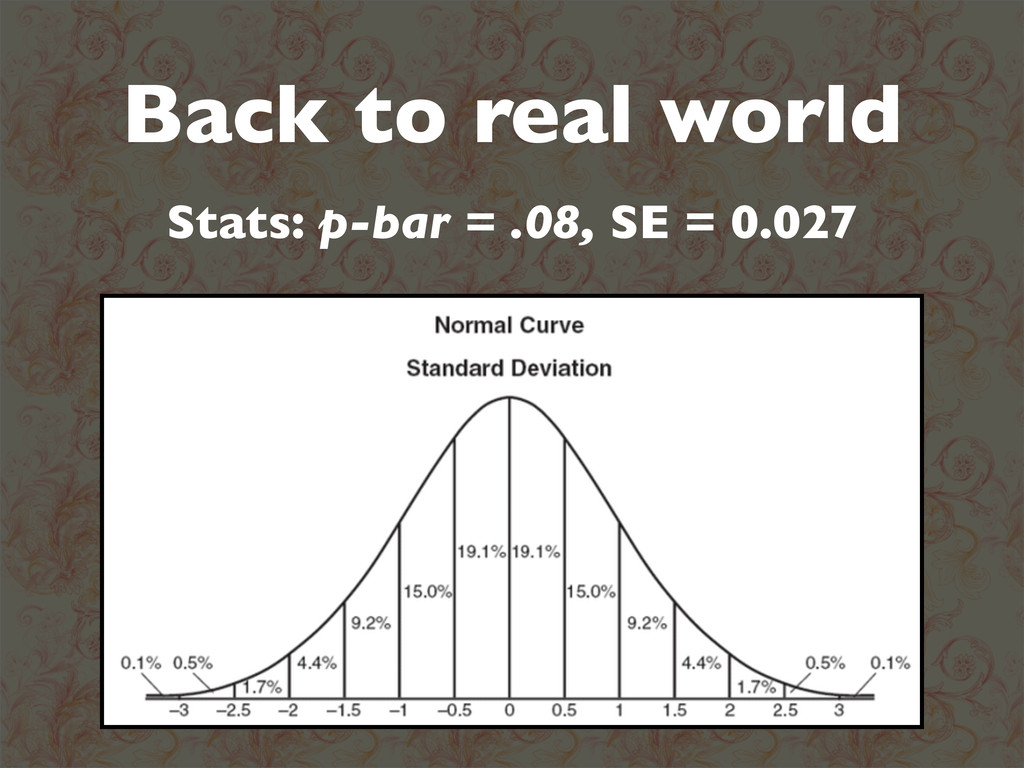
Back to real world Stats: p-bar = .08, SE =
0.027
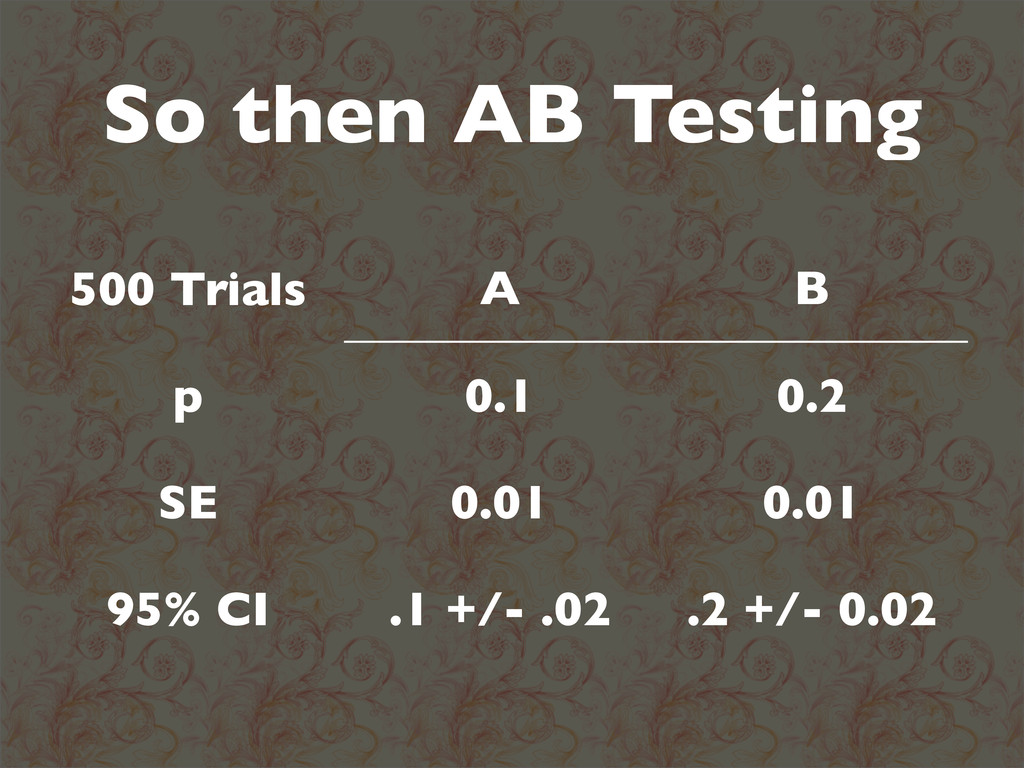
So then AB Testing 500 Trials A B p 0.1
0.2 SE 0.01 0.01 95% CI .1 +/- .02 .2 +/- 0.02
The Engineering Problem
Build Data Pipelines • Repeatable Flows of Data • Handles
Initial Analysis For You • Literate Programming
Programming For Data Analysis • Scripting good for Discovery •
Larger Jobs need Types • Mapping high dimensional space to lower dimensional space... then add
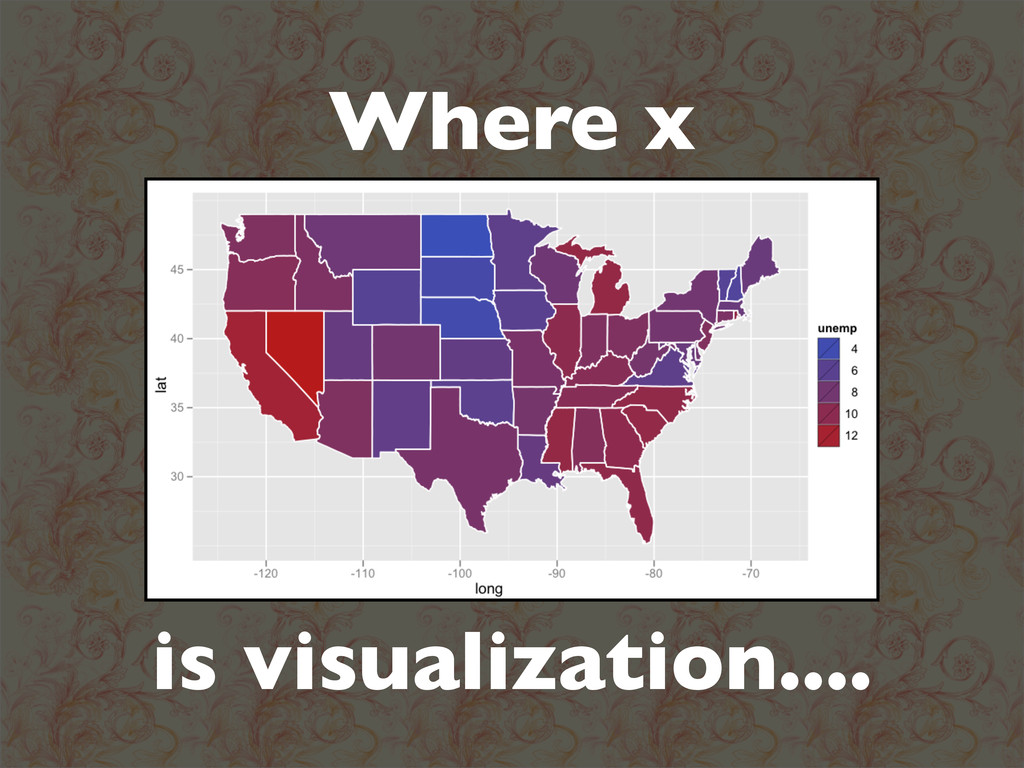
Where x is visualization....
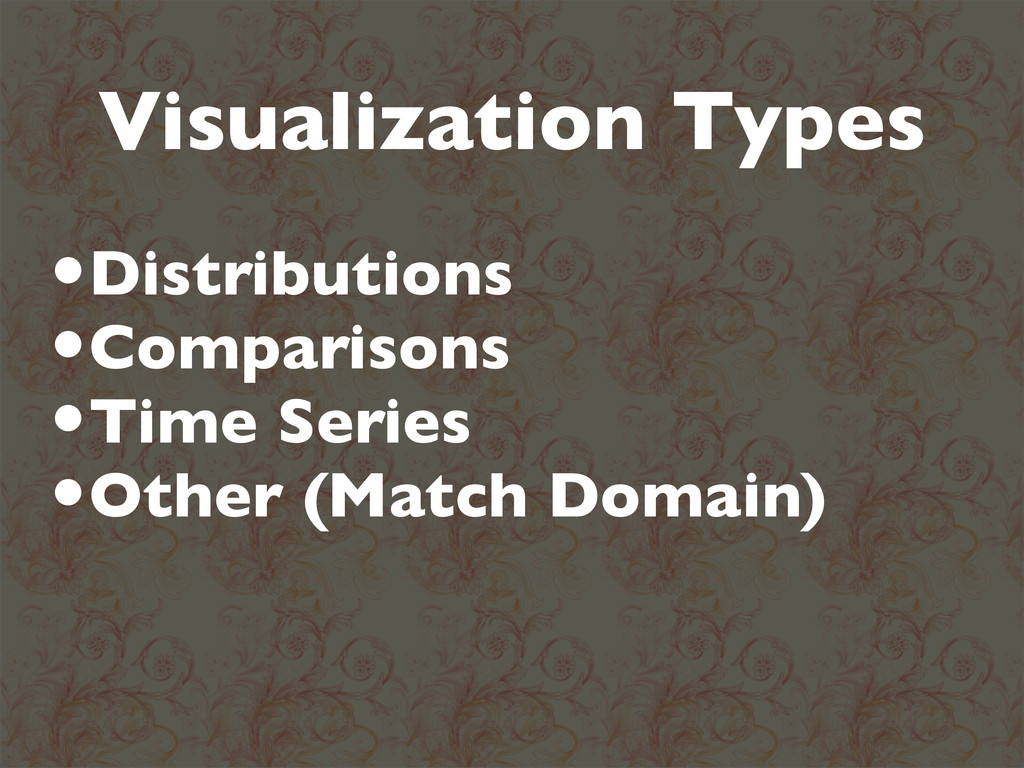
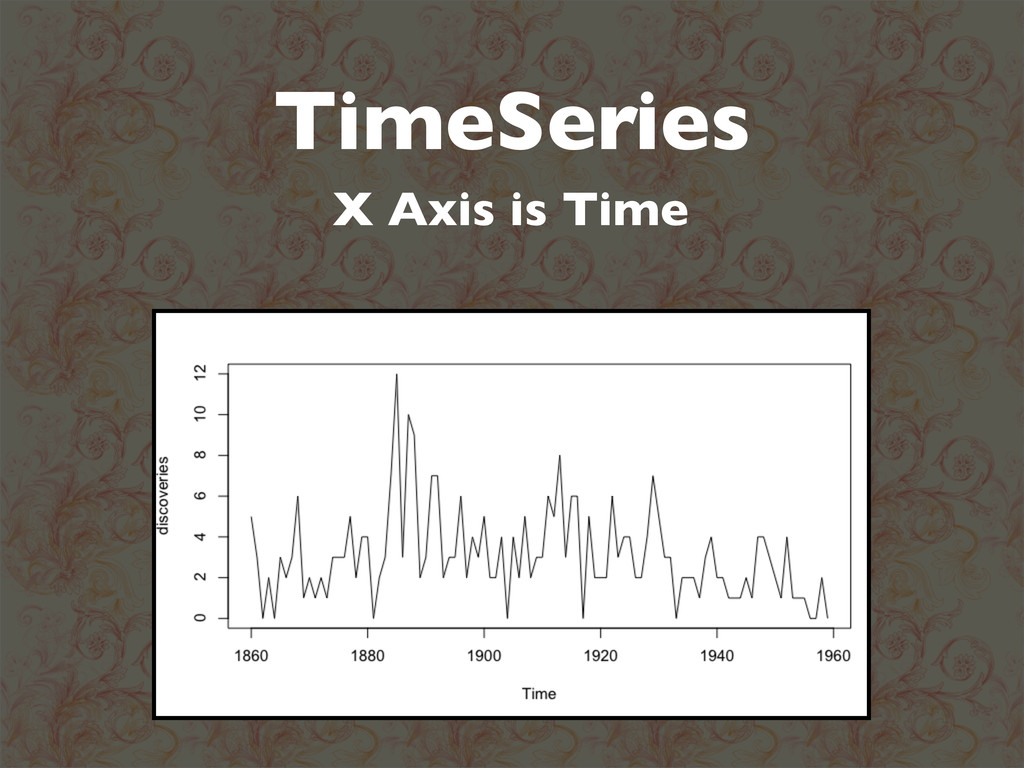
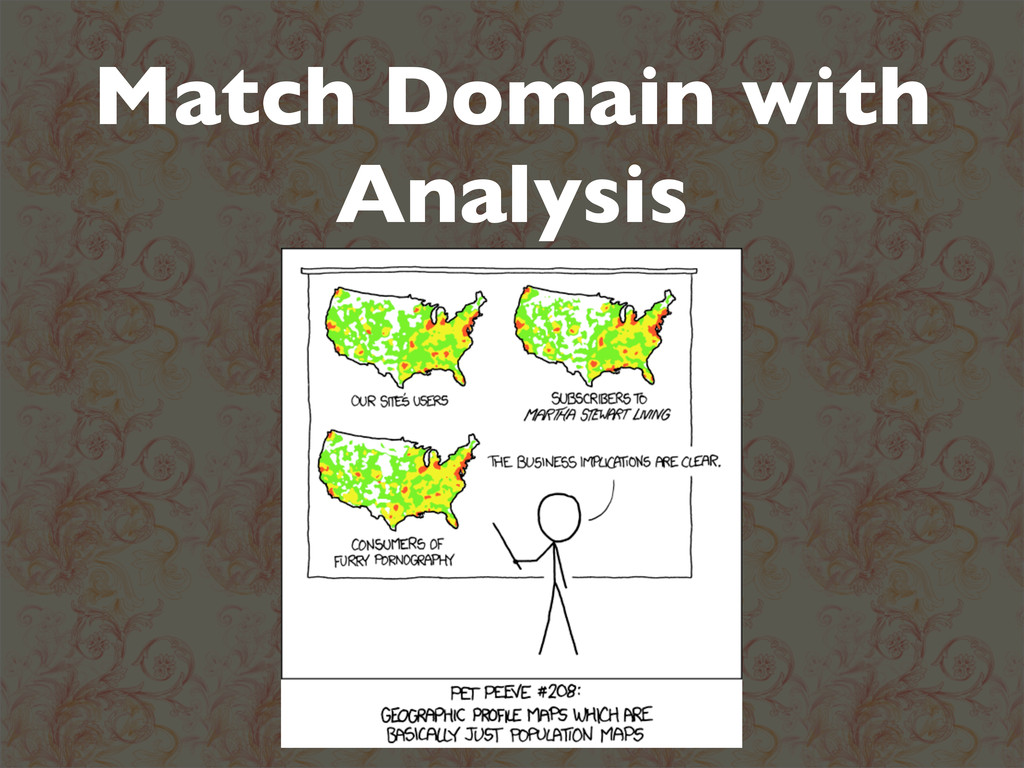
Visualization Types •Distributions •Comparisons •Time Series •Other (Match Domain)
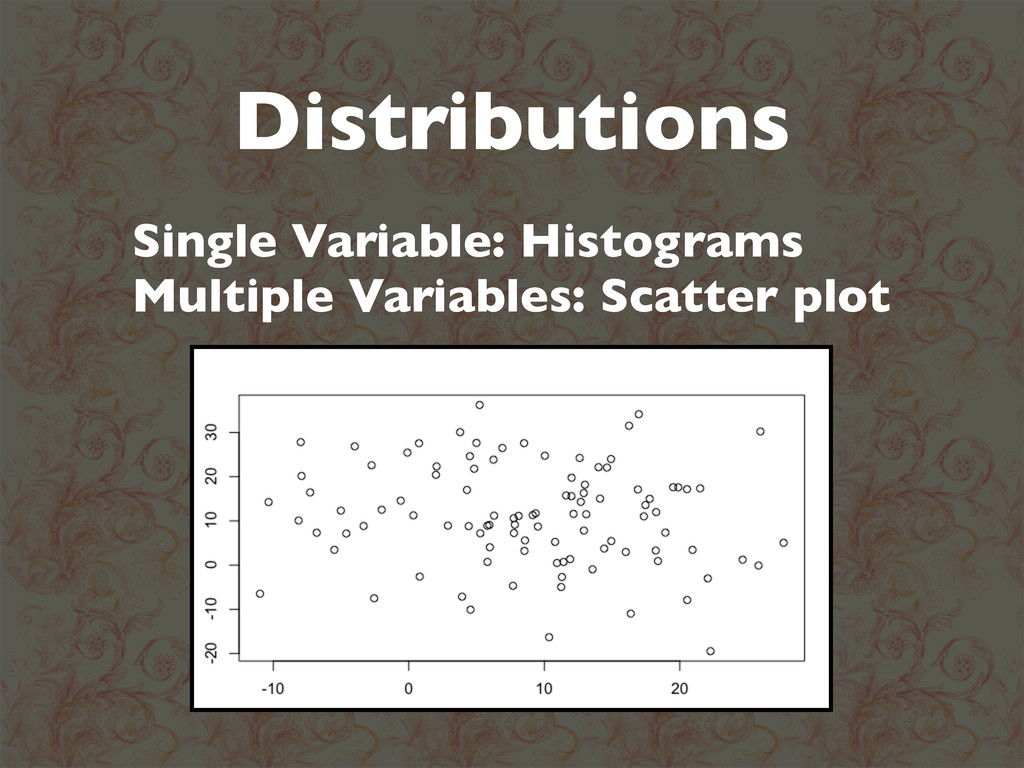
Distributions Single Variable: Histograms Multiple Variables: Scatter plot
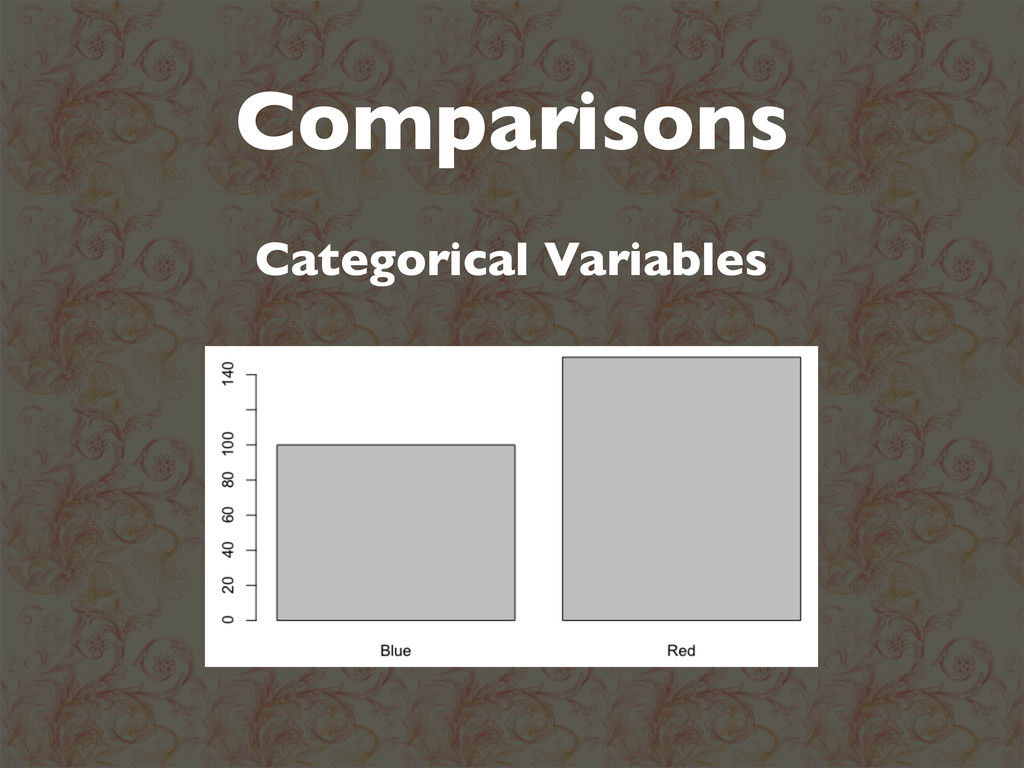
Comparisons Categorical Variables
TimeSeries X Axis is Time
Match Domain with Analysis
Where x is storytelling...
Storytelling
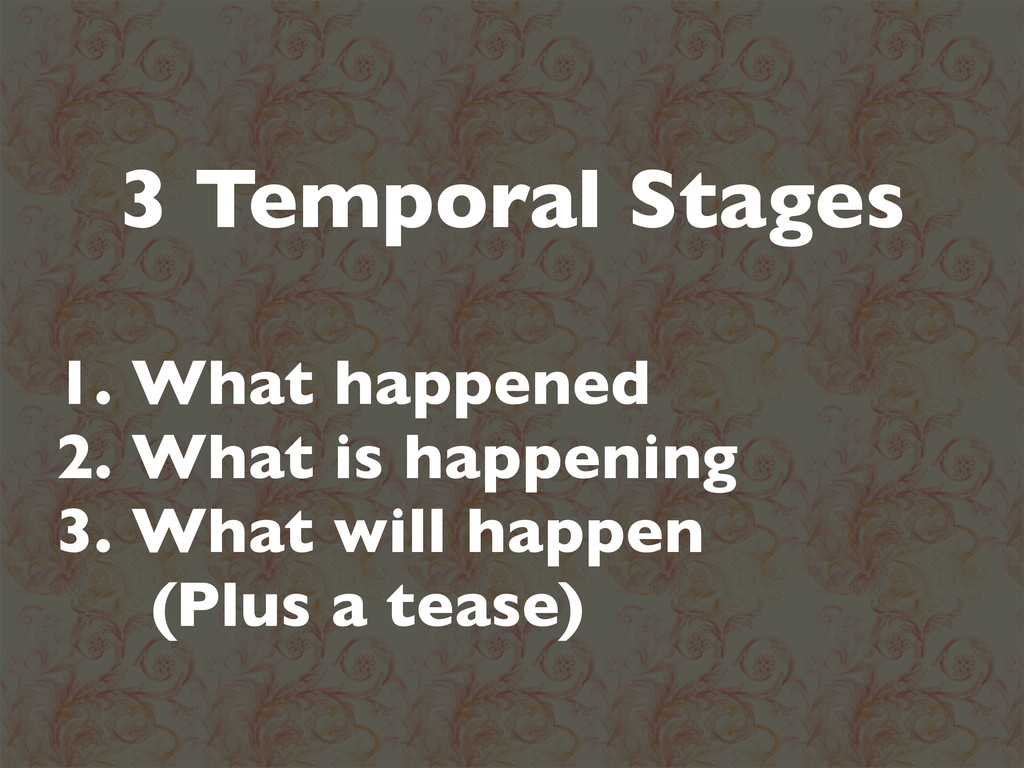
3 Temporal Stages 1. What happened 2. What is happening
3. What will happen (Plus a tease)
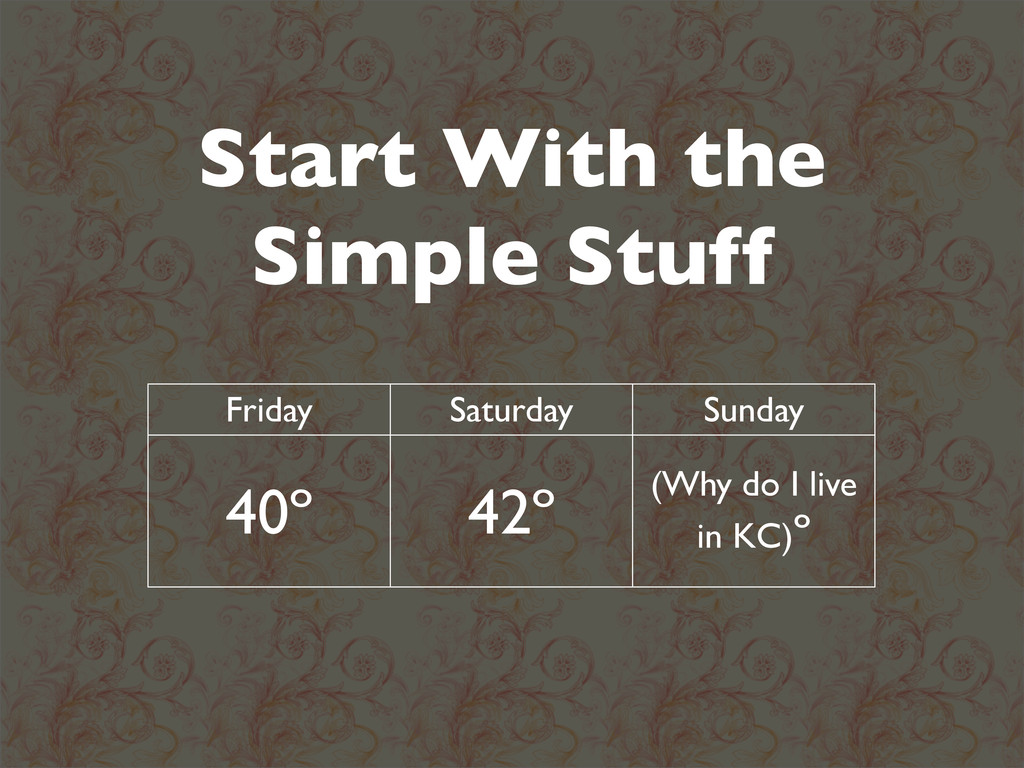
Start With the Simple Stuff Friday Saturday Sunday 40º 42º
(Why do I live in KC)º
Build Up to Complex Idea
Thanks... Questions?
![Next Steps Events _gaq.push(['_trackEvent', 'Cat', 'Act', ‘Label’]); Custom Variables _gaq.push(['_setCustomVar',](https://files.speakerdeck.com/presentations/bcdabe70974701305d674ec2f0e4f186/slide_10.jpg)