Come learn the basics of performance profiling web applications, how profilers work, and general patterns to look for when profiling your own applications in this demo heavy, hopefully humorous, session.
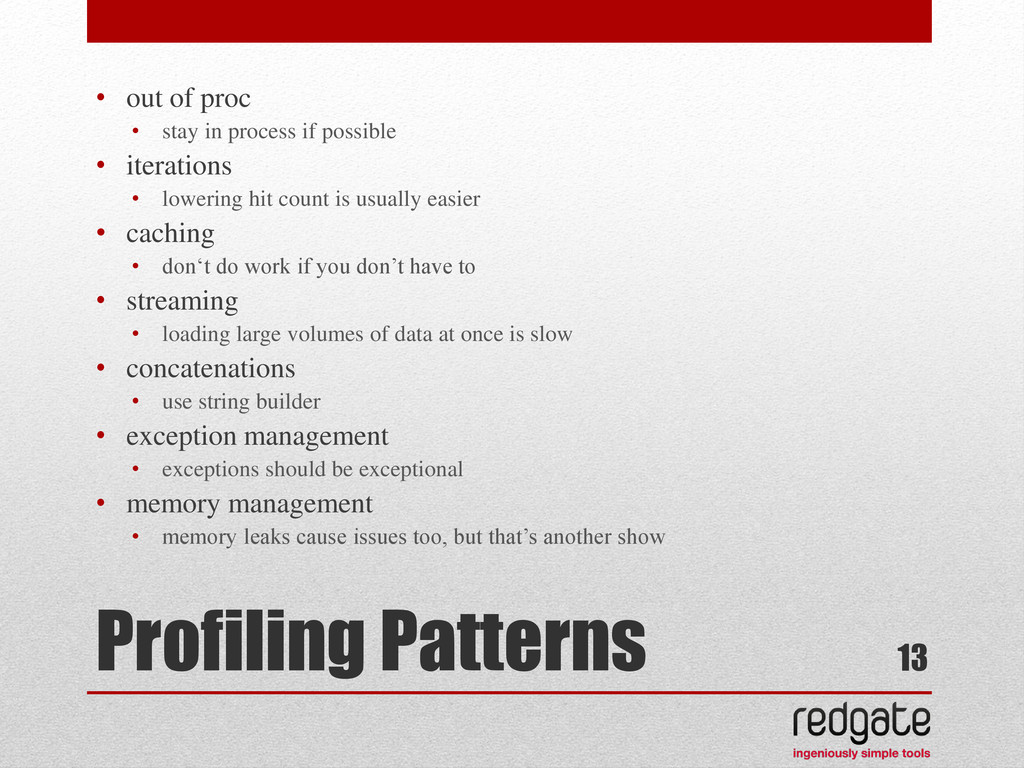
if possible • iterations • lowering hit count is usually easier • caching • don‘t do work if you don’t have to • streaming • loading large volumes of data at once is slow • concatenations • use string builder • exception management • exceptions should be exceptional • memory management • memory leaks cause issues too, but that’s another show 13
![Questions? tweet: @nikmd23 email: [email protected] 17](https://files.speakerdeck.com/presentations/50574929034e100002012167/slide_16.jpg)