Upgrade to PRO for Only $50/Year—Limited-Time Offer! 🔥

30+ Essential Data Science Interview Questions ...

Avatar for Unified Mentor Unified Mentor
May 19, 2025
13

30+ Essential Data Science Interview Questions for Freshers [2025 Edition]

Are you preparing for your first data science job interview in 2025? Unified Mentor brings you a handpicked list of the most commonly asked entry-level data science interview questions along with clear, concise answers. This guide is perfect for fresh graduates, career switchers, or anyone looking to break into the fast-growing world of data science. From Python basics and SQL queries to machine learning concepts and real-world case studies, we’ve got you covered.
At Unified Mentor, we believe in empowering learners with practical, job-ready knowledge. This blog not only helps you understand what employers are looking for but also gives you the confidence to tackle interviews with ease. Whether you're gearing up for your first role or polishing your skills, this resource is your gateway to success in the competitive data science industry. Read now and take the first step toward your dream career!
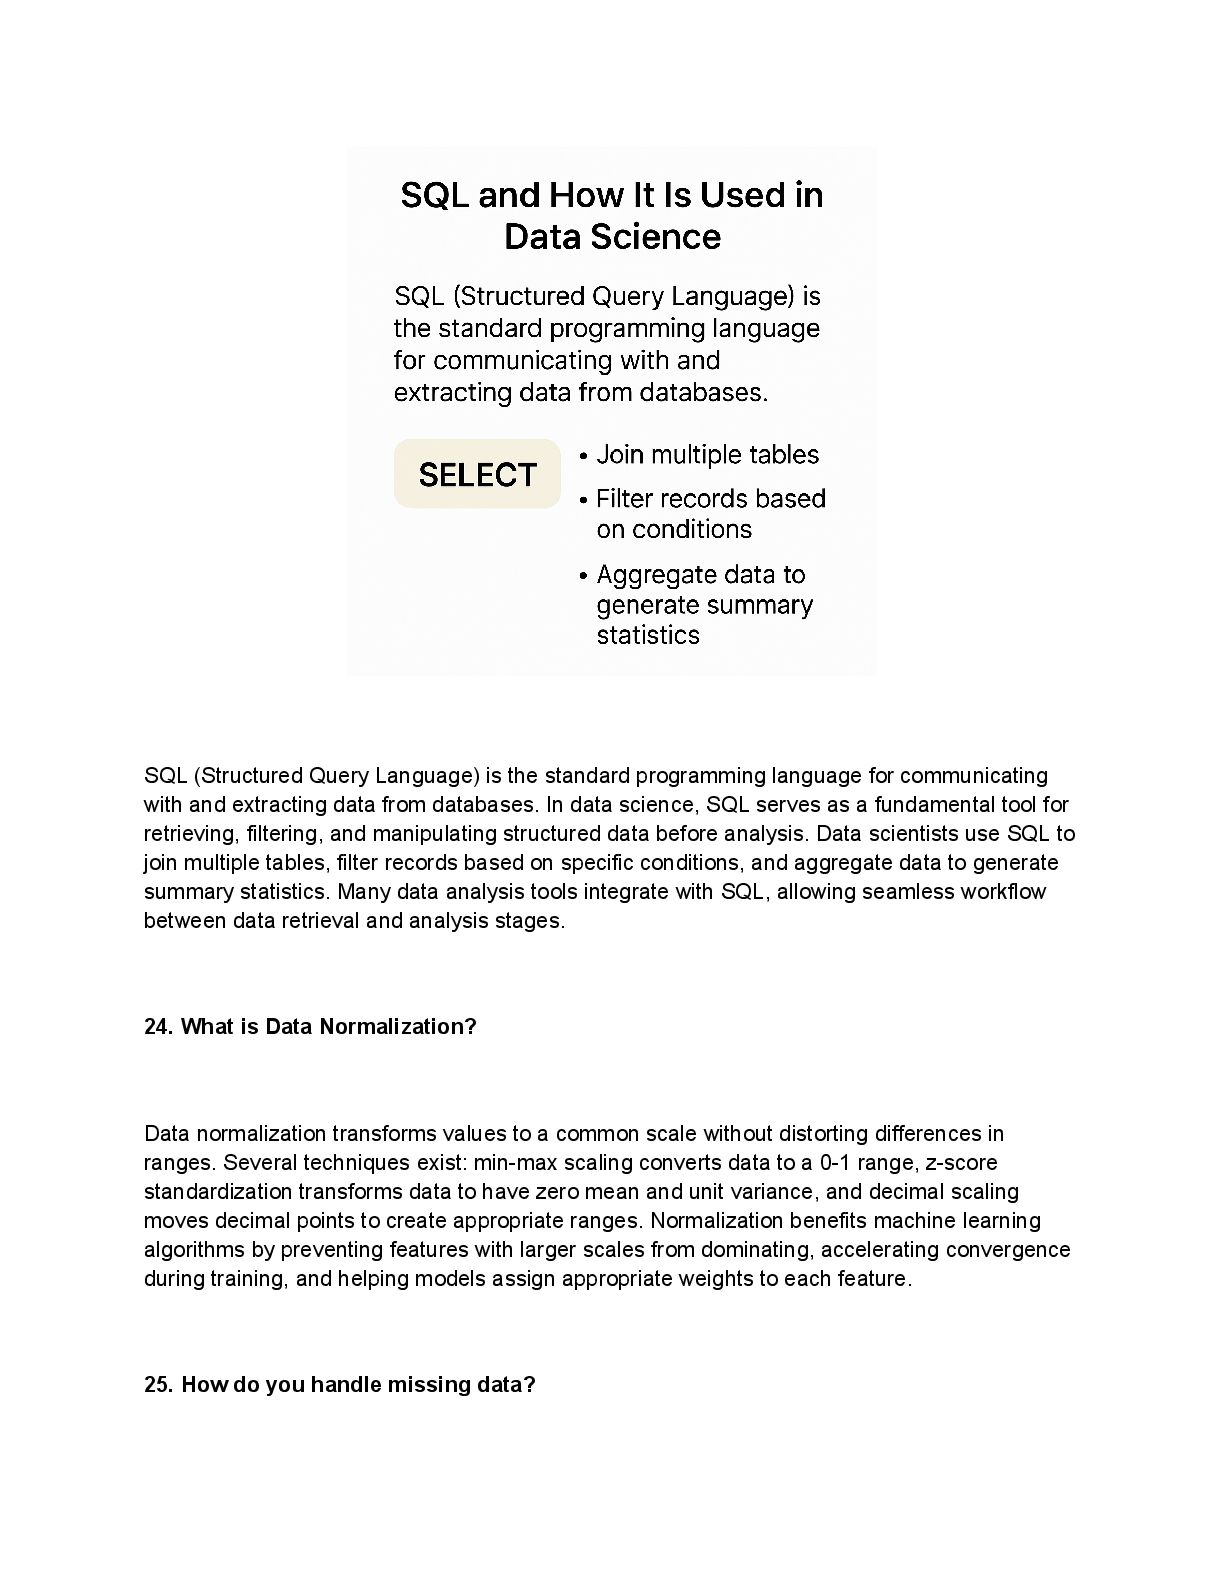
Avatar for Unified Mentor

Unified Mentor

May 19, 2025
Tweet

Transcript

  1. Top 30+ Entry-Level Data Science Interview Questions and Answers [2025]

    In today’s competitive job market, breaking into the data science field requires more than just technical knowledge—it demands clarity, confidence, and solid interview preparation. At Unified Mentor, we understand what freshers need to succeed, which is why we've compiled this exclusive guide: Top Entry-Level Data Science Interview Questions and Answers – 2025. This PDF is designed to help you confidently tackle real-world interview questions and get a clear edge in your job search. Foundational Knowledge for Entry-Level Roles: 1. What is Data Science and why is it important? Data Science is an interdisciplinary field that mines raw data, analyzes it, and identifies patterns to extract valuable insights. It combines statistics, computer science, machine learning, and data analysis to transform data into actionable knowledge. The importance of data science lies in its ability to drive innovation by answering questions that build connections and solutions for future problems, unlike data analytics which focuses on present meaning from historical context. 2. What are the key differences between Data Science and Data Analytics? Though related, these fields differ significantly. Data science has a broader scope, focusing on developing algorithms and data models to find hidden patterns and predict future outcomes. Conversely, data analytics examines existing data to answer specific questions and inform current decisions. While data scientists create new processes using prototypes and predictive models, data analysts work with well-defined datasets using established tools. 3. Explain Supervised vs Unsupervised Learning
  2. Supervised learning uses labeled data sets where algorithms learn relationships

    between inputs and outputs. For instance, predicting commute times based on weather conditions requires training with labeled data showing how rainy weather extends driving time. Unsupervised learning, however, works with unlabeled data to discover inherent patterns independently. It's ideal for clustering (like customer segmentation) and identifying relationships in raw data. 4. What is the role of statistics in Data Science? Statistics forms the backbone of data science, enabling analysts to identify patterns and relationships in complex datasets. Through statistical methods like regression analysis, clustering, and hypothesis testing, data scientists organize, describe, and analyze data effectively. Statistics also provides frameworks for making data-driven decisions across industries, from finance (risk assessment, fraud detection) to healthcare (clinical trials, treatment effectiveness evaluation). 5. What is the Central Limit Theorem?
  3. The Central Limit Theorem states that regardless of a population's

    distribution shape, the sampling distribution of the mean will approximate a normal distribution as sample size increases. This principle applies when samples are at least 30 in size. The theorem is fundamental because it allows for easier statistical analysis, particularly when working with large datasets. 6. What is the difference between population and sample? A population encompasses the entire group about which you want to draw conclusions, while a sample is the specific subset from which you collect data. Samples are necessary when populations are large, geographically dispersed, or difficult to contact completely. The relationship between them is crucial—a representative sample should give every population member an equal chance of selection. 7. What is a Normal Distribution? Normal distribution (Gaussian distribution) appears as a symmetrical bell curve where data near the mean occurs more frequently than data far from it. Key characteristics include: the mean, median, and mode are equal; 68.2% of observations fall within one standard deviation of the mean; 95.4% within two; and 99.7% within three standard deviations. This distribution is essential for applying the Central Limit Theorem. 8. What is the purpose of sampling in data analysis? Sampling allows analysts to work with a smaller, more manageable subset of data while still producing accurate findings about the larger population. It provides efficiency (analyzing entire datasets can be time-consuming), cost-effectiveness (requires fewer resources), and practicality (some populations are impossible to analyze completely). For sampling to be effective, the selected subset must be representational of the larger population. Core Technical Interview Questions
  4. Technical questions form the heart of data science interviews, where

    your algorithmic knowledge and statistical understanding face rigorous testing. Let's explore the most common technical topics that frequently appear in entry-level positions. 9. What is Linear Regression and how is it used? Linear regression is a statistical method that predicts the value of unknown data by using known related data. It models the relationship between variables as a linear equation, making it relatively simple to interpret. For example, if your expenses are consistently half your income, linear regression can determine this relationship mathematically. The simple linear regression function follows the formula Y= β0*X + β1 + ε, where β0 and β1 represent the regression slope and ε is the error term. Companies use linear regression to convert raw data into actionable business intelligence across various fields including finance, health sciences, and marketing. 10. What is Logistic Regression?
  5. Despite its name, logistic regression is primarily used for classification

    rather than regression. This statistical model estimates the probability of an event occurring, with results ranging between 0 and 1. The logistic function applies a logit transformation to the odds (probability of success divided by probability of failure). Binary logistic regression works with two possible outcomes (yes/no, 0/1), whereas multinomial logistic regression handles multiple unordered categories. In practical applications, a probability below 0.5 typically predicts 0, while above 0.5 predicts 1. 11. What is a Confusion Matrix and how do you interpret it? A confusion matrix visualizes classification model performance through a table showing four outcomes: true positives (TP), false positives (FP), true negatives (TN), and false negatives (FN). The rows represent actual classes while columns show predicted classes, with the diagonal representing correctly predicted instances. This format clearly reveals whether a model consistently confuses certain classes. From this matrix, you can calculate accuracy ((TP+TN)/(TP+TN+FP+FN)), though this metric alone may be misleading with imbalanced datasets. 12. What is the difference between precision and recall? Precision measures the proportion of true positives among all positive predictions (TP/(TP+FP)), essentially answering "how many selected items are relevant?" Recall (also called sensitivity) calculates the proportion of true positives among all actual positives (TP/(TP+FN)), addressing "how many relevant items are selected?" These metrics often exist in tension—improving one typically decreases the other. For spam detection, high precision ensures legitimate emails aren't misclassified, while high recall ensures all spam is caught. The F1 score offers a balanced measure by calculating their harmonic mean. 13. What is the ROC Curve?
  6. The Receiver Operating Characteristic (ROC) curve plots the true positive

    rate against the false positive rate across various threshold settings. A perfect model would reach the upper left corner (0,1), indicating 100% sensitivity and specificity. The area under this curve (AUC) represents the probability that the model will rank a random positive instance higher than a random negative one. An AUC of 1.0 is perfect, 0.5 suggests random guessing, and values above 0.8 are generally considered acceptable for diagnostic purposes. 14. What is the purpose of Cross-Validation? Cross-validation evaluates how well a model generalizes to unseen data, helping prevent overfitting. In k-fold cross-validation, the data is divided into k equal subsets, with k-1 portions used for training and the remaining portion for testing. This process repeats k times, with each subset serving as the test set once, producing an average performance score. Cross-validation provides an unbiased estimate of a model's predictive capabilities without requiring a separate validation set, making it especially valuable when working with limited data. 15. What is the Bias-Variance Tradeoff?
  7. The bias-variance tradeoff represents the fundamental tension between model simplicity

    and complexity. Bias is the error from overly simplified model assumptions (underfitting), while variance is the error from excessive sensitivity to training data fluctuations (overfitting). As model complexity increases, bias decreases but variance increases. The goal is finding the optimal balance that minimizes total error. This explains why sometimes seemingly counterintuitive actions like simplifying a high-performing model can actually improve its real-world performance. 16. What is Overfitting and how can it be prevented? Overfitting occurs when a model performs exceptionally well on training data but poorly on new data, essentially "memorizing" rather than learning. Common prevention techniques include:
  8. •​ Cross-validation to detect and avoid overfitting early •​ Regularization

    (L1/L2) to constrain model parameters •​ Early stopping before the model learns noise in the data •​ Ensemble methods combining multiple models •​ Feature selection/pruning to focus on the most important variables •​ Data augmentation to artificially increase training data diversity •​ Dropout for neural networks to prevent co-adaptation
  9. 17. What is PCA and when would you use it?

    Principal Component Analysis (PCA) stands as a cornerstone technique in a data scientist's toolkit. During interviews, understanding PCA demonstrates your ability to handle complex, high-dimensional data efficiently. PCA is a linear dimensionality reduction technique that transforms high-dimensional datasets into a lower-dimensional space while preserving as much information as possible. Through this process, PCA identifies principal components—directions along which the data varies the most. Originally developed by Karl Pearson in 1901, PCA has become increasingly popular with the advancement of computing power. The fundamental goal of PCA is remarkably straightforward: reduce the number of variables in your dataset while maintaining maximum information. This addresses the "curse of dimensionality," where more features exponentially increase the data needed for statistically significant results. You'll want to employ PCA in several key scenarios: First, when dealing with multicollinearity problems. PCA creates new, uncorrelated variables when original features show high correlation. This proves invaluable for regression analysis and other statistical modeling techniques. Second, for data visualization purposes. PCA excels at projecting high-dimensional data onto two or three dimensions, making it easier to identify patterns, trends, or outliers. Many studies utilize the first two principal components to visually identify clusters of closely related data points. Third, to improve model performance. By eliminating noise and reducing overfitting risks, PCA streamlines data processing—essential whenever computational efficiency matters.
  10. Fourth, as a preprocessing step before applying machine learning algorithms.

    The dimensionality reduction minimizes issues like overfitting and multicollinearity. When considering PCA versus other dimensionality reduction methods, remember these distinctions: PCA works best with linear relationships between variables, handles large datasets efficiently due to its matrix-based computation, and focuses on preserving variance rather than local structure. Nevertheless, PCA comes with limitations. Since principal components are combinations of original variables, they often lack straightforward interpretability. Additionally, PCA requires proper data scaling beforehand, as it's sensitive to variances among initial variables. 18. What is Regularization (L1 vs L2)? Regularization represents one of the most powerful techniques in a data scientist's arsenal for fighting the common enemy of machine learning models: overfitting. In your interviews, explaining regularization effectively demonstrates your understanding of model optimization.
  11. Regularization works by adding a penalty term to the model's

    loss function, discouraging overly complex solutions that may simply memorize training data rather than learn underlying patterns. This penalty term effectively constrains the model's parameters, making it simpler and more generalizable. Two primary regularization techniques dominate the field: L1 (Lasso) and L2 (Ridge). L1 regularization adds the absolute value of the coefficients as a penalty term to the loss function. In essence, L1 estimates the median of the data while penalizing the sum of absolute values of the weights. A key characteristic of L1 is that it can shrink some coefficients exactly to zero, effectively performing feature selection by eliminating less important variables. This makes L1 particularly valuable when working with high-dimensional datasets that may contain many irrelevant features. In contrast to L1, L2 regularization adds the squared magnitude of coefficients as the penalty term. L2 estimates the mean of the data and penalizes the sum of squared weights. Unlike L1, L2 regularization reduces coefficients close to zero but rarely exactly to zero. Consequently, all features remain in the model, albeit with potentially diminished importance.
  12. The choice between L1 and L2 primarily depends on your

    specific needs: •​ Choose L1 when feature selection is desired, especially with many potentially redundant features •​ Select L2 when dealing with multicollinearity issues, as it distributes effects across correlated variables •​ Consider Elastic Net (a combination of L1 and L2) for the best of both worlds Understanding the nuances between these regularization techniques often separates successful candidates from others in data science interviews. Moreover, knowing when to apply each technique demonstrates practical problem-solving skills that employers highly value. 19. What is K-Means Clustering? K-Means Clustering often appears in data scientist interview questions as it represents a fundamental unsupervised learning algorithm in the machine learning toolkit. This algorithm partitions data into K distinct non-overlapping clusters where each data point belongs to only one group. The algorithm works through an iterative approach known as Expectation-Maximization. Initially, you specify the number of clusters (K) and randomly select K data points as starting centroids. Subsequently, the algorithm assigns each data point to its nearest centroid based on Euclidean distance. After assignment, centroids are recalculated by taking the average of all points in each cluster. This process repeats until centroids no longer change significantly or a stopping criterion is met. K-Means primarily aims to minimize within-cluster variance while maximizing between-cluster distance. Mathematically, it seeks to minimize the sum of squared distances between data points and their assigned centroids. This approach creates compact, cohesive clusters with clear separation.
  13. Before applying K-Means, it's advisable to standardize your data as

    the algorithm is sensitive to different scales of measurement. Additionally, running the algorithm multiple times with different initializations is recommended as K-Means may converge to local optima due to random starting positions. The applications of K-Means span numerous fields: •​ Customer segmentation for targeted marketing strategies •​ Image compression and segmentation •​ Document clustering for information retrieval •​ Anomaly detection in various domains​ While powerful, K-Means has limitations worth noting. It works best with spherical clusters of comparable size and struggles with irregularly shaped distributions. Furthermore, choosing the optimal K value requires domain knowledge or additional techniques like the elbow method. During interviews, emphasize that K-Means is computationally efficient (scaling as O(nk)) compared to hierarchical clustering methods, making it suitable for large datasets commonly encountered in real-world data science projects. 20. What is a Decision Tree? Decision trees represent a visual approach to problem-solving that frequently appears in data scientist interviews. This non-parametric supervised learning algorithm creates flowchart-like structures to model decisions and their potential consequences. At its core, a decision tree consists of several key components: the root node (starting point), internal nodes (decision points), branches (outcomes of decisions), and leaf nodes (final predictions or classifications). The hierarchical structure begins with a single question at the root node and branches out into increasingly specific decisions until reaching a conclusion.
  14. Decision trees function through a process called recursive partitioning. The

    algorithm searches for the feature that best separates the data into homogeneous subsets, creating a split at each node. This division continues recursively until reaching stopping criteria such as maximum depth or minimum samples per leaf. Several types of decision trees exist: ID3: Uses entropy to measure data impurity and maximize information gain C4.5: An improved version of ID3 that handles continuous attributes and missing values CART: Uses Gini impurity for classification and variance reduction for regression tasks What makes decision trees particularly valuable is their interpretability. Unlike many machine learning algorithms, decision trees produce models that non-technical stakeholders can easily understand through visualization. Additionally, they require minimal data preparation, handle both numerical and categorical features naturally, and perform well even when assumptions about the data are somewhat violated. Nonetheless, decision trees come with limitations. They tend toward overfitting without proper pruning or regularization techniques. Furthermore, they can be unstable, where small data variations might produce entirely different trees. Their predictions are also piecewise constant rather than smooth, creating challenges for extrapolation beyond the training data. Decision trees form the foundation for more sophisticated ensemble methods like Random Forests and Gradient Boosting, making them essential knowledge for any data scientist facing interview questions about machine learning fundamentals. 21. What is an Activation Function in Neural Networks?
  15. Activation functions serve as the critical components that introduce non-linearity

    into neural networks, transforming them from glorified linear regression models into powerful pattern recognition tools. An activation function determines whether a neuron should be activated or not activated based on the weighted sum of its inputs. In other words, it decides if the neuron's input is relevant for the network's prediction process. Without activation functions, neural networks would only perform linear mappings from inputs to outputs, regardless of how many layers they contain. The primary purpose of activation functions is to add non-linearity to neural networks. This non-linearity enables networks to learn complex patterns and relationships in data that simple linear models cannot capture. As a result, neural networks can approximate sophisticated, real-world relationships between features and outcomes. In mathematical terms, if σ represents our activation function, the value of a node in the network is given by: σ(w·x+b) Where w represents weights, x represents inputs, and b is the bias term. Three common activation functions that data scientists should understand for interviews include: Sigmoid function: Transforms input values to outputs between 0 and 1 using F(x)=1/(1+e^(-x)). Historically important but vulnerable to the vanishing gradient problem. Tanh function: Produces output values between -1 and 1 using F(x)=tanh(x). Offers stronger gradients than sigmoid. ReLU (Rectified Linear Unit): Uses the formula F(x)=max(0,x), returning 0 for negative inputs and the input value for positive inputs. ReLU has become the preferred activation function in many modern networks because it's computationally efficient and addresses the vanishing gradient problem.
  16. In practice, ReLU often performs better than smooth functions like

    sigmoid or tanh. Furthermore, the choice of activation function significantly impacts a neural network's ability to learn. This fundamental concept frequently appears in data scientist interview questions, particularly when discussing model architecture decisions. 22. What is a Neural Network? Neural networks serve as the computational backbone of modern artificial intelligence, mimicking the human brain's interconnected structure. Like biological neural systems, artificial neural networks consist of interconnected nodes (artificial neurons) that work together to process information and make decisions. Fundamentally, a neural network is organized into three key components: Input Layer: Receives data from the outside world Hidden Layers: Process and transform the data through interconnected nodes Output Layer: Produces the final result after all processing Each artificial neuron connects to others through weighted pathways. These weights determine how much influence one node has over another—positive weights excite connected neurons while negative weights suppress them. Additionally, each node has a bias that acts as a threshold determining when the node "fires" or activates. The processing within a neural network follows a specific pattern. First, input data enters through the input layer. Each node then performs a calculation: multiplying inputs by their respective weights, summing these values, and applying an activation function. This result passes to the next layer, with each successive layer extracting more complex features from the previous one. Neural networks can be categorized into several types:
  17. •​ Feedforward Neural Networks: Data flows in one direction from

    input to output •​ Convolutional Neural Networks (CNNs): Specialized for processing grid-like data such as images •​ Recurrent Neural Networks (RNNs): Include feedback loops to retain information over time What distinguishes a deep neural network is its multiple hidden layers—this "depth" gives deep learning its name. With each additional layer, the network can learn more sophisticated patterns, enabling it to solve complex problems in computer vision, natural language processing, and other domains. Notably, neural networks learn through a process called backpropagation, where weights are adjusted to minimize the difference between predicted and actual outputs. This iterative refinement allows networks to improve their accuracy over time, forming the basis for their remarkable pattern recognition capabilities. Practical and Tool-Based Questions Practical tools and techniques often separate successful data scientists from the rest. Mastering these applied concepts will demonstrate your readiness to tackle real-world challenges in your interviews. 23. What is SQL and how is it used in Data Science?
  18. SQL (Structured Query Language) is the standard programming language for

    communicating with and extracting data from databases. In data science, SQL serves as a fundamental tool for retrieving, filtering, and manipulating structured data before analysis. Data scientists use SQL to join multiple tables, filter records based on specific conditions, and aggregate data to generate summary statistics. Many data analysis tools integrate with SQL, allowing seamless workflow between data retrieval and analysis stages. 24. What is Data Normalization? Data normalization transforms values to a common scale without distorting differences in ranges. Several techniques exist: min-max scaling converts data to a 0-1 range, z-score standardization transforms data to have zero mean and unit variance, and decimal scaling moves decimal points to create appropriate ranges. Normalization benefits machine learning algorithms by preventing features with larger scales from dominating, accelerating convergence during training, and helping models assign appropriate weights to each feature. 25. How do you handle missing data?
  19. Addressing missing data requires understanding its pattern—whether it's Missing Completely

    At Random (MCAR), Missing At Random (MAR), or Missing Not At Random (MNAR). Common approaches include: •​ Deletion methods (list-wise or pairwise) •​ Imputation techniques using statistical measures (mean, median, mode) •​ Advanced methods like regression imputation or k-Nearest Neighbors •​ Creating indicator variables to preserve information about missingness The chosen method depends on the amount of missing data, its distribution, and the specific analysis requirements. 26. What is Feature Engineering? Feature engineering transforms raw data into meaningful inputs for machine learning models. This process includes feature creation (developing new variables), feature transformation (changing representation), feature extraction (identifying useful patterns), and feature selection (choosing relevant variables). Good feature engineering enhances model accuracy by providing more relevant information, reducing dimensionality, and highlighting important relationships that algorithms might otherwise miss. 27. What is Hyperparameter Tuning? Hyperparameter tuning optimizes the configuration variables that govern model training behavior. Unlike parameters learned during training, hyperparameters must be set beforehand. Common tuning methods include grid search (exhaustively testing combinations), random search (testing random combinations), and Bayesian optimization (intelligently choosing the next combination based on previous results). Effective tuning balances bias and variance to create models that generalize well to new data.
  20. 28. What is Ensemble Learning? Ensemble learning combines multiple models

    to produce better predictions than any single model alone. This approach creates diverse, high-bias models whose combined output yields improved overall performance. Ensemble methods reduce variance and increase stability by averaging out individual model errors. Popular ensemble techniques include bagging, boosting, and stacking, each with unique approaches to model combination. 29. What is the difference between Bagging and Boosting? Bagging (Bootstrap Aggregating) trains multiple models independently and in parallel using randomly sampled subsets of data with replacement. Each model gets equal weight in the final prediction, which is determined by majority voting (classification) or averaging (regression). Bagging primarily reduces variance. Boosting, in contrast, trains models sequentially, with each new model focusing on correcting the errors of previous ones. Models receive different weights based on their performance, with the final prediction being a weighted vote. Boosting mainly reduces bias while potentially increasing variance. 30. What is a Recommender System? Recommender systems predict user preferences to suggest relevant products or content. These AI algorithms analyze past behavior and preferences to generate personalized recommendations. Major approaches include collaborative filtering (using similar users' behaviors), content-based filtering (using item attributes), and hybrid methods combining both approaches. Recommender systems drive significant revenue—improving recommendations by just 1% can translate into billions of dollars for large platforms. 31. What is A/B Testing?
  21. A/B testing emerges as a fundamental experimental method frequently discussed

    in data scientist interview questions. This approach, sometimes called split testing, compares two versions of a variable to determine which performs better according to predefined success metrics. At its core, A/B testing involves randomly dividing your audience into two groups, each experiencing a different version of your product, webpage, or feature. One group encounters version A (the control), while the other interacts with version B (the variant). By tracking user behavior, you can identify which version drives better performance statistically. The methodology follows a structured process: first, create two versions differing in just one element; second, randomly split traffic between these versions; third, measure user engagement through a dashboard; finally, analyze results to determine effects—positive, negative, or neutral. This technique essentially transforms decision-making from subjective guesswork into data-driven certainty. Statistical significance forms the backbone of legitimate A/B testing. It measures the likelihood that differences between versions represent genuine effects rather than random chance. For instance, with a 95% significance level, you can be 95% confident that observed differences are authentic. Without validating statistical significance, marketing decisions may offer little value or return on investment. Researchers across industries utilize A/B testing for numerous applications: •​ Comparing product concepts or advertisement creatives •​ Testing small changes like website buttons or homepage designs •​ Optimizing landing pages, checkout processes, or mobile applications The technique proves especially valuable for UX improvements, marketing optimization, and increasing conversion rates. Throughout this experimental process, only changing one element at a time allows for clear causative conclusions about what specifically affected user behavior.
  22. In preparation for data science interviews, remember that A/B testing

    represents more than just a tool—it embodies the scientific method applied to digital experiences, transforming subjective opinions into objective insights. Behavioral and Situational Questions Beyond technical knowledge, behavioral questions gage your practical experience and adaptability in real-world data science scenarios. Hiring managers evaluate not just what you know, but how you apply it. 32. Describe a Data Science project you worked on. When answering this question, focus on providing a structured narrative of your project. Mention your hypothesis, methodologies, and results. Specifically, outline the six key steps: generating hypotheses, studying data, cleaning data, engineering features, creating predictive models, and communicating results. Hiring managers look for how you approach problem-solving rather than just technical execution. Importantly, a good response demonstrates your ability to tell a data story—a critical yet underrated skill. If you lack professional experience, discuss personal projects, Kaggle competitions, or open-source contributions that demonstrate your analytical abilities. 33. How do you stay current with Data Science trends? The skills you possess today might become outdated tomorrow, making continuous learning essential. Mention specific learning resources like certification courses that offer industry-relevant curriculum, live projects with real datasets, and career coaching. You might discuss how you follow thought leaders, participate in online communities, or attend conferences. Emphasize that staying current isn't just about learning new tools but understanding emerging methodologies that solve business problems efficiently. 34. How do you approach learning a new tool or concept?
  23. First, explain your systematic approach to learning. Many successful data

    scientists start by understanding the fundamentals before diving into applications. Second, highlight how you apply new knowledge through hands-on practice—perhaps by recreating existing projects with new tools or building small applications that demonstrate the concept. Third, mention how you validate your understanding through peer review or by teaching others. Lastly, discuss how you've successfully implemented this approach previously, providing a specific example of a tool or concept you mastered. 35. Why do you want to pursue a career in Data Science? This question allows me to express my genuine passion for data science beyond just the attractive compensation. What draws me in is how the field blends my natural curiosity with real-world impact. I'm excited by the fact that data science is projected to grow 36% by 2031—much faster than most careers. But beyond job security, what motivates me is the power of data to turn massive volumes of information from smartphones, satellites, and sensors into insights that drive innovation. The Data Analyst future in India is especially promising, with entry-level salaries around INR 8.4 lakhs and senior roles like Chief Data Officers earning up to INR 84 million. This shows the growing value of data-driven roles across industries. What truly makes this field compelling is its versatility—every sector from healthcare to education needs data professionals. The collaborative nature of data science also excites me, as it brings together experts from different backgrounds, fostering continuous learning. With 82% of companies seeking machine learning skills but only 12% feeling adequately staffed, I see this as a golden opportunity to grow while contributing meaningfully. •​ Problem-solving and technical challenges that keep me intellectually engaged •​ Opportunities to extract meaningful patterns from complex information •​ The satisfaction of helping organizations make better, data-driven decisions
  24. •​ A dynamic field where I'm always learning and growing

    Simultaneously, this career allows me to maintain work-life balance while tackling fascinating challenges. If you’d like to read the full version of this guide online, including any updates and related content, visit our blog: https://www.unifiedmentor.com/blog/top-entry-level-data-science-interview-questions-and-answe rs-2025