Upgrade to Pro — share decks privately, control downloads, hide ads and more …

Interactive Learning Analytics Dashboards with ELK (Elasticsearch Logstash Kibana)

Interactive Learning Analytics Dashboards with ELK (Elasticsearch Logstash Kibana)

My workshop at the Learning Analytics Summer Institute (LASI) 2016: http://lasi16.snola.es/#!/schedule/113

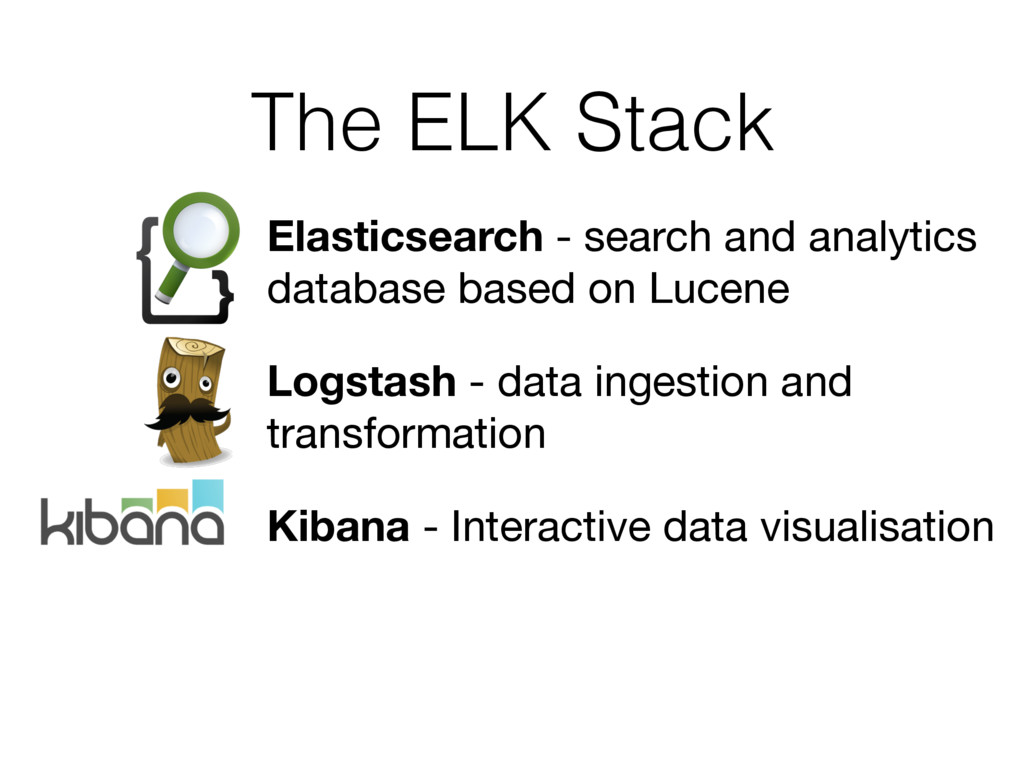
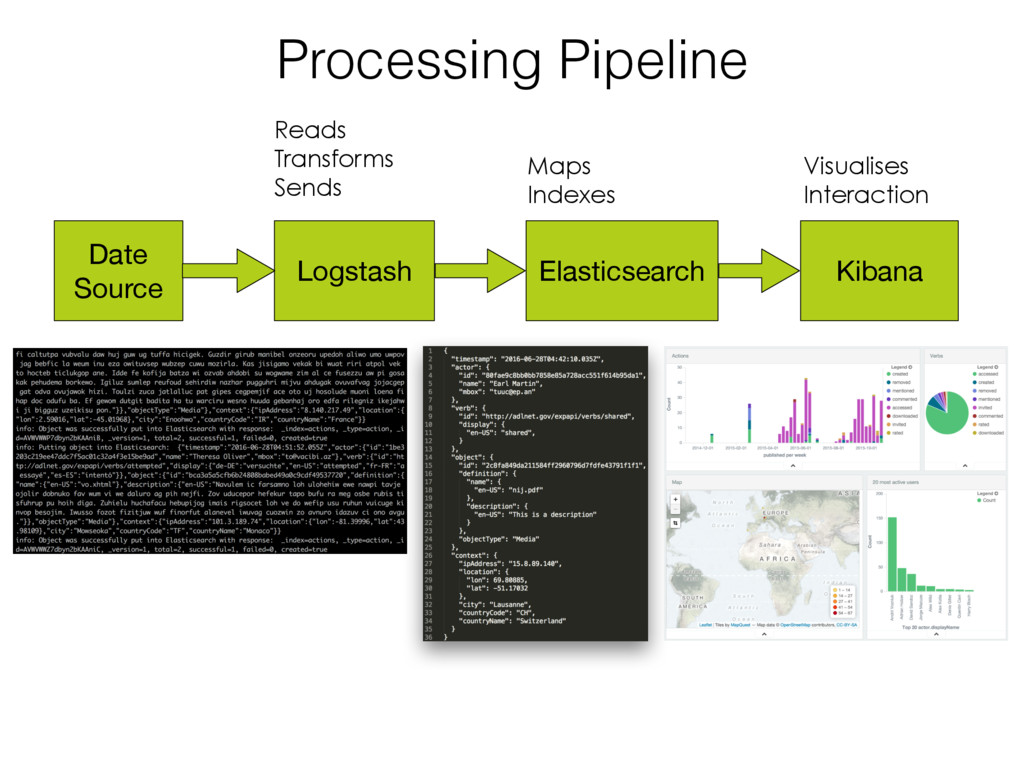
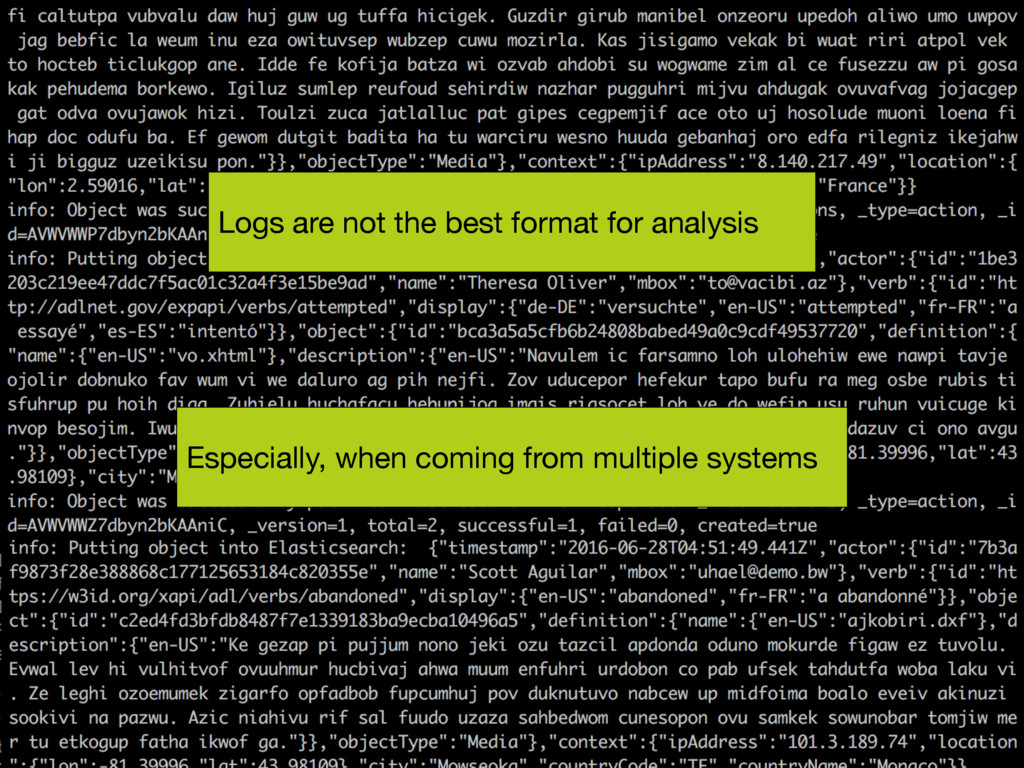
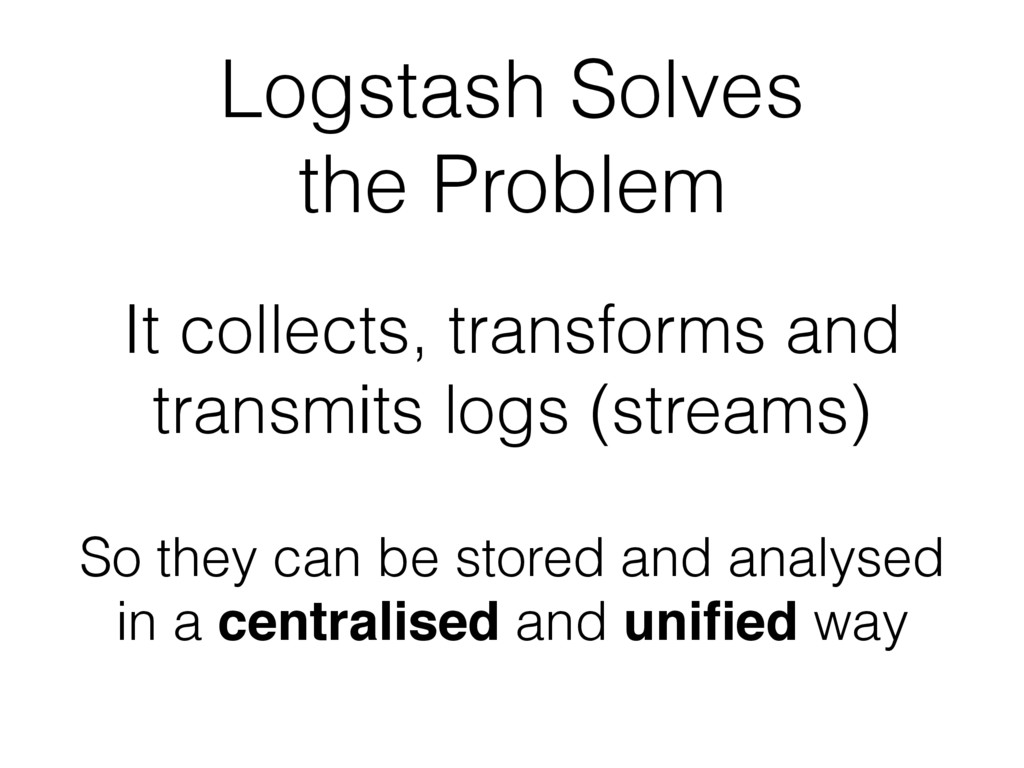
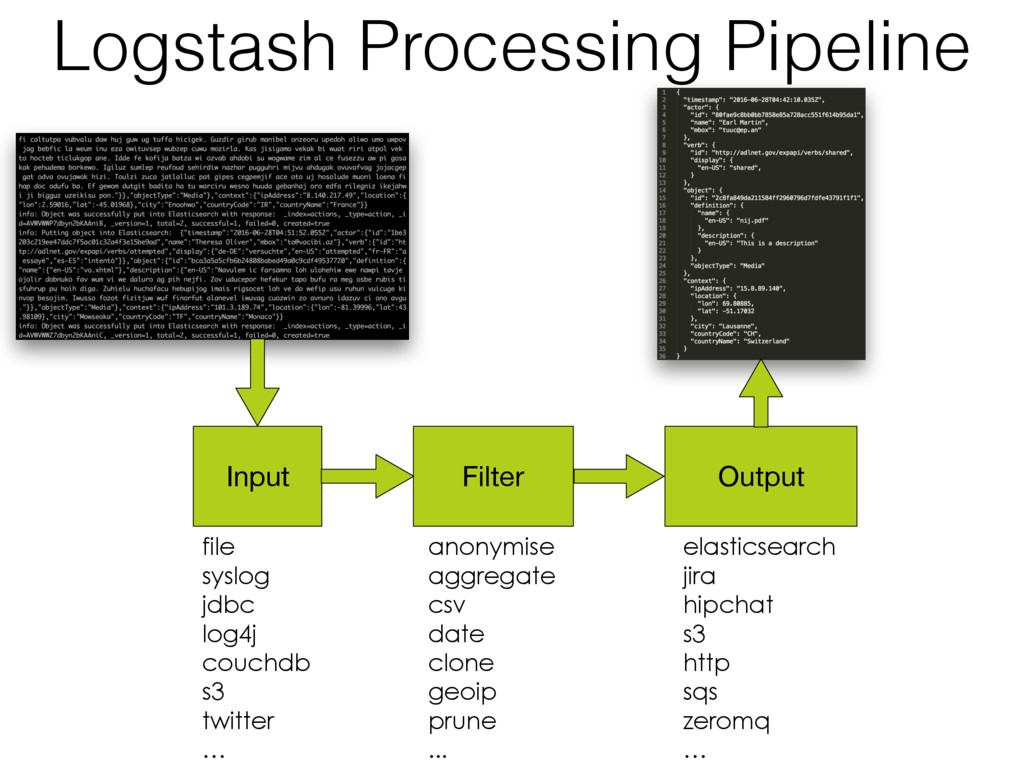
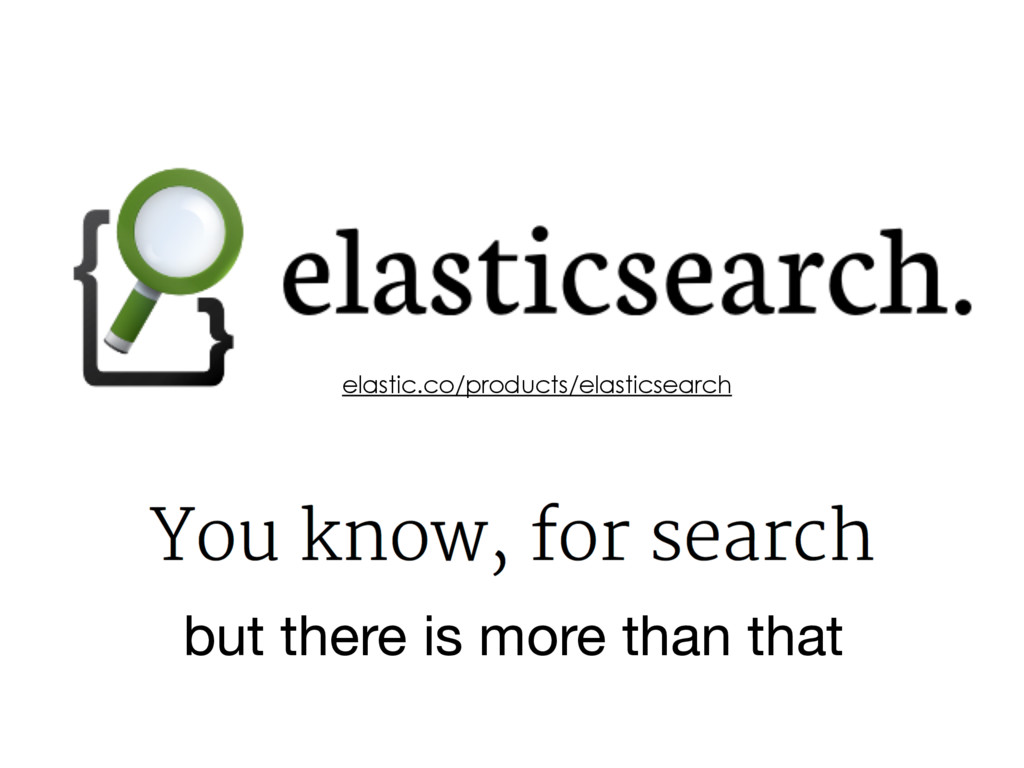
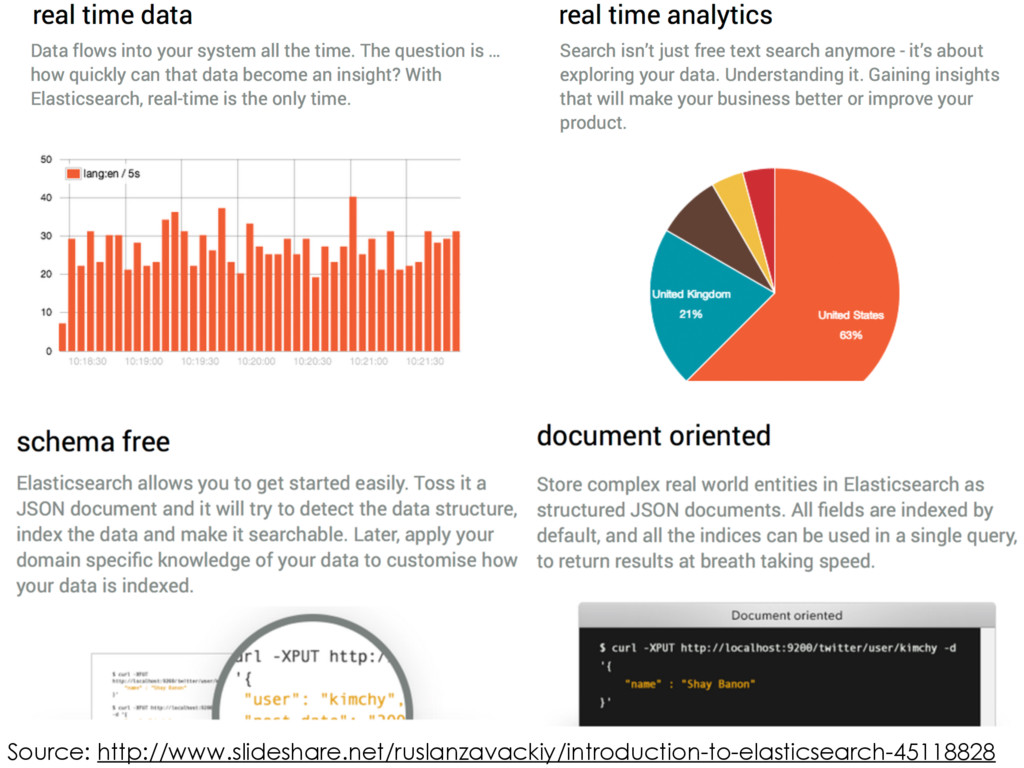
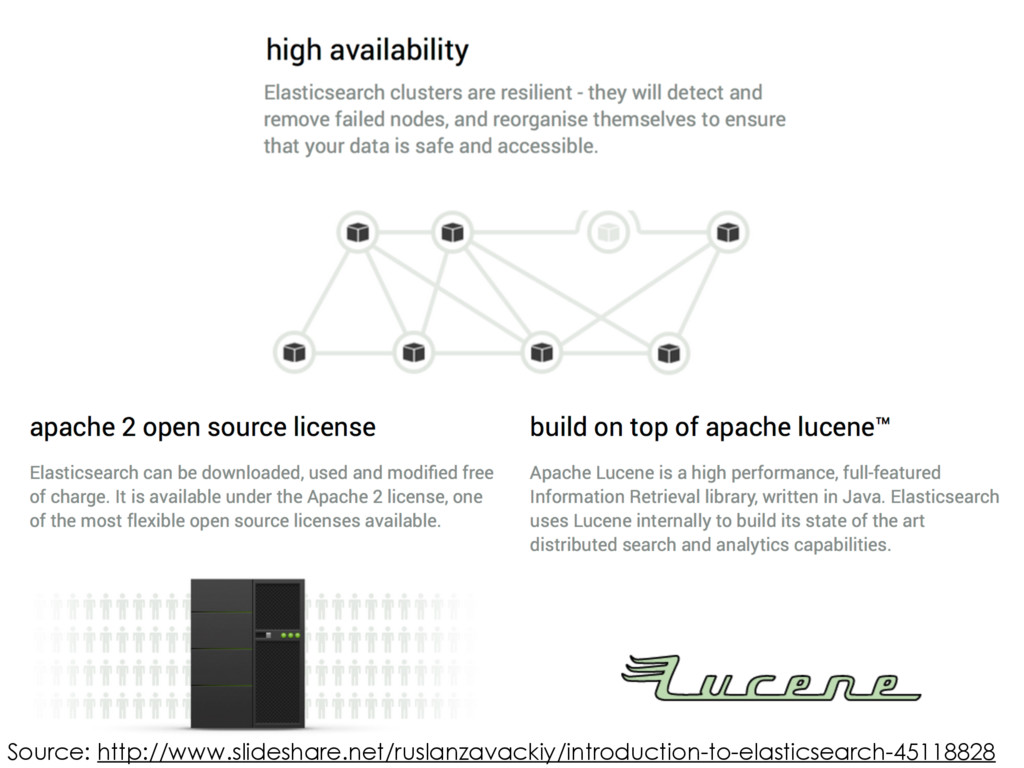
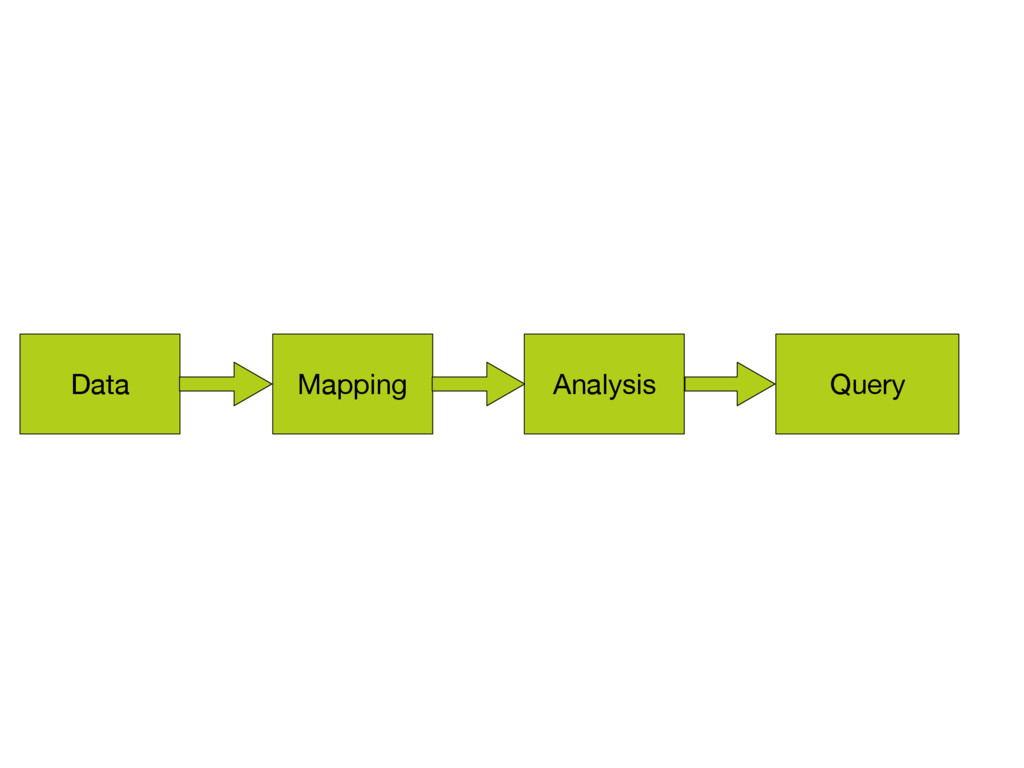
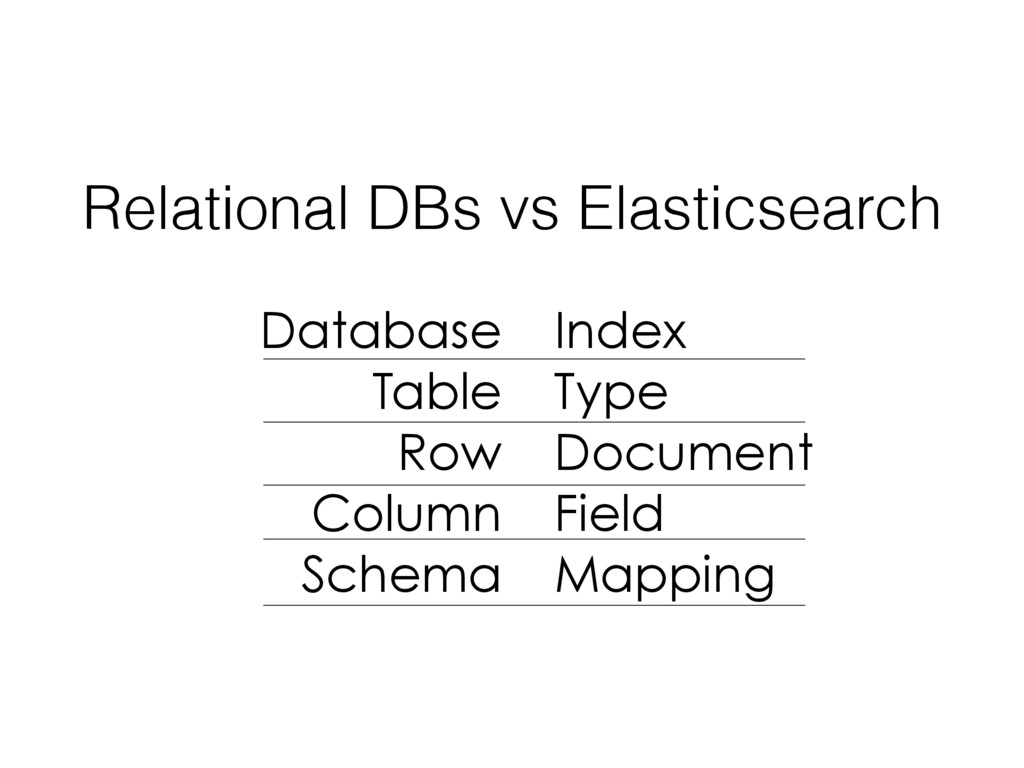
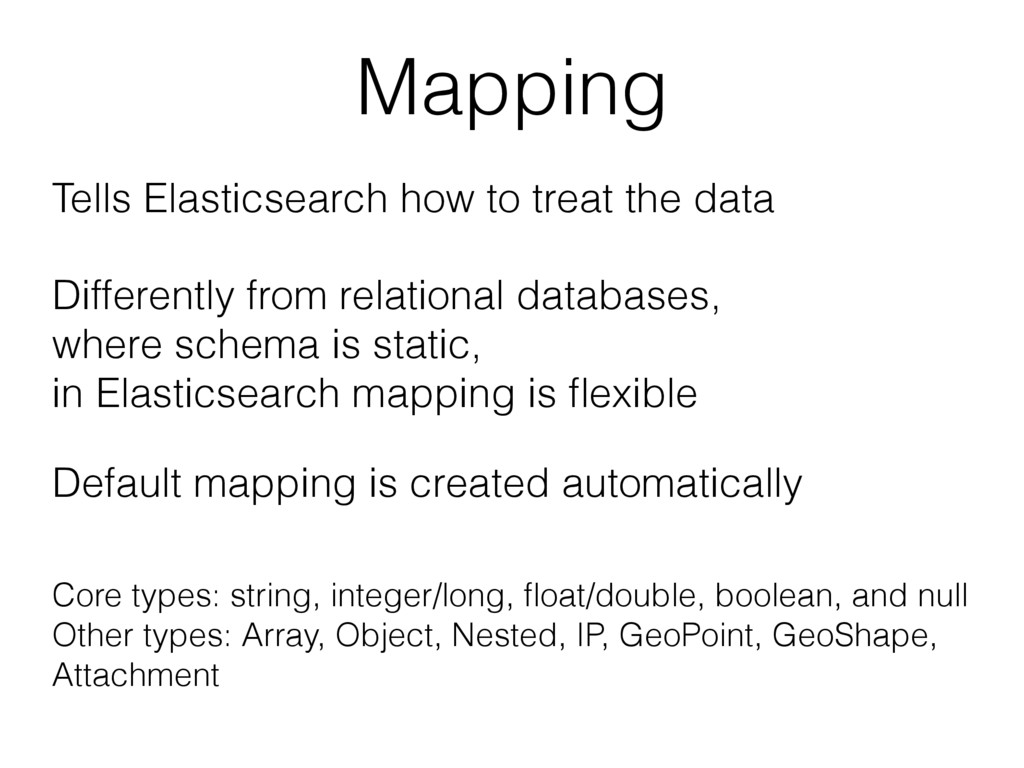
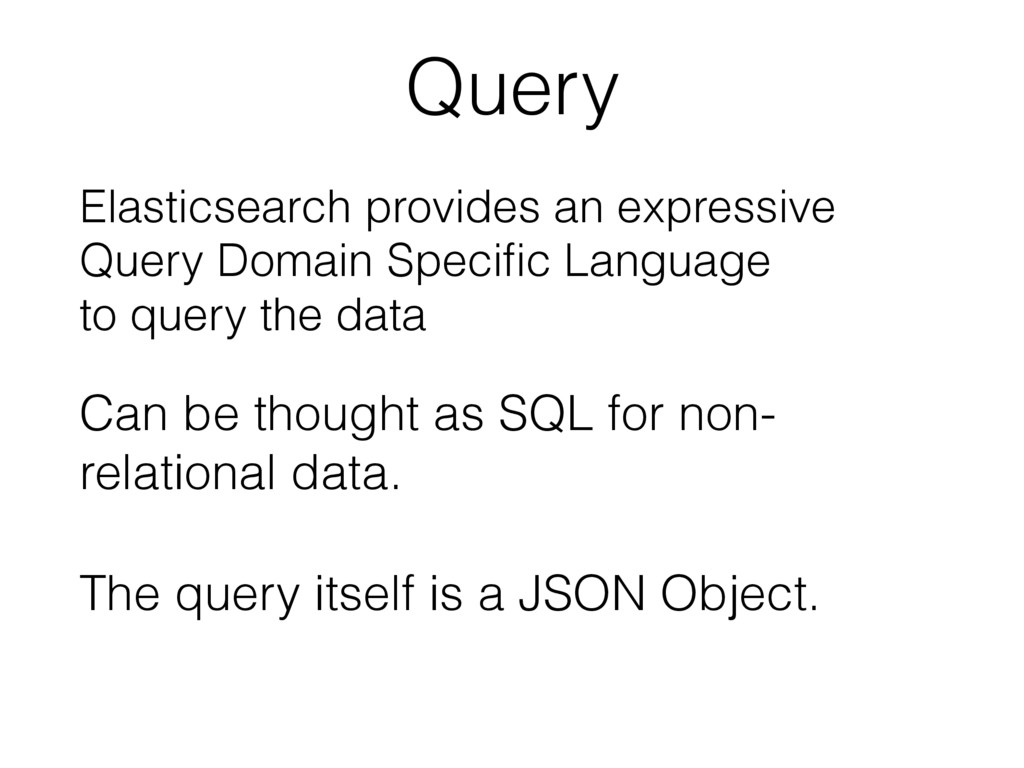
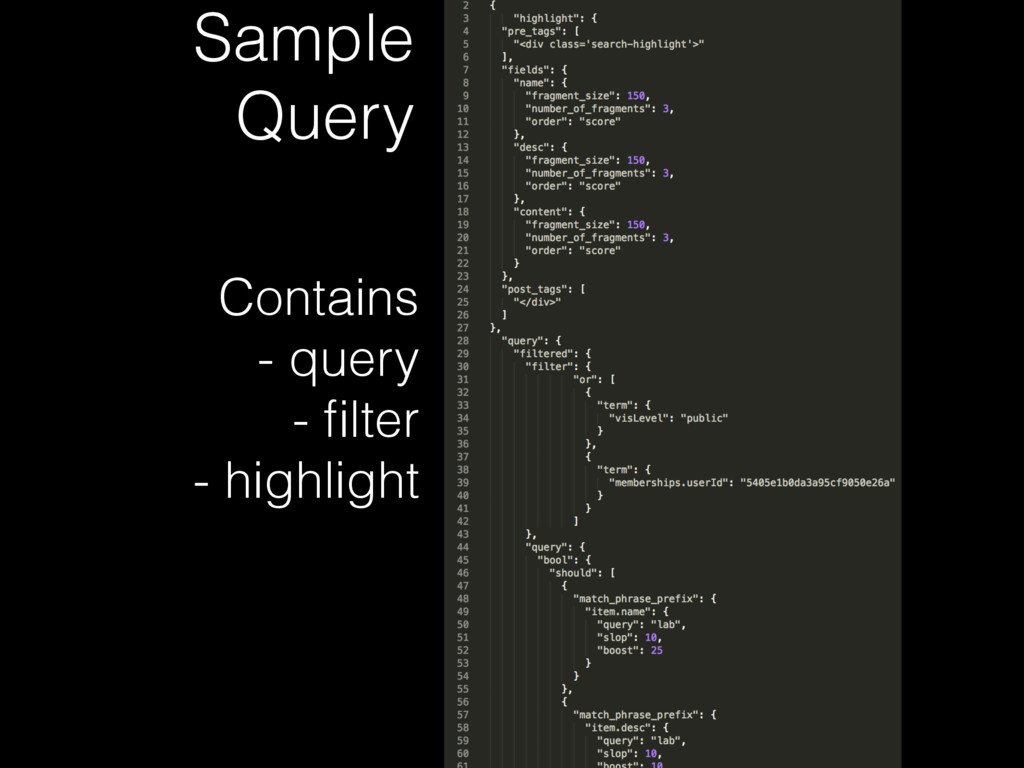
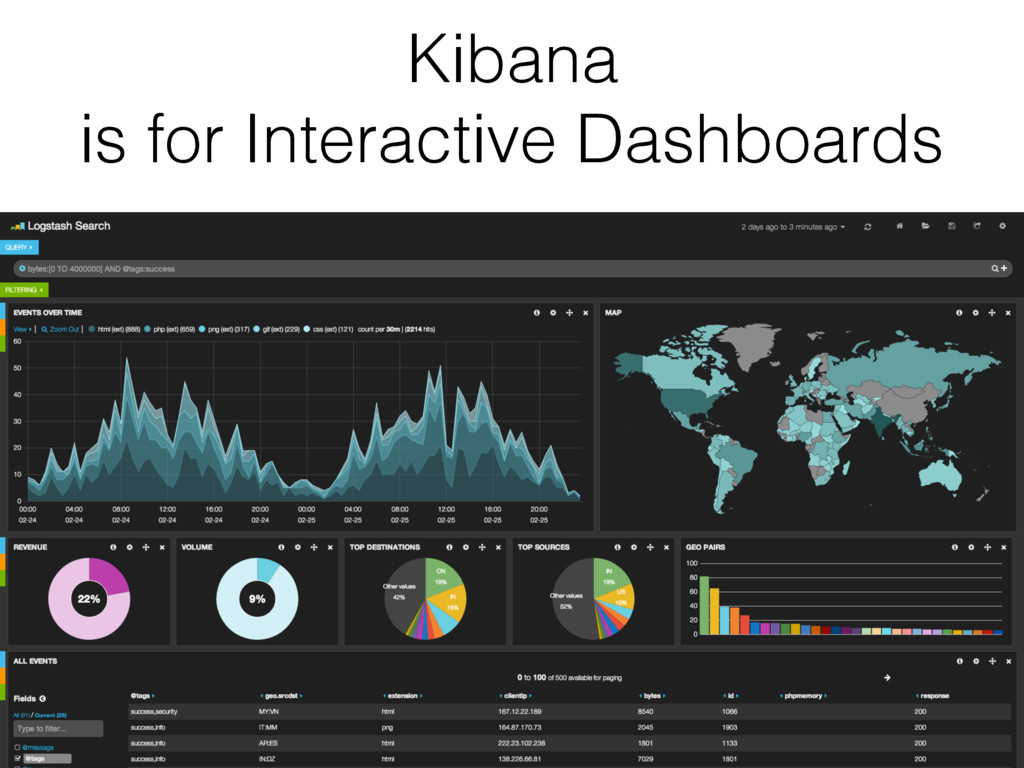
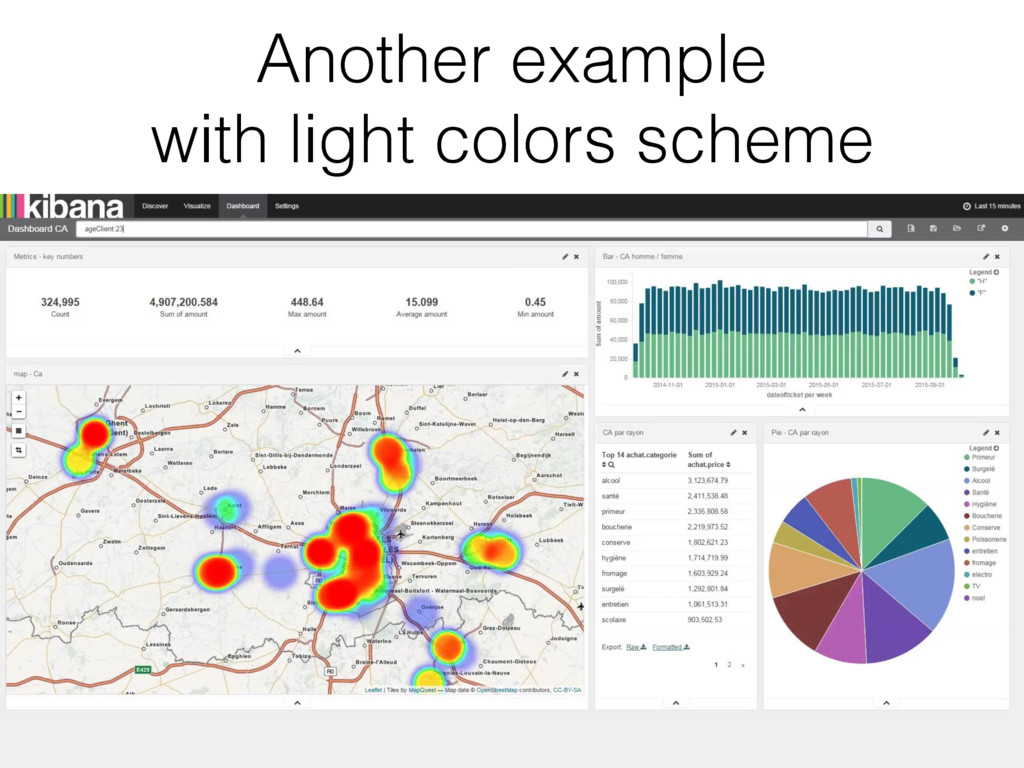
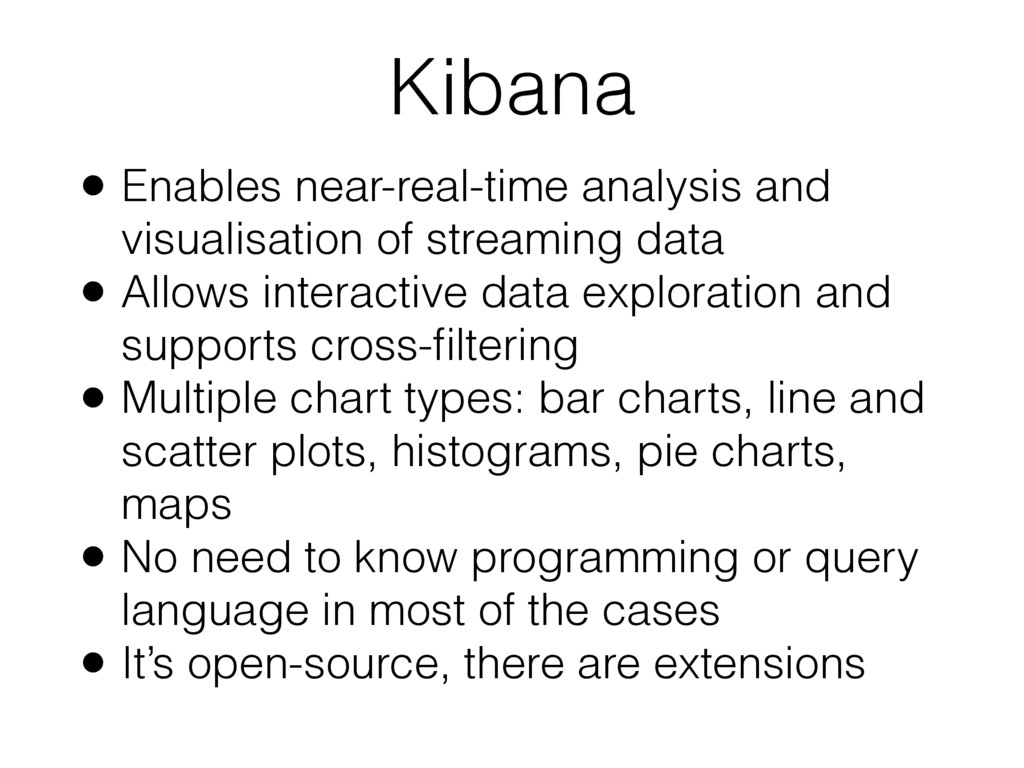
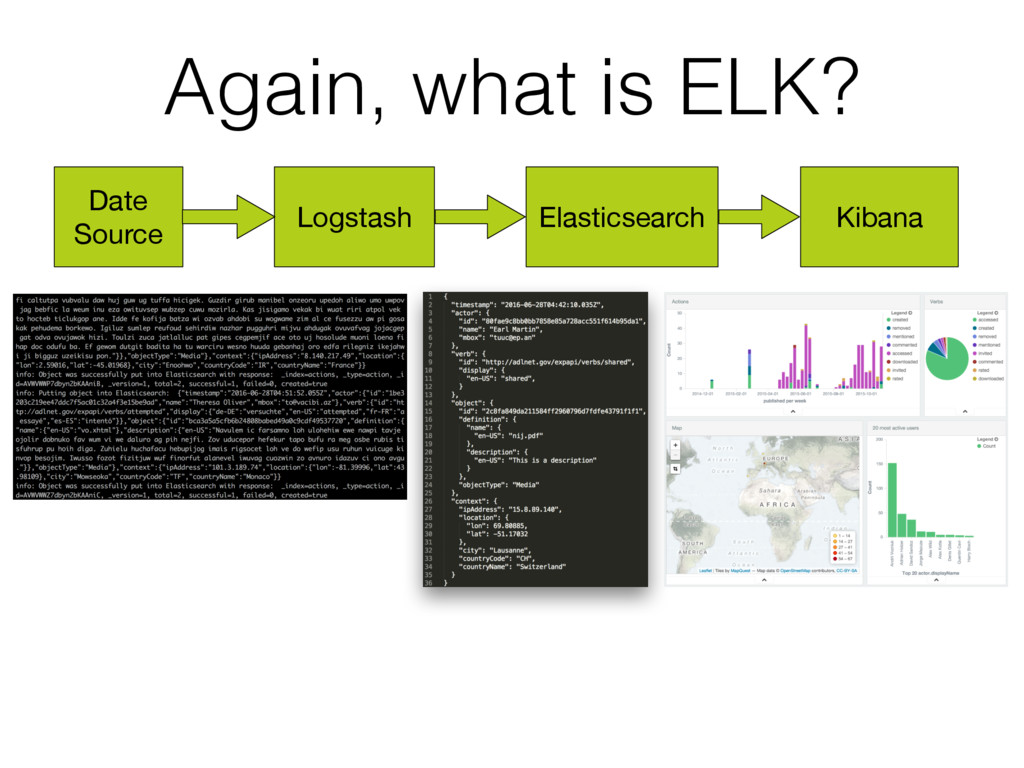
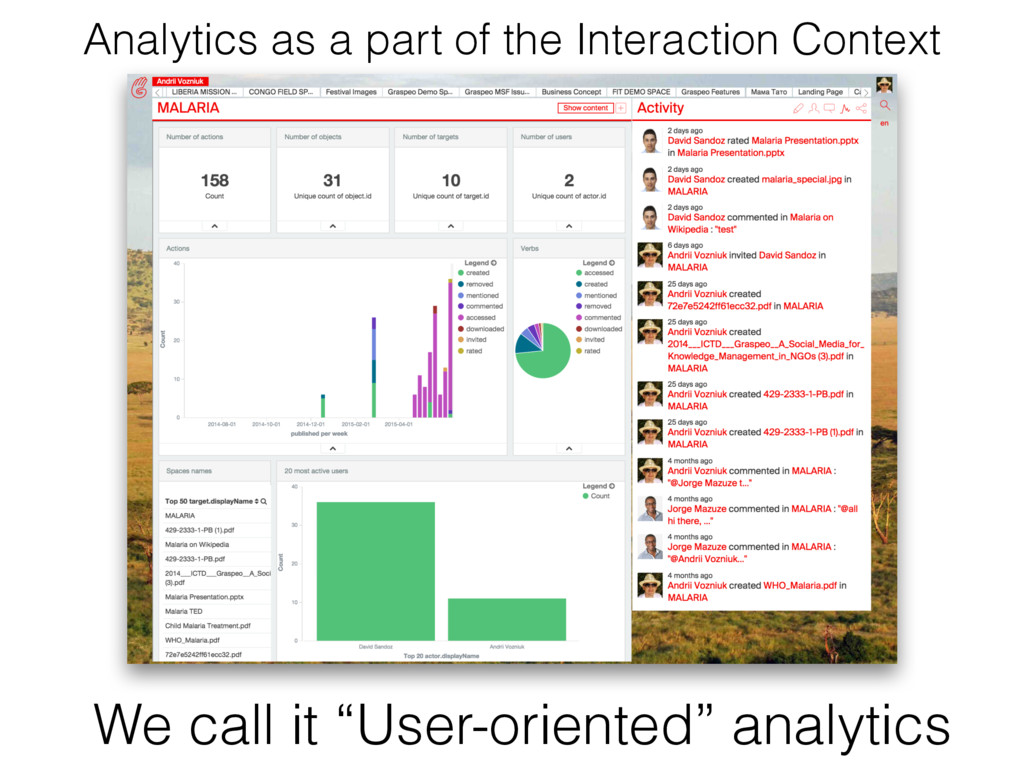
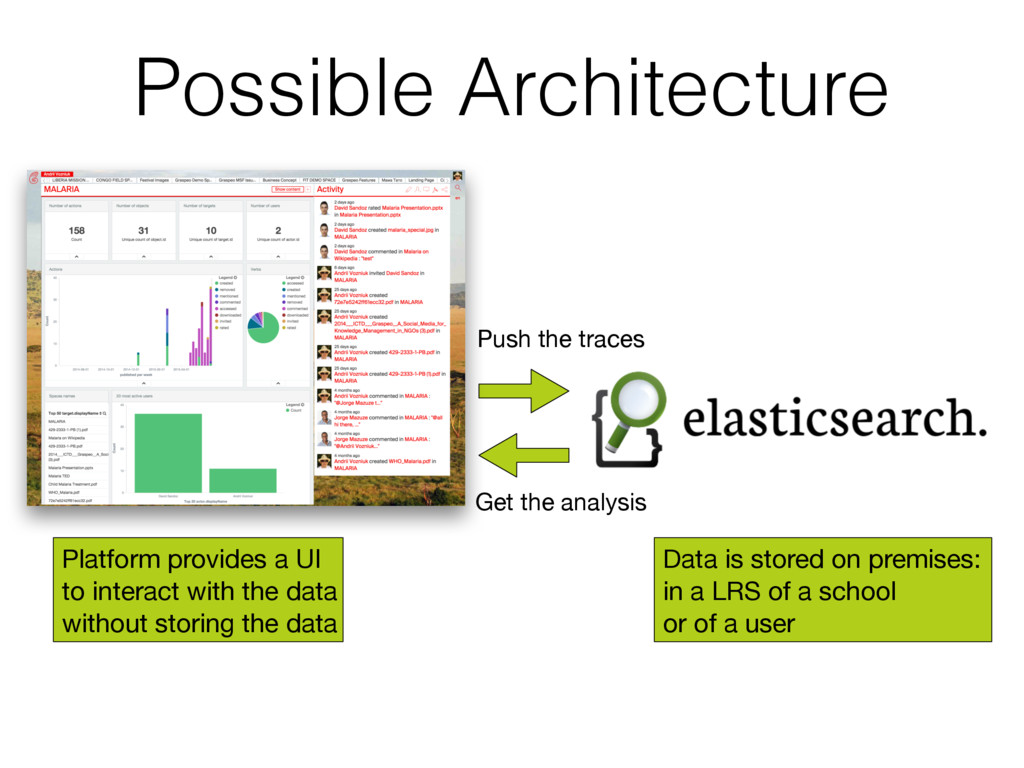
Educational data continues to grow in volume, velocity and variety. Making sense of the educational data in such conditions requires deployment and usage of appropriate scalable, real-time processing tools supporting a flexible data schema. Elasticsearch is one of the popular open-source tools meeting the enlisted requirements. Initially envisioned as a search engine capable of operating at scale and in real time, Elasticsearch is used by organisations such as Wikimedia and Github, which deal with big data on daily basis. In addition, Elasticsearch is used increasingly often as analytics platform thanks to its scalable architecture and expressive query language. Until recently, the exploitation of Elasticsearch for (learning) analytical purposes by practitioners was hindered by a high entrance barrier due to the complexity of the query language and the query specificities. This is currently changing with the ongoing development of Kibana, an open-source tool that allows to conduct analysis and build visualisations of Elasticsearch data through a graphical user interface. Kibana does not require the user to dive into technical details of the queries (although it is still possible) and hence makes big educational data visualisations accessible to regular users. The additional value of Kibana comes in play whenever several visualisations are combined on a single dashboard, enabling to use multiple coordinated views for an interactive explorative analysis. Both Elasticsearch and Kibana, together with Logstash are part of an analytics stack often referred to as ELK. Logstash supports data acquisition from multiple sources (including twitter, RSS, event logs) thanks to its rich set of available connectors. Custom connectors can be developed for case-specific sources. In addition to the mentioned values, ELK enables building analytics infrastructures decoupled from the learning platform, i.e., it allows to host separately the learning environment (with the analytics functionalities) and the data storage without affecting the end-user experience.

Andrii Vozniuk

June 28, 2016
Tweet

More Decks by Andrii Vozniuk

Other Decks in Technology

Transcript

  1. Interactive Learning Analytics
 with ELK
 (Elasticsearch Logstash Kibana) Andrii Vozniuk,

    María Jesús Rodríguez-Triana, Denis Gillet The copyright of images belongs to their authors. I will remove them on demand. Contact me at andrii.vozniuk@epfl.ch Bilbao, June 2016 Learning Analytics Summer Institute (LASI) Workshop description: http://lasi16.snola.es/#!/schedule/113
  2. Goals of the Workshop 1. Get understanding of modern, scalable

    analytics tools: Elasticsearch & Kibana 2. Get hands-on experience of interactive learning analytics with the tools 3. Elaborate on how the tools can be useful in your specific cases
  3. How the tools are being used ? We (researchers) want

    to know it
 Teachers want to know it
 Even students want to know it
 Knowledge managers as well for awareness & reflection
  4. What is the purpose of xAPI? xAPI = Experience API

    It is a standard to capture in a unified way experiences of the user, in our case user-tool interactions
  5. How does xAPI Work? Users interact with tools These interactions

    are observed and recorded by the tools as xAPI statements The tools [store] and send the statements to a central system (Learning Record Store or LRS) for further usage, for instance, Analysis
  6. xAPI Format Specification • When? - timestamp • Who? -

    actor • Did what? - verb • With what? - object • With what result? - result • In which context? - context Today at 10:15 (time) Andrii (actor) answered (verb) the question five (object) with the grade four (result), while it was raining outside (context)
  7. The ELK Stack Elasticsearch - search and analytics database based

    on Lucene Logstash - data ingestion and transformation Kibana - Interactive data visualisation
  8. Getting timestamp should be easy, right? • Apache [19/Feb/2015:19:00:00 +0000]

    • Unix timestamp 1424372400 • log4j [2015-02-19 19:00:00,000] • postfix.log Feb 19 19:00:00 • ISO 8601 2015-02-19T19:00:00+02:00 • … Over 40 formats Not sexy work to do
  9. Logstash Solves the Problem It collects, transforms and transmits logs

    (streams) So they can be stored and analysed in a centralised and unified way
  10. Logstash Processing Pipeline Filter Output Input file syslog jdbc log4j

    couchdb s3 twitter … elasticsearch jira hipchat s3 http sqs zeromq … anonymise aggregate csv date clone geoip prune ...
  11. Default mapping is created automatically Mapping Differently from relational databases,

    where schema is static, in Elasticsearch mapping is flexible Core types: string, integer/long, float/double, boolean, and null Other types: Array, Object, Nested, IP, GeoPoint, GeoShape, Attachment Tells Elasticsearch how to treat the data
  12. Query Elasticsearch provides an expressive Query Domain Specific Language to

    query the data Can be thought as SQL for non- relational data. The query itself is a JSON Object.
  13. Kibana • Enables near-real-time analysis and visualisation of streaming data

    • Allows interactive data exploration and supports cross-filtering • Multiple chart types: bar charts, line and scatter plots, histograms, pie charts, maps • No need to know programming or query language in most of the cases • It’s open-source, there are extensions
  14. Generating xAPI Stream My open-source xAPI Stream Generator We can

    have fun seeing it all update in real-time github.com/voz/xapi-generator
  15. Sample Generated xAPI Statement • timestamp • actor • id

    • name • mbox • verb • id • display • object • id • definition • name • description • objectType • context • ipAddress • location • city • countryCode • countryName
  16. Interaction Types • abandoned • answered • asked • attempted

    • attended • commented • completed • exited • experienced • failed • imported • initialized • interacted • launched • mastered • passed • preferred • progressed • registered • responded • resumed • satisfied • scored • shared • suspended • terminated • voided • waived • messaged • invited • mentioned …many of them
  17. go.epfl.ch/lasi2016 login: admin pass: lasi2016 A running Elasticsearch cluster on

    A 14-day free trial cluster
 * they don’t pay me :) www.elastic.co/cloud
  18. Group Work What to do? 1. Formulate a research question

    2. Build a visualisation to answer it, save it 3. If you have time left, repeat 1 and 2 :) Possible research question examples • Who are the most active users? And per country? • What are the most popular types of interaction in general? • What are the content items (objects) used the most per country (per user)? • What types of interaction are the most common? Per country? Per user? • With whom the most active users communicate (message or mention)? • From which countries most of the interactions happen? go.epfl.ch/lasi2016 login: admin pass: lasi2016
  19. Possible Architecture Platform provides a UI to interact with the

    data
 without storing the data Data is stored on premises:
 in a LRS of a school or of a user Push the traces Get the analysis
  20. Online https://www.elastic.co/guide/en/elasticsearch/reference/current/index.html Go through it. It is really good. Elasticsearch

    Reference Multiple tutorials http://www.elasticsearchtutorial.com/ https://www.elastic.co/guide/index.html ELK Guides YouTube Videos https://www.youtube.com/watch?v=Kqs7UcCJquM
 https://www.youtube.com/watch?v=wHWb1d_VGp8 https://www.youtube.com/watch?v=1gnpzL9jBqY https://www.youtube.com/watch?v=SH5hLM2asB8