with PhD research in Magnetic Resonance Spectroscopy. Ex Insight Data Science Fellow. Ex Researcher at IBM Research doing ML for development. Interested in democratizing ML. I really like soccer and scrabble. Wale, A. (Data Scientist & Physicist) @ML4ALL Portland, OR April 29, 2019 4 / 39
”More data beats clever algorithms, but better data beats more data” - Peter Norvig Wale, A. (Data Scientist & Physicist) @ML4ALL Portland, OR April 29, 2019 6 / 39
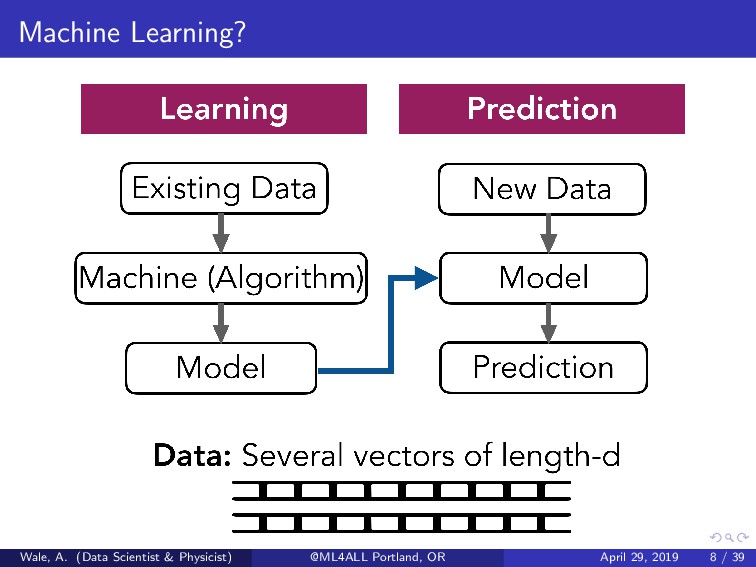
into a machine learning model. What are features? Variables found in a given problem set that can sufficiently help in building an accurate predictive model. They represent the knowledge appropriate for machine learning algorithms. Wale, A. (Data Scientist & Physicist) @ML4ALL Portland, OR April 29, 2019 7 / 39
most accurately represent the underlying structure of the data and therefore create the best model. Features in your data will influence the results that your predictive model can achieve. Wale, A. (Data Scientist & Physicist) @ML4ALL Portland, OR April 29, 2019 9 / 39
on relatively small datasets Including too much correlated variables can decreae the model performance (large p vs n). More variables can make the model less interpretable (p vs large n). Interpretability-Accuracy tradeoff. Generalizability of models to other data. Wale, A. (Data Scientist & Physicist) @ML4ALL Portland, OR April 29, 2019 10 / 39
Plan and practice 2 Begin to create and improvise 3 Review and revise 4 Refine your thinking by interpreting/explaining 5 Share and reflect Wale, A. (Data Scientist & Physicist) @ML4ALL Portland, OR April 29, 2019 11 / 39
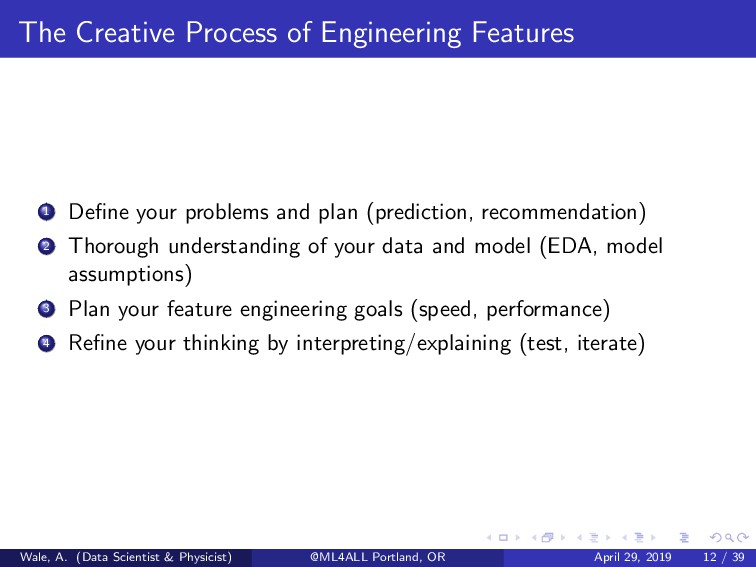
and plan (prediction, recommendation) 2 Thorough understanding of your data and model (EDA, model assumptions) 3 Plan your feature engineering goals (speed, performance) 4 Refine your thinking by interpreting/explaining (test, iterate) Wale, A. (Data Scientist & Physicist) @ML4ALL Portland, OR April 29, 2019 12 / 39
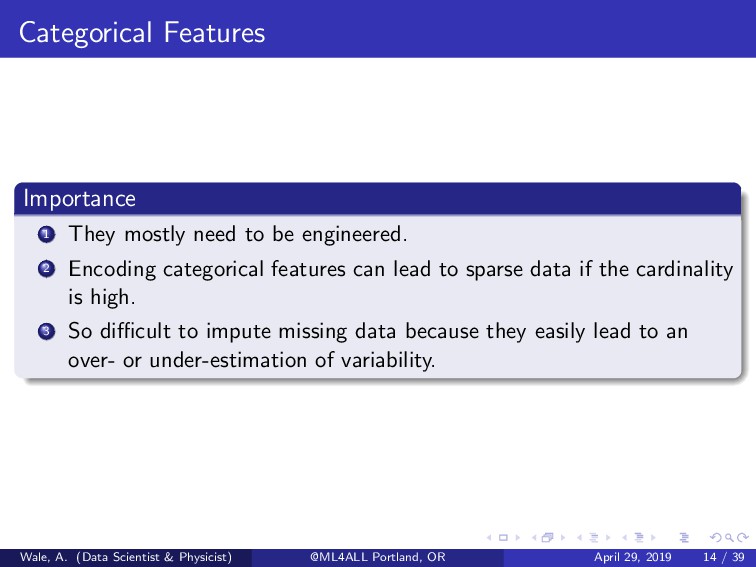
2 Encoding categorical features can lead to sparse data if the cardinality is high. 3 So difficult to impute missing data because they easily lead to an over- or under-estimation of variability. Wale, A. (Data Scientist & Physicist) @ML4ALL Portland, OR April 29, 2019 14 / 39
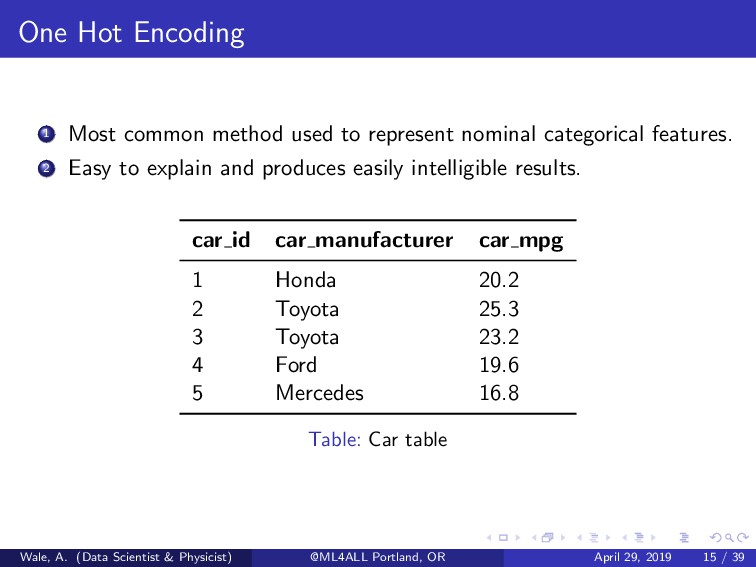
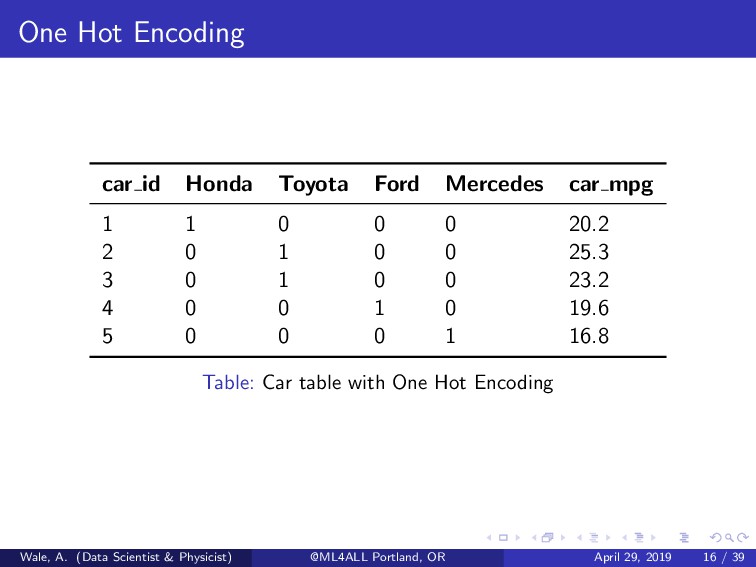
nominal categorical features. 2 Easy to explain and produces easily intelligible results. car id car manufacturer car mpg 1 Honda 20.2 2 Toyota 25.3 3 Toyota 23.2 4 Ford 19.6 5 Mercedes 16.8 Table: Car table Wale, A. (Data Scientist & Physicist) @ML4ALL Portland, OR April 29, 2019 15 / 39
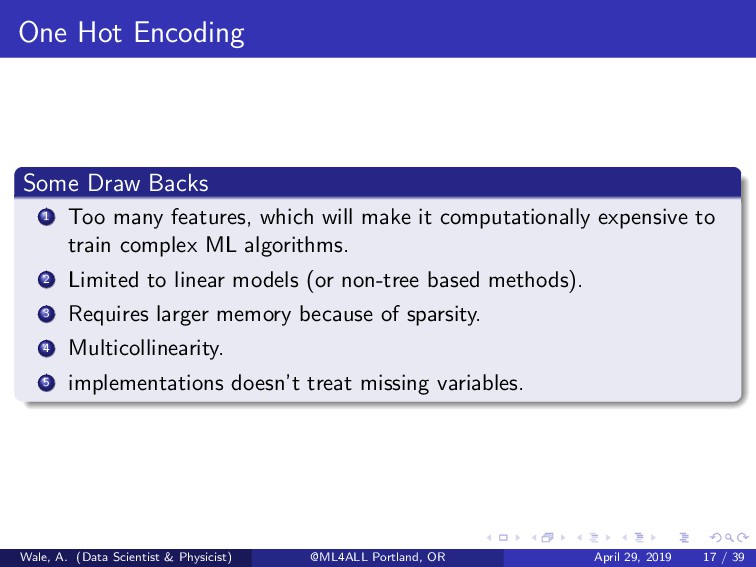
which will make it computationally expensive to train complex ML algorithms. 2 Limited to linear models (or non-tree based methods). 3 Requires larger memory because of sparsity. 4 Multicollinearity. 5 implementations doesn’t treat missing variables. Wale, A. (Data Scientist & Physicist) @ML4ALL Portland, OR April 29, 2019 17 / 39
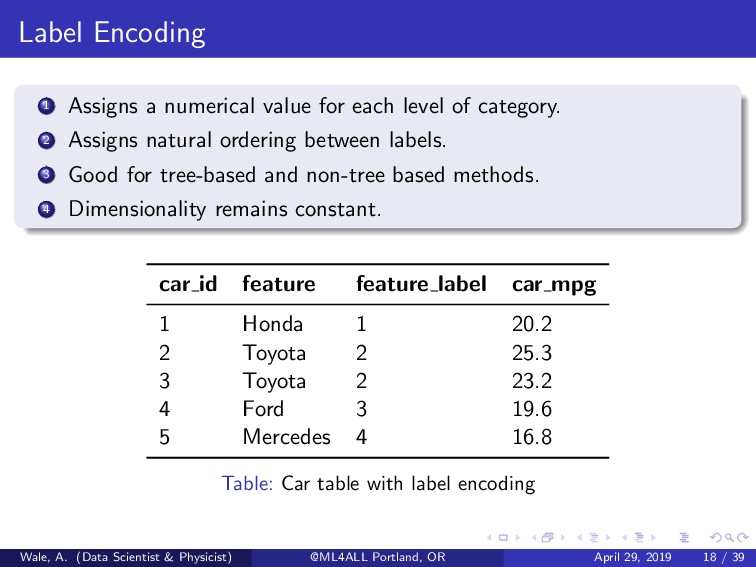
of category. 2 Assigns natural ordering between labels. 3 Good for tree-based and non-tree based methods. 4 Dimensionality remains constant. car id feature feature label car mpg 1 Honda 1 20.2 2 Toyota 2 25.3 3 Toyota 2 23.2 4 Ford 3 19.6 5 Mercedes 4 16.8 Table: Car table with label encoding Wale, A. (Data Scientist & Physicist) @ML4ALL Portland, OR April 29, 2019 18 / 39
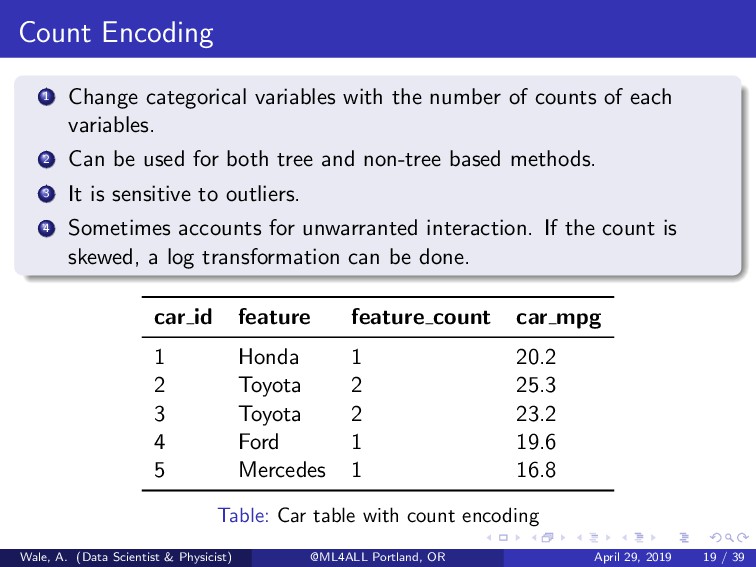
counts of each variables. 2 Can be used for both tree and non-tree based methods. 3 It is sensitive to outliers. 4 Sometimes accounts for unwarranted interaction. If the count is skewed, a log transformation can be done. car id feature feature count car mpg 1 Honda 1 20.2 2 Toyota 2 25.3 3 Toyota 2 23.2 4 Ford 1 19.6 5 Mercedes 1 16.8 Table: Car table with count encoding Wale, A. (Data Scientist & Physicist) @ML4ALL Portland, OR April 29, 2019 19 / 39
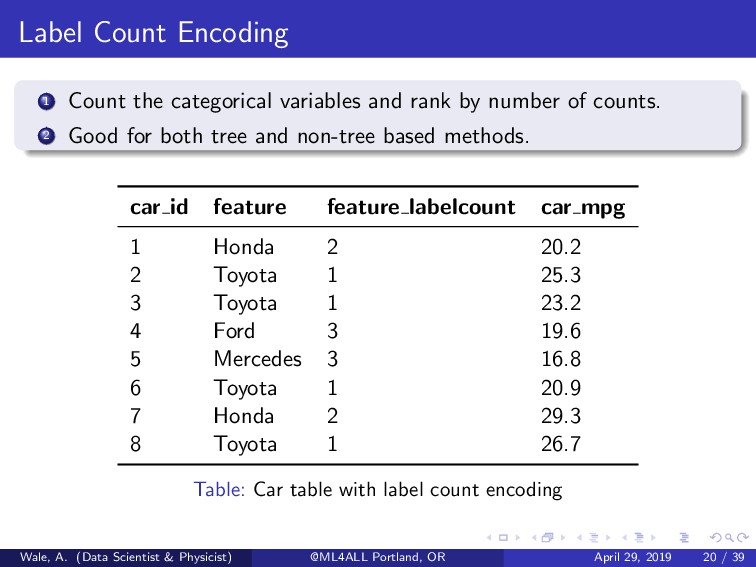
by number of counts. 2 Good for both tree and non-tree based methods. car id feature feature labelcount car mpg 1 Honda 2 20.2 2 Toyota 1 25.3 3 Toyota 1 23.2 4 Ford 3 19.6 5 Mercedes 3 16.8 6 Toyota 1 20.9 7 Honda 2 29.3 8 Toyota 1 26.7 Table: Car table with label count encoding Wale, A. (Data Scientist & Physicist) @ML4ALL Portland, OR April 29, 2019 20 / 39
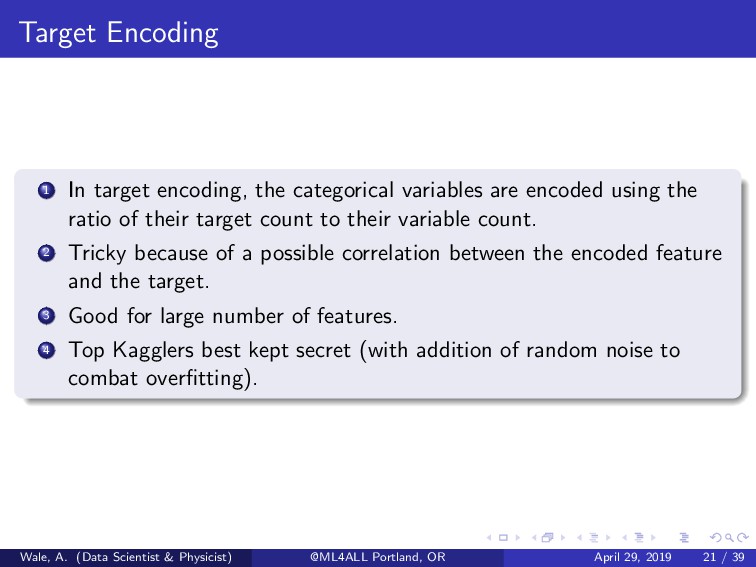
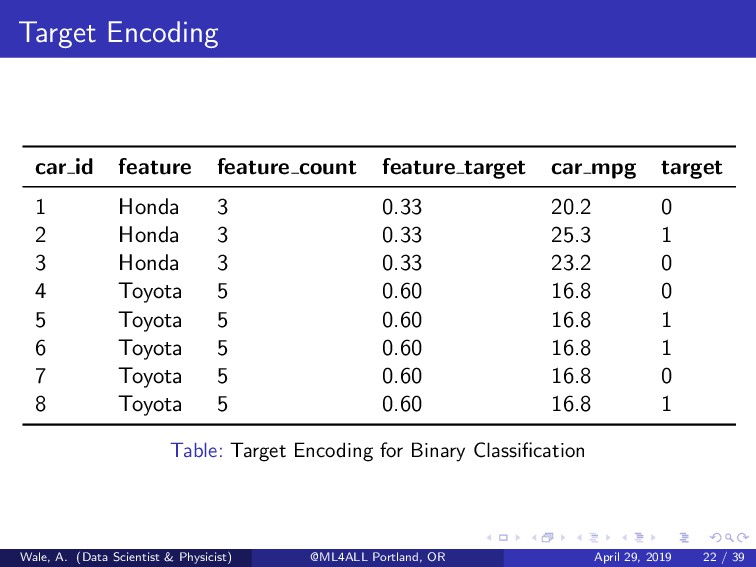
encoded using the ratio of their target count to their variable count. 2 Tricky because of a possible correlation between the encoded feature and the target. 3 Good for large number of features. 4 Top Kagglers best kept secret (with addition of random noise to combat overfitting). Wale, A. (Data Scientist & Physicist) @ML4ALL Portland, OR April 29, 2019 21 / 39
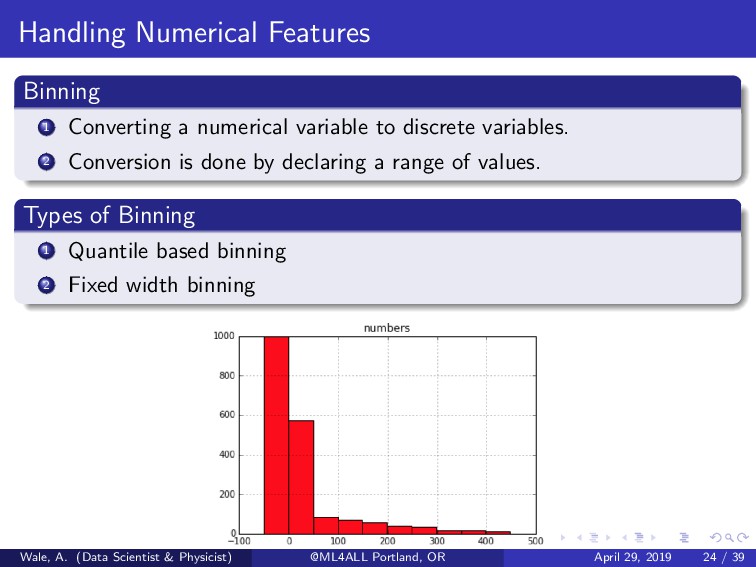
discrete variables. 2 Conversion is done by declaring a range of values. Types of Binning 1 Quantile based binning 2 Fixed width binning Wale, A. (Data Scientist & Physicist) @ML4ALL Portland, OR April 29, 2019 24 / 39
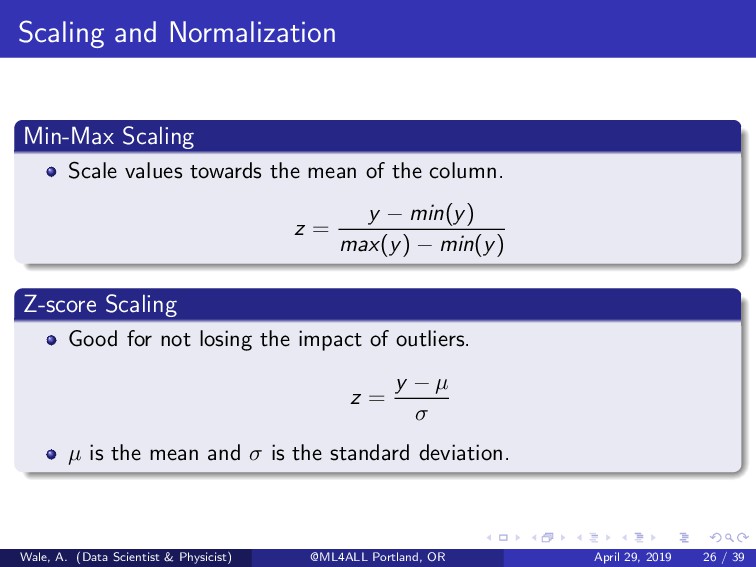
of the column. z = y − min(y) max(y) − min(y) Z-score Scaling Good for not losing the impact of outliers. z = y − µ σ µ is the mean and σ is the standard deviation. Wale, A. (Data Scientist & Physicist) @ML4ALL Portland, OR April 29, 2019 26 / 39
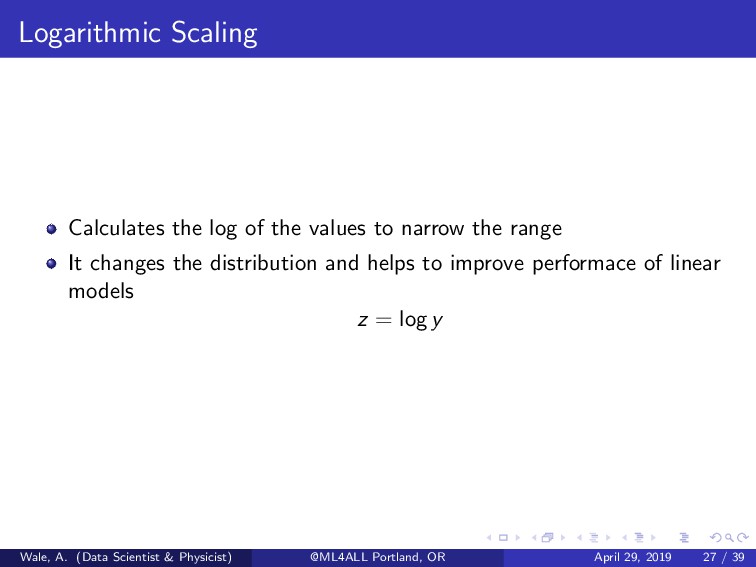
the range It changes the distribution and helps to improve performace of linear models z = log y Wale, A. (Data Scientist & Physicist) @ML4ALL Portland, OR April 29, 2019 27 / 39
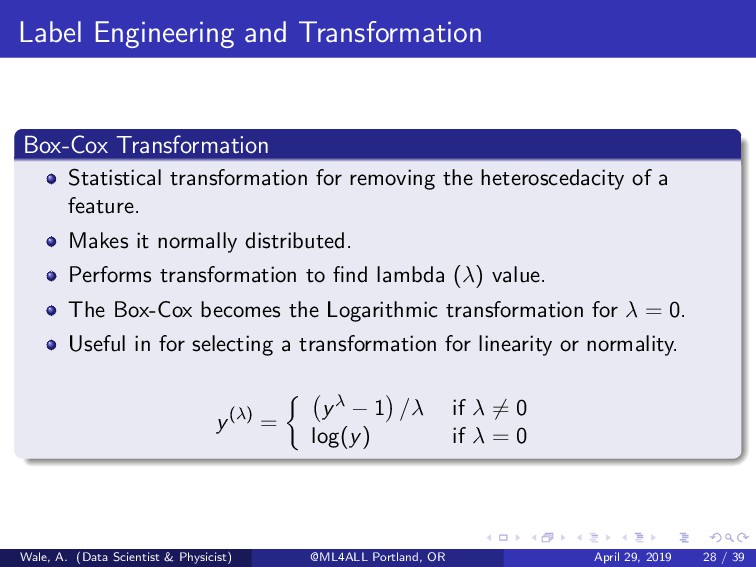
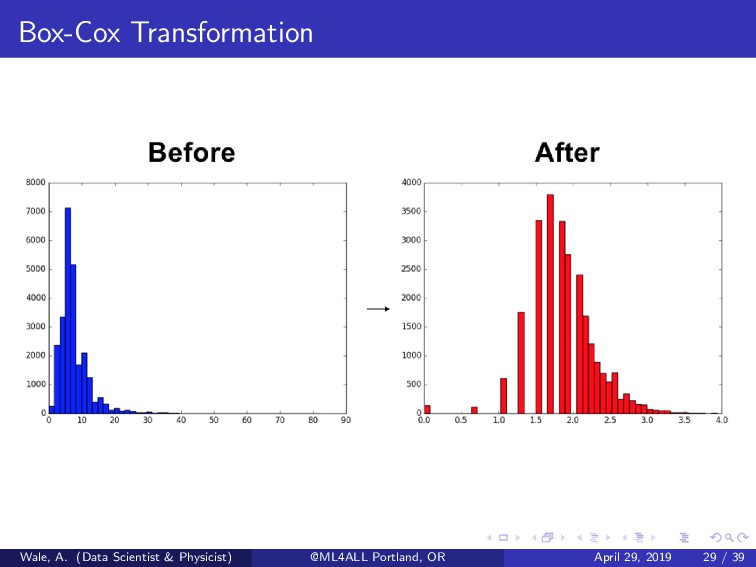
the heteroscedacity of a feature. Makes it normally distributed. Performs transformation to find lambda (λ) value. The Box-Cox becomes the Logarithmic transformation for λ = 0. Useful in for selecting a transformation for linearity or normality. y(λ) = yλ − 1 /λ if λ = 0 log(y) if λ = 0 Wale, A. (Data Scientist & Physicist) @ML4ALL Portland, OR April 29, 2019 28 / 39
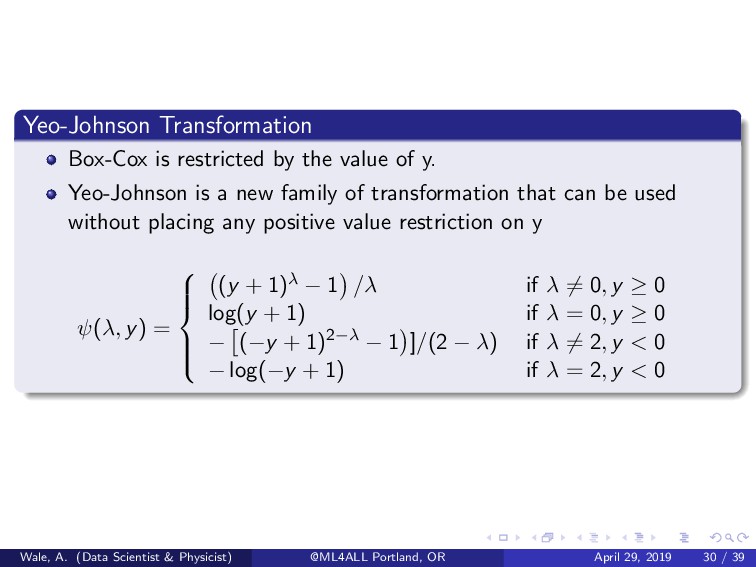
Yeo-Johnson is a new family of transformation that can be used without placing any positive value restriction on y ψ(λ, y) = (y + 1)λ − 1 /λ if λ = 0, y ≥ 0 log(y + 1) if λ = 0, y ≥ 0 − (−y + 1)2−λ − 1 ]/(2 − λ) if λ = 2, y < 0 − log(−y + 1) if λ = 2, y < 0 Wale, A. (Data Scientist & Physicist) @ML4ALL Portland, OR April 29, 2019 30 / 39
season Time since particular event Number left until recent holiday Or just a random date Difference between dates datetime feature1 - datetime feature2 Wale, A. (Data Scientist & Physicist) @ML4ALL Portland, OR April 29, 2019 32 / 39
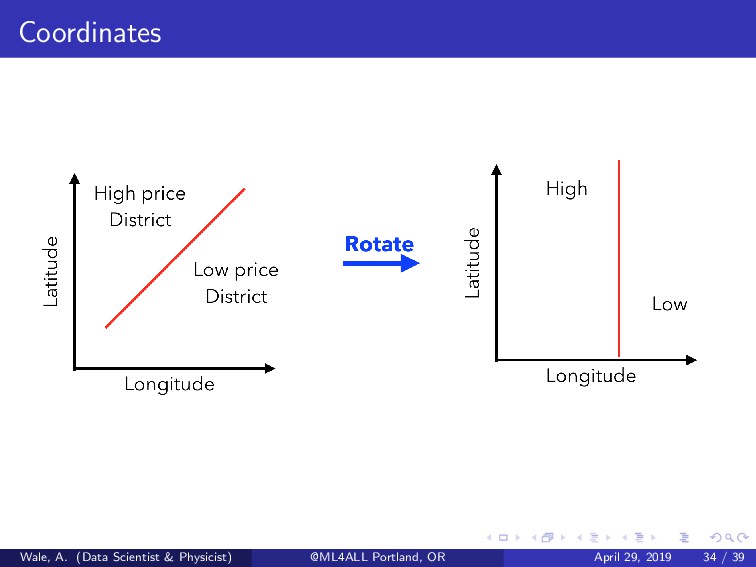
reference or major hub Aggregated statistics (for a particular area) For tree based methods, including a feature that describes the rotation of the longitude and latitude is useful. Wale, A. (Data Scientist & Physicist) @ML4ALL Portland, OR April 29, 2019 33 / 39
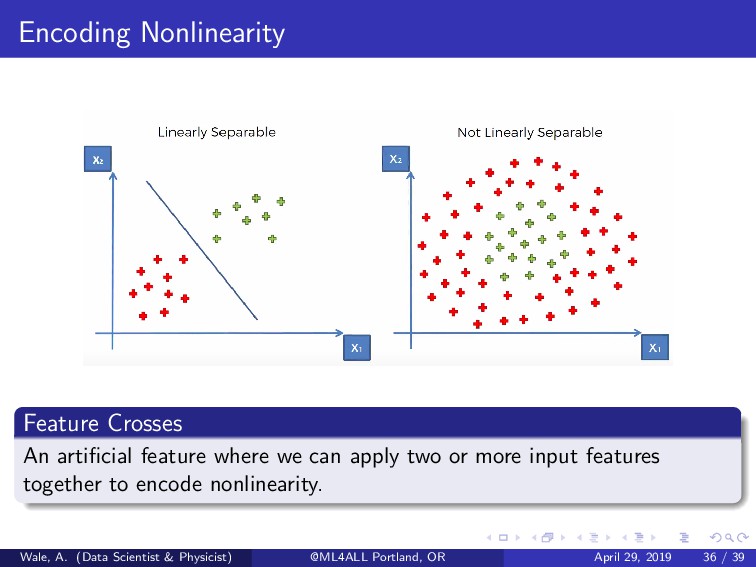
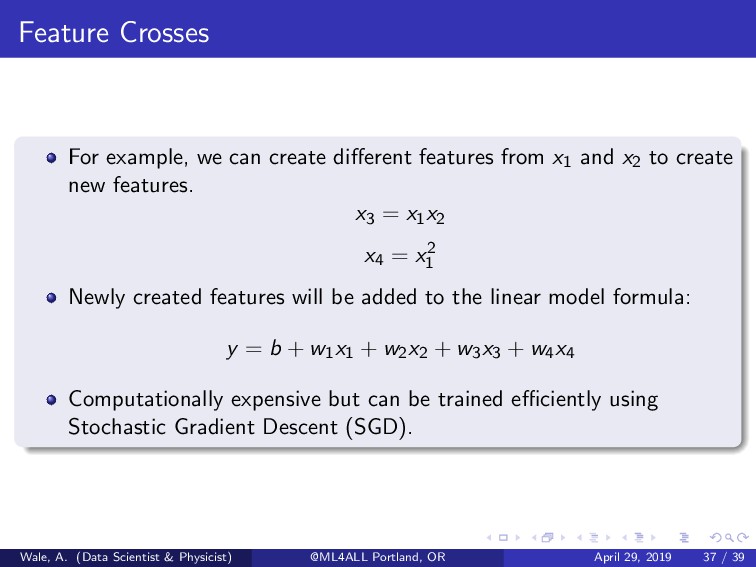
x1 and x2 to create new features. x3 = x1x2 x4 = x2 1 Newly created features will be added to the linear model formula: y = b + w1x1 + w2x2 + w3x3 + w4x4 Computationally expensive but can be trained efficiently using Stochastic Gradient Descent (SGD). Wale, A. (Data Scientist & Physicist) @ML4ALL Portland, OR April 29, 2019 37 / 39