Upgrade to Pro — share decks privately, control downloads, hide ads and more …

Segmenting Biodiversity

wboykinm
April 19, 2012

Segmenting Biodiversity

Spatial Non-Stationarity in Global Patterns of Biodiversity: Mapping the Drivers of Terrestrial Vertebrate Species Richness

wboykinm

April 19, 2012
Tweet

More Decks by wboykinm

Other Decks in Science

Transcript

  1. Spatial Non-Stationarity in Global Patterns of Biodiversity: Mapping the Drivers

    of Terrestrial Vertebrate Species Richness Bill Morris University of Vermont Dept. of Plant & Soil Science
  2. Question 1: Are relationships explaining Terrestrial Vertebrate Species Richness (TVSR)

    spatially non-stationary? Question 2: Where are spatial patterns of TVSR driven by similar combinations of factors?
  3. Input Data: Terrestrial Species Richness Reported at the Ecoregion Level

    Data: Global Ecoregions, provided by the World Wildlife Fund
  4. Known Influences On Species Richness  Biophysical Variables: Mean Elevation

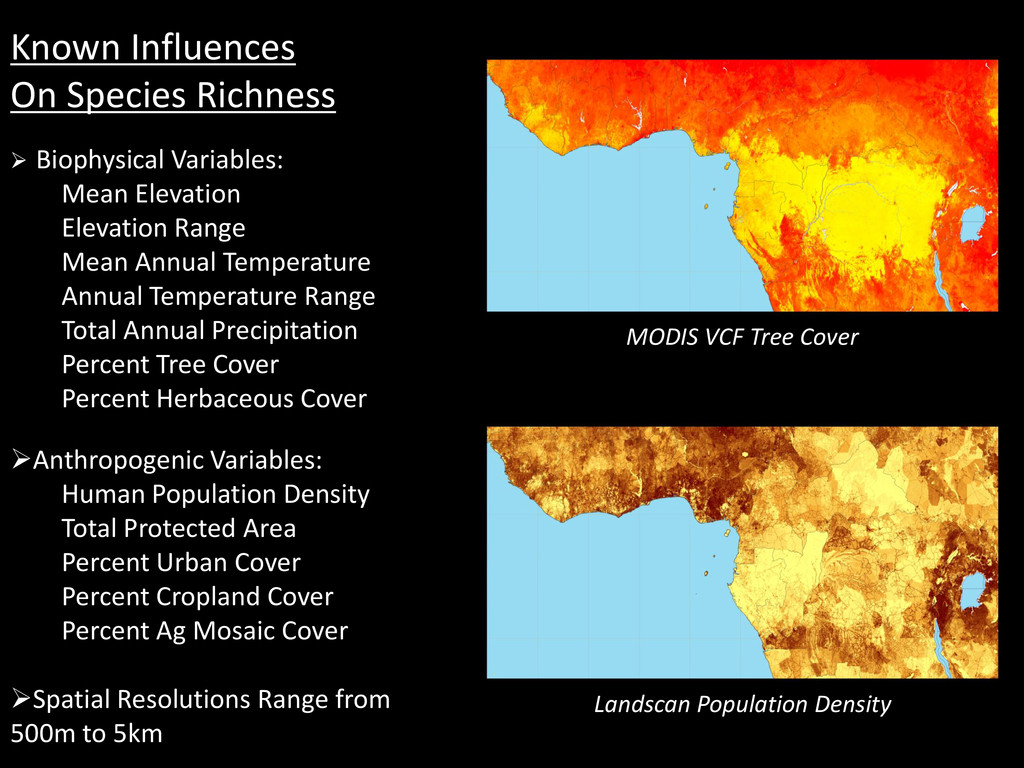
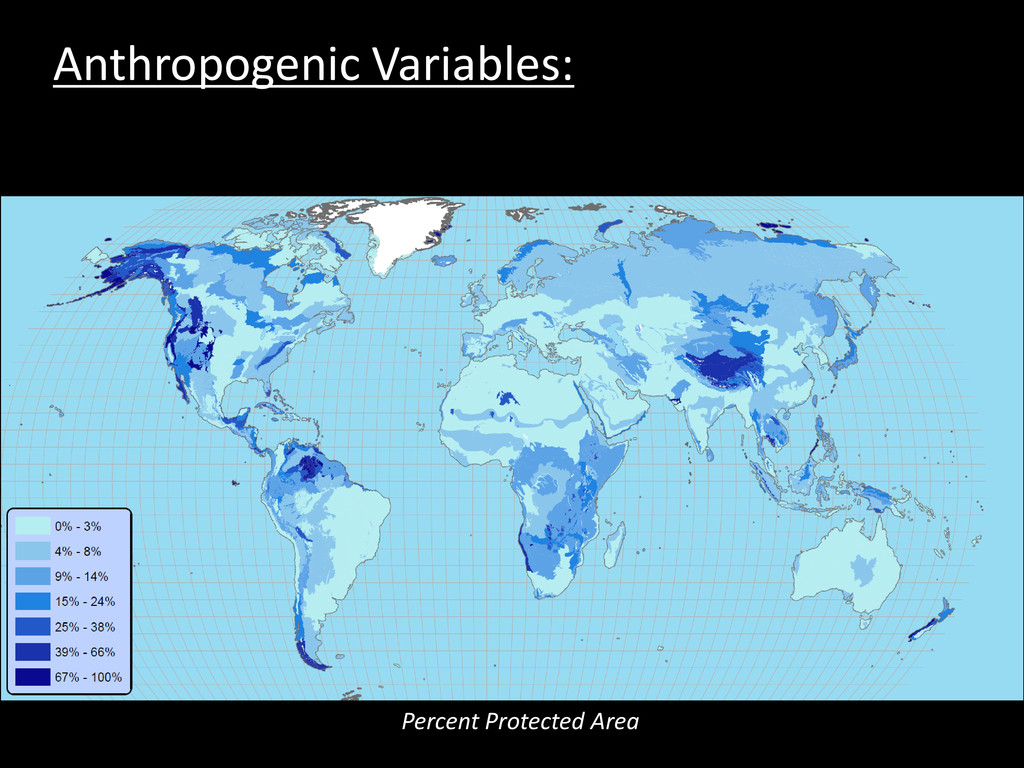
    Elevation Range Mean Annual Temperature Annual Temperature Range Total Annual Precipitation Percent Tree Cover Percent Herbaceous Cover Anthropogenic Variables: Human Population Density Total Protected Area Percent Urban Cover Percent Cropland Cover Percent Ag Mosaic Cover Spatial Resolutions Range from 500m to 5km MODIS VCF Tree Cover Landscan Population Density
  5. Data Preparation: 1. Acquired input variable datasets at global scale

    and best-available spatial resolution Human Population Density Data: Landscan 2008, provided by Oak Ridge National Laboratory
  6. Data Preparation: 2. Overlaid WWF ecoregion polygons, excluding polar zones

    and ecoregions <10km2 Ecoregion Polygons Data: Global Ecoregions, provided by World Wildlife Fund
  7. Data Preparation: 3. Extracted variable means for each ecoregion polygon

    (“Zonal Statistics”) Mean Human Population Density Per Ecoregion
  8. Mean Annual Temperature (C) Annual Temperature Range Biophysical Variables: Total

    Annual Precipitation (mm) Mean Elevation (m) Within-Ecoregion Elevation Range Percent Tree Cover Percent Herbaceous Vegetation Cover
  9. Anthropogenic Variables: Percent Cropland Cover Percent Agricultural Mosaic Cover Percent

    Urban Cover Human Population Density (per sqkm) Percent Protected Area
  10. Answering Question 1: X Axis = Average Annual Temperature X

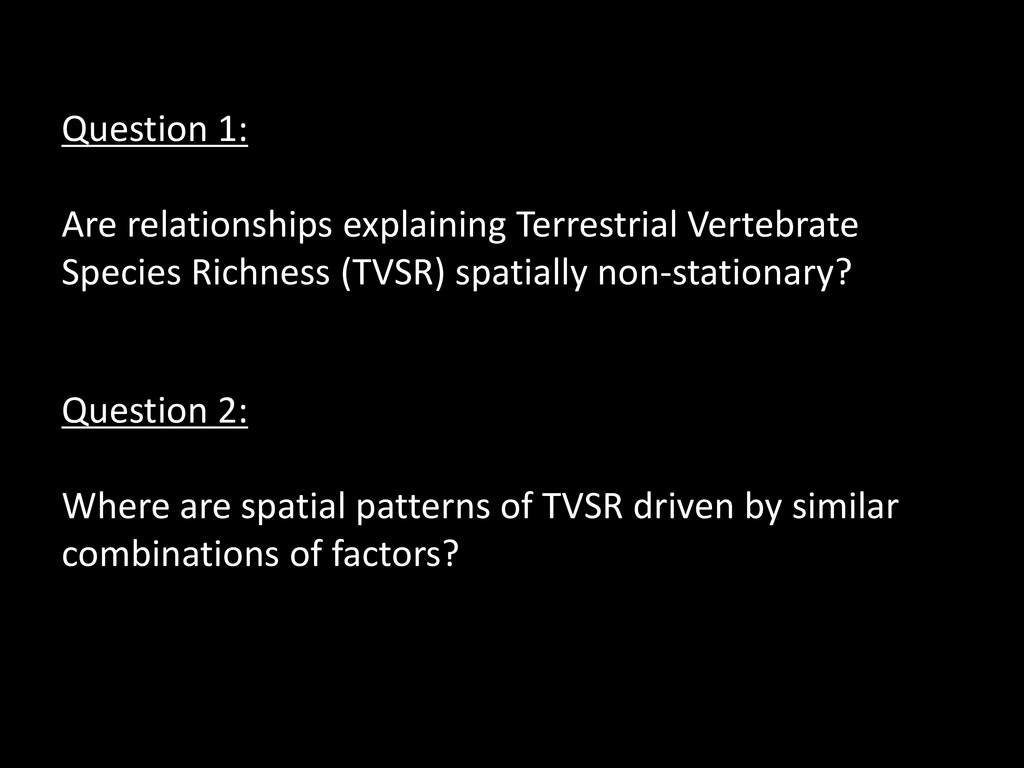
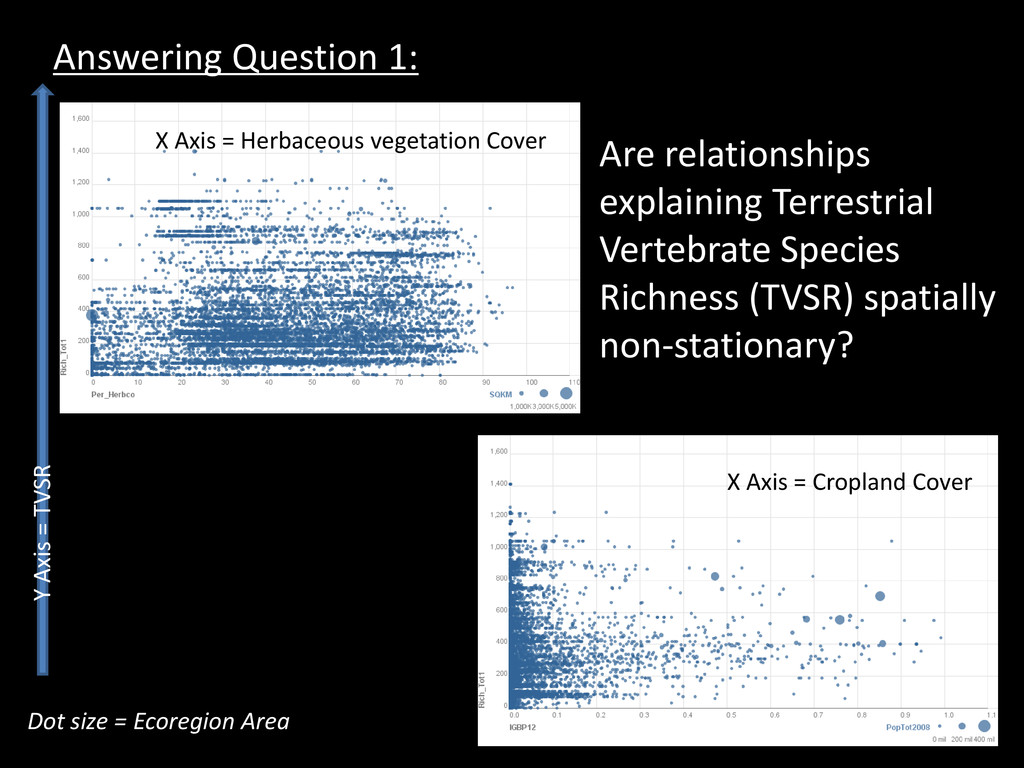
    Axis = Annual Temperature Range Dot size = Ecoregion Area X Axis = Herbaceous vegetation Cover X Axis = Cropland Cover Y Axis = TVSR Are relationships explaining Terrestrial Vertebrate Species Richness (TVSR) spatially non-stationary?
  11. Answering Question 1: AiC results show that Geographically-Weighted Regression provides

    better models than Global Regression for these comparisons.
  12. Answering Question 2: Where are spatial patterns of TVSR driven

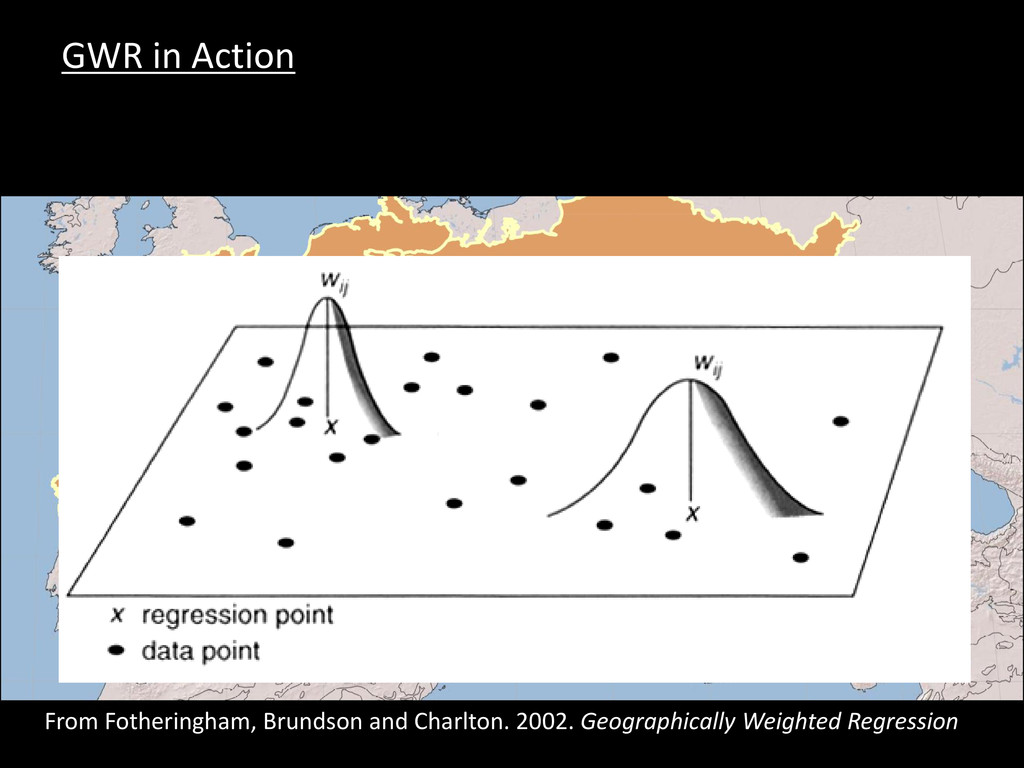
    by similar combinations of factors? Geographically-Weighted Regression (GWR) on the attributes and locations of the ecoregion polygons “GWR is a method of analyzing spatially-varying relationships. [It is] is a technique for exploratory spatial data analysis.” - From Fotheringham et al. http://ncg.nuim.ie/ncg/GWR/
  13. Methods: Unsupervised classification of ecoregions into Biodiversity Driver Zones (BDZs)

    – for each ecoregion polygon: Biophysical Variables Anthropogenic Variables TVSR GWR 2-Step Clustering Algorithm Output Parameters BDZ Membership
  14. •Significant Negative Explanatory Variables: •Mean Annual Temp (0.25) •Precipitation total

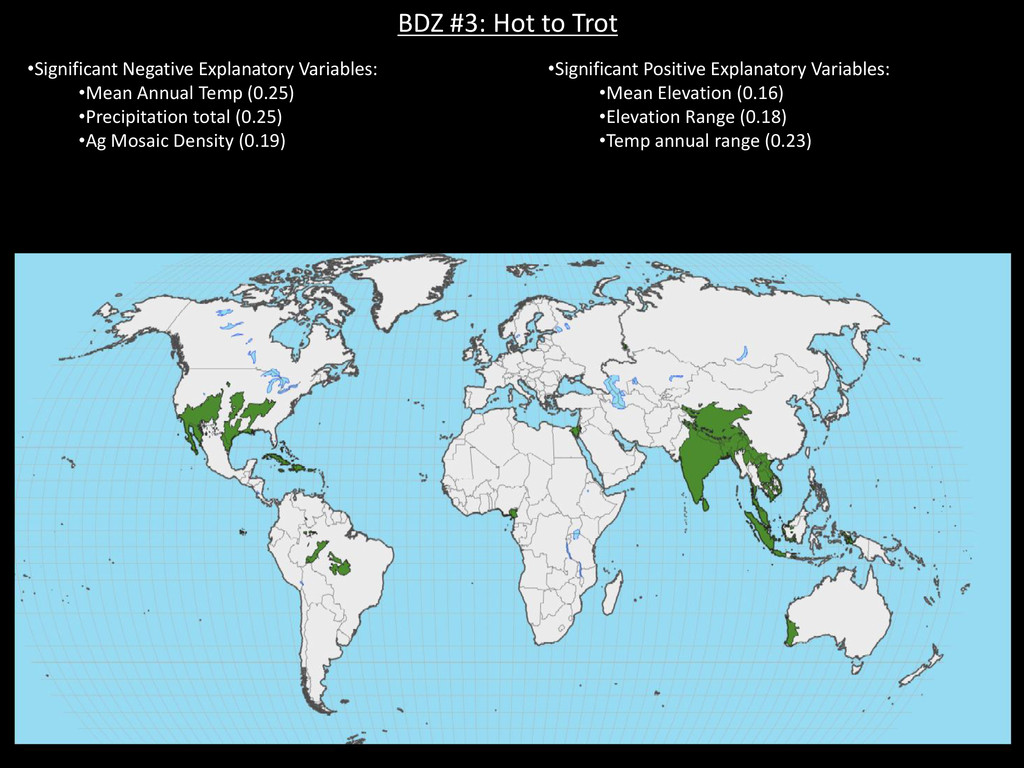
    (0.25) •Ag Mosaic Density (0.19) •Significant Positive Explanatory Variables: •Mean Elevation (0.16) •Elevation Range (0.18) •Temp annual range (0.23) BDZ #3: Hot to Trot
  15. •Significant Negative Explanatory Variables: •Ag density (0.26) •Urban Density (0.26)

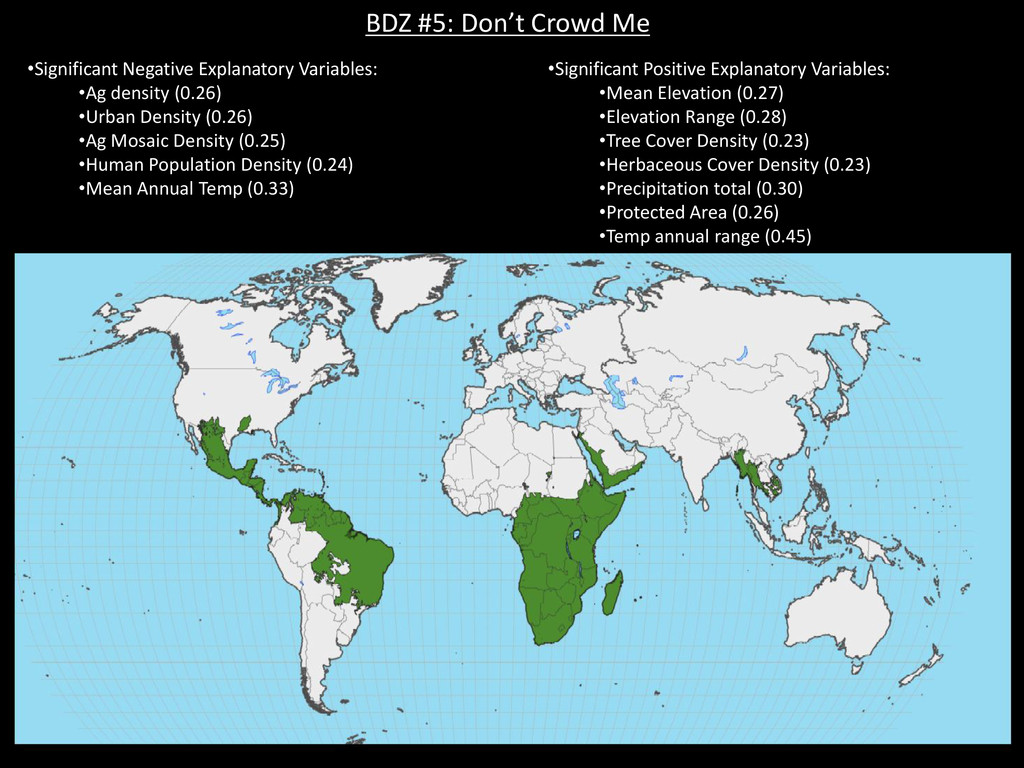
    •Ag Mosaic Density (0.25) •Human Population Density (0.24) •Mean Annual Temp (0.33) •Significant Positive Explanatory Variables: •Mean Elevation (0.27) •Elevation Range (0.28) •Tree Cover Density (0.23) •Herbaceous Cover Density (0.23) •Precipitation total (0.30) •Protected Area (0.26) •Temp annual range (0.45) BDZ #5: Don’t Crowd Me
  16. A Step Further: The variation in explanatory dynamics between identified

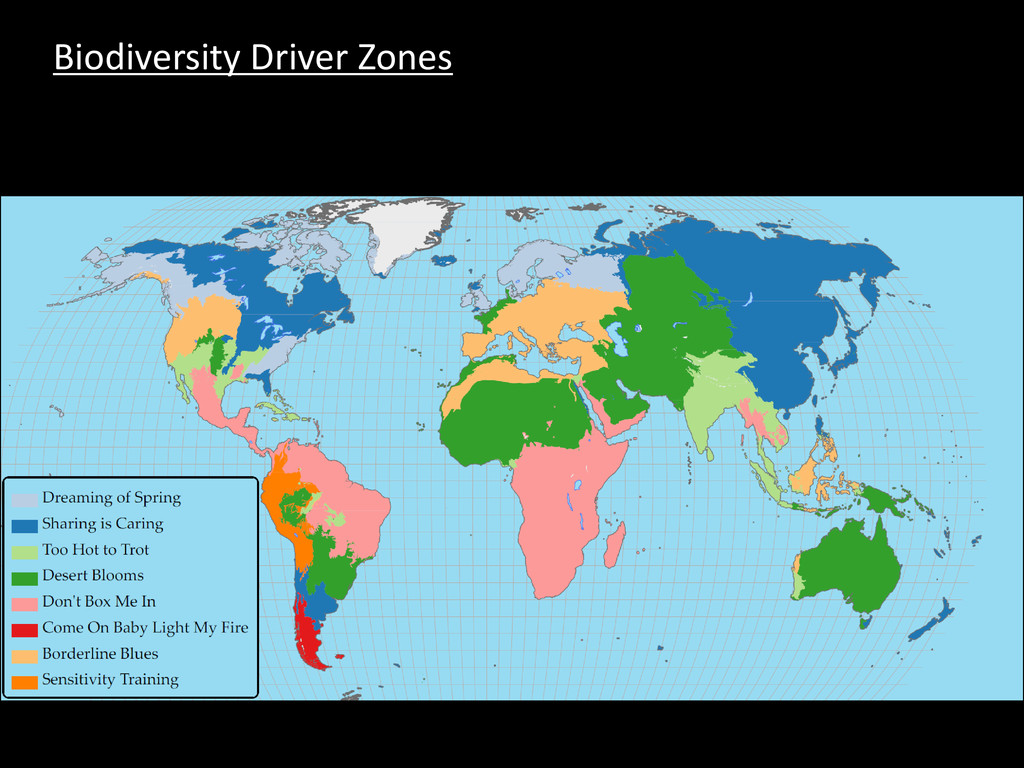
    Biodiversity Driver Zones suggests that divergent, decentralized strategies may be appropriate for conservation and management of the world’s biodiversity resources.