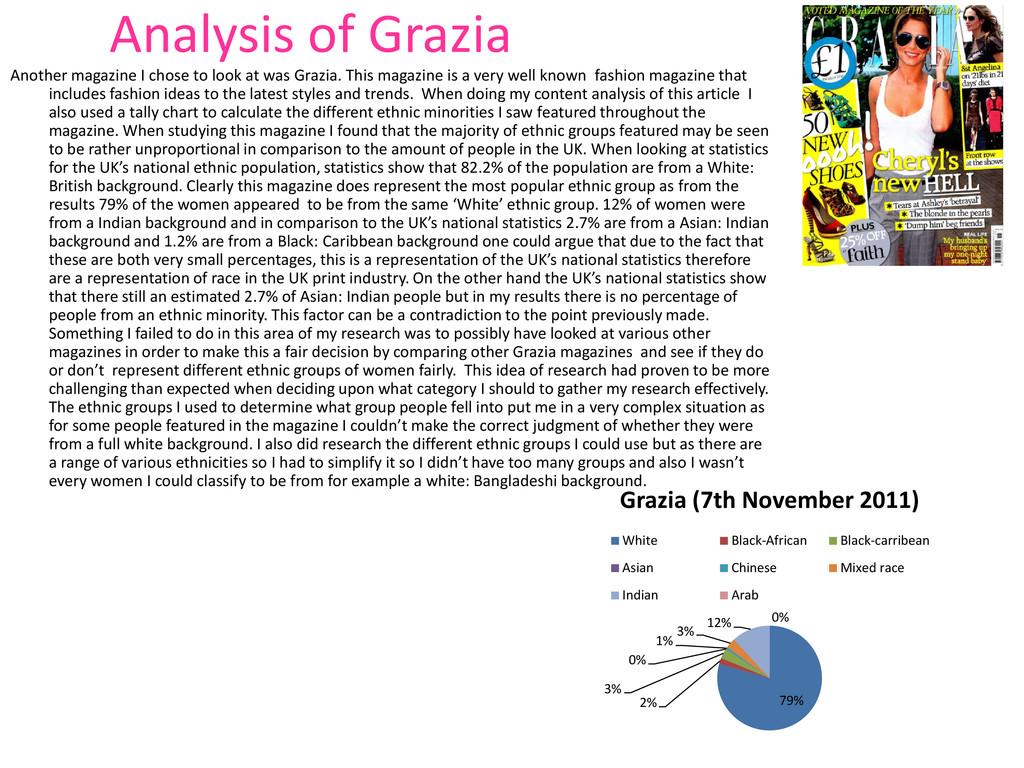
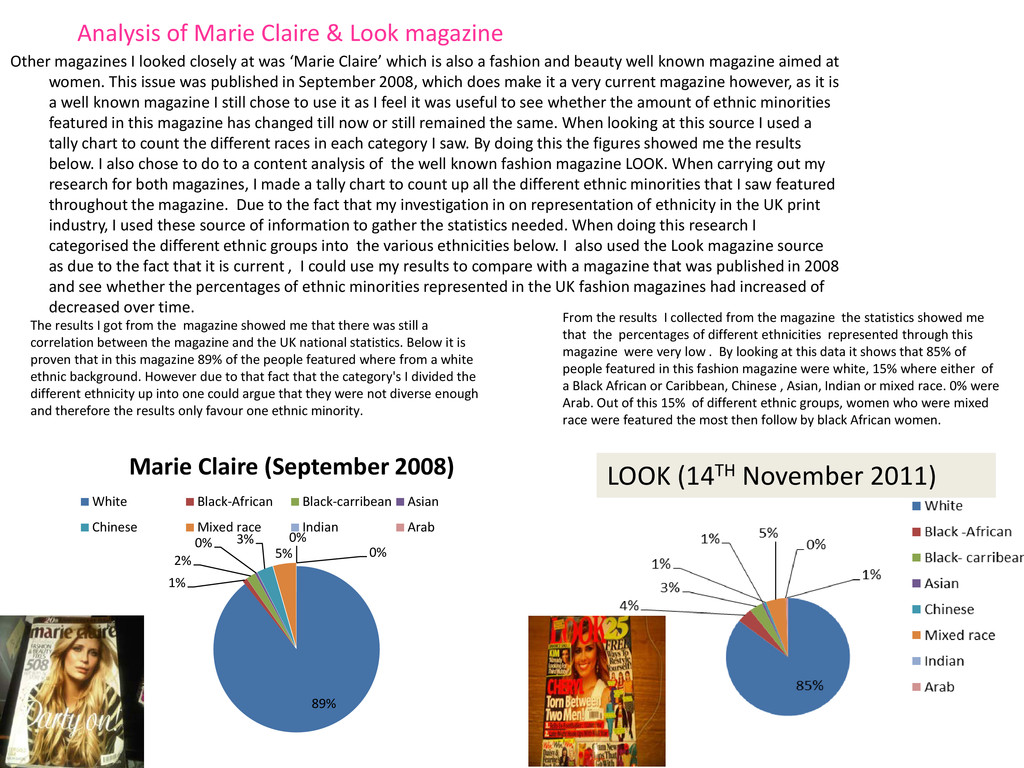
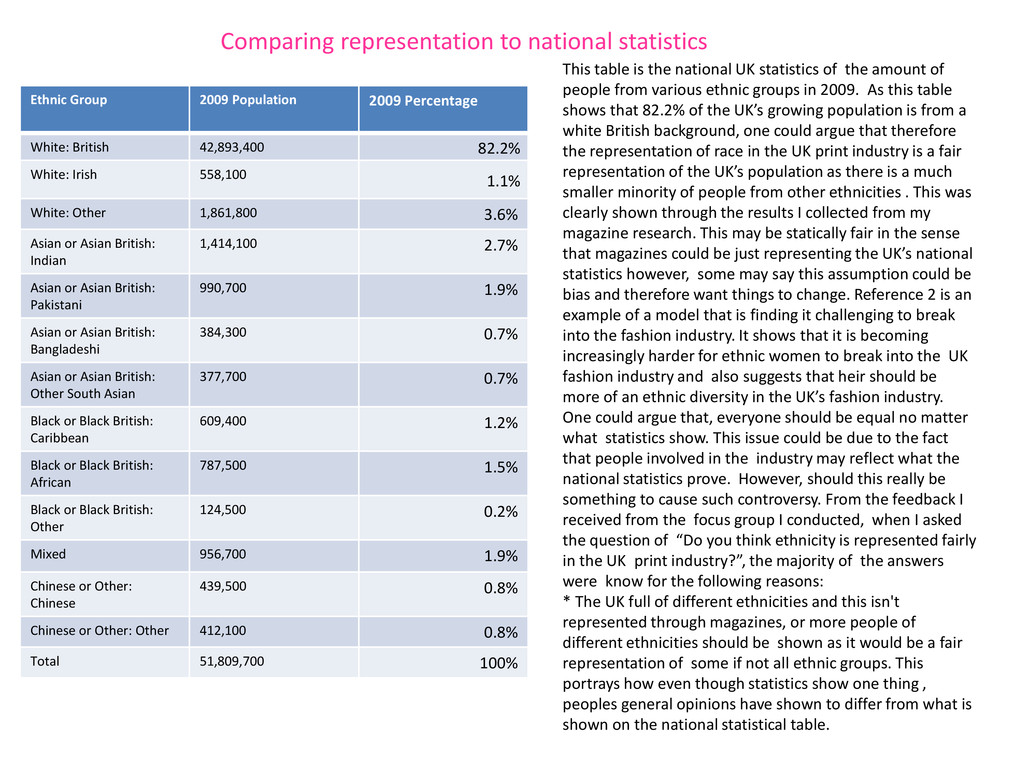
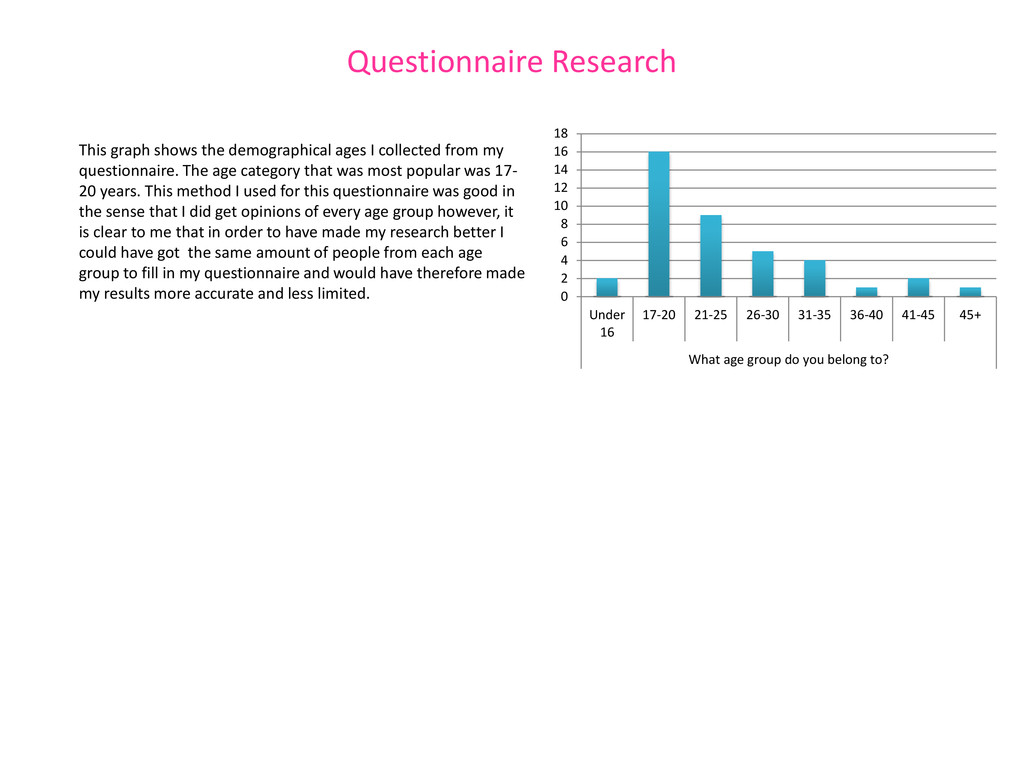
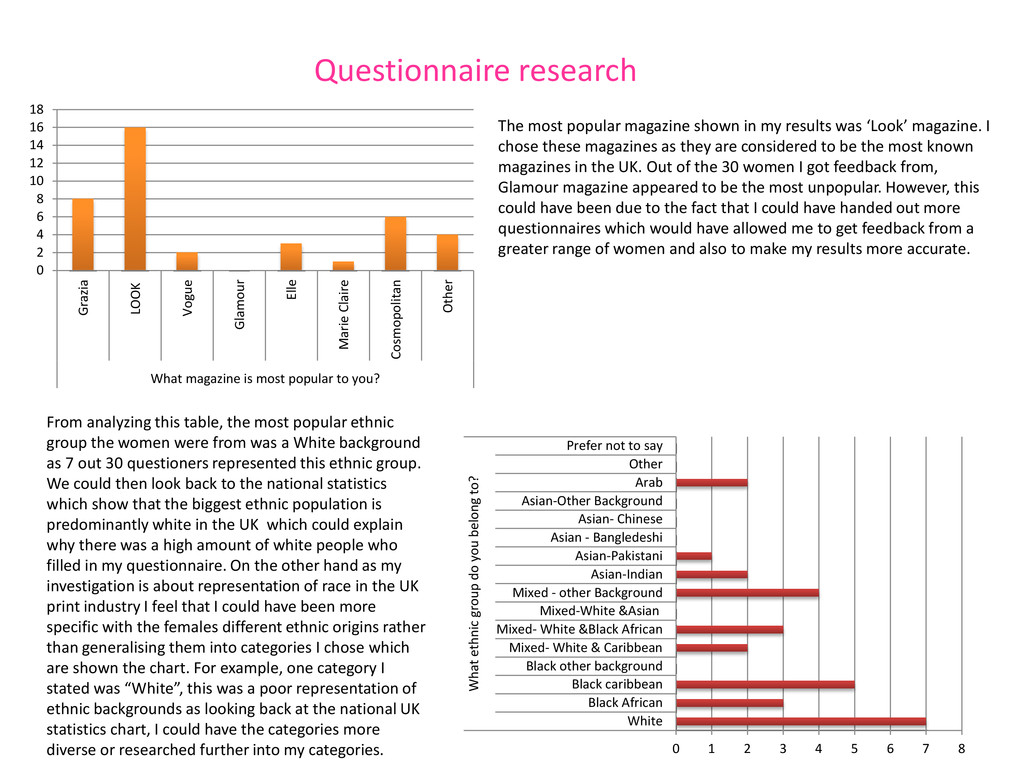
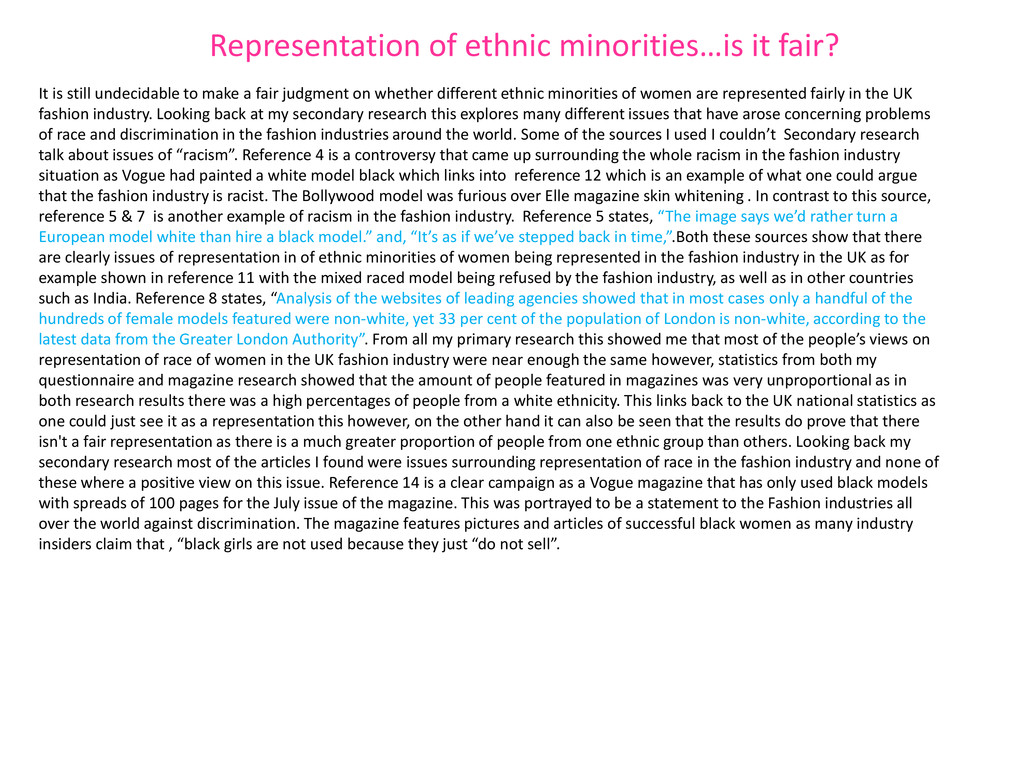
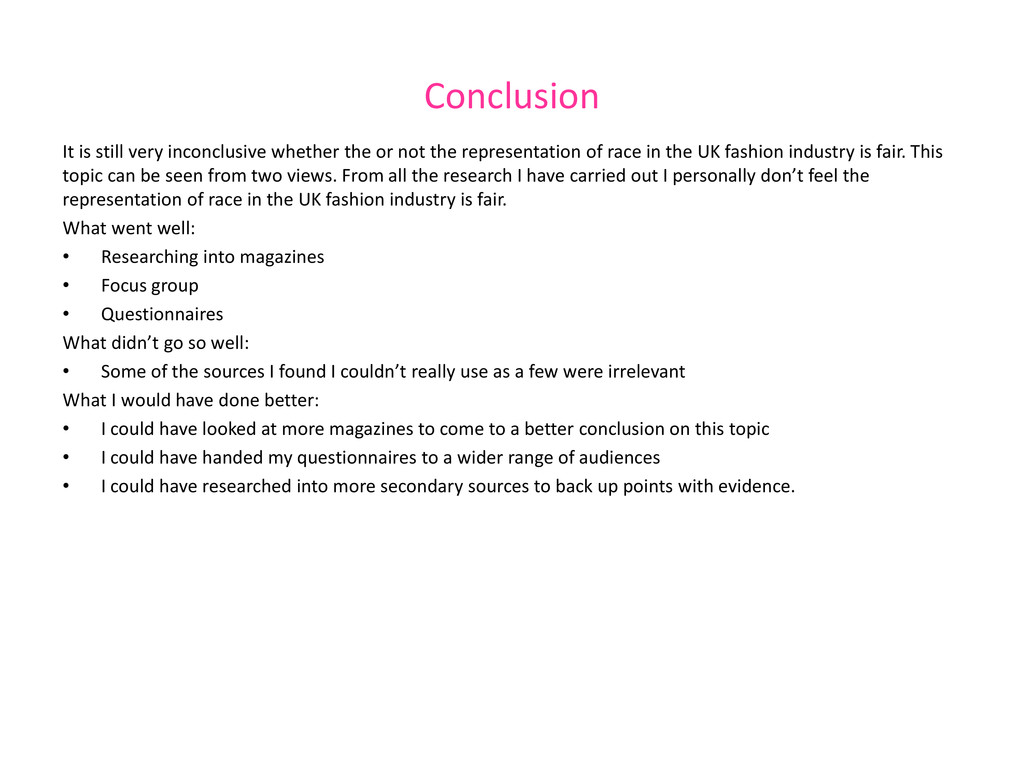
UK statistics of the amount of people from various ethnic groups in 2009. As this table shows that 82.2% of the UK’s growing population is from a white British background, one could argue that therefore the representation of race in the UK print industry is a fair representation of the UK’s population as there is a much smaller minority of people from other ethnicities . This was clearly shown through the results I collected from my magazine research. This may be statically fair in the sense that magazines could be just representing the UK’s national statistics however, some may say this assumption could be bias and therefore want things to change. Reference 2 is an example of a model that is finding it challenging to break into the fashion industry. It shows that it is becoming increasingly harder for ethnic women to break into the UK fashion industry and also suggests that heir should be more of an ethnic diversity in the UK’s fashion industry. One could argue that, everyone should be equal no matter what statistics show. This issue could be due to the fact that people involved in the industry may reflect what the national statistics prove. However, should this really be something to cause such controversy. From the feedback I received from the focus group I conducted, when I asked the question of “Do you think ethnicity is represented fairly in the UK print industry?”, the majority of the answers were know for the following reasons: * The UK full of different ethnicities and this isn't represented through magazines, or more people of different ethnicities should be shown as it would be a fair representation of some if not all ethnic groups. This portrays how even though statistics show one thing , peoples general opinions have shown to differ from what is shown on the national statistical table. Ethnic Group 2009 Population 2009 Percentage White: British 42,893,400 82.2% White: Irish 558,100 1.1% White: Other 1,861,800 3.6% Asian or Asian British: Indian 1,414,100 2.7% Asian or Asian British: Pakistani 990,700 1.9% Asian or Asian British: Bangladeshi 384,300 0.7% Asian or Asian British: Other South Asian 377,700 0.7% Black or Black British: Caribbean 609,400 1.2% Black or Black British: African 787,500 1.5% Black or Black British: Other 124,500 0.2% Mixed 956,700 1.9% Chinese or Other: Chinese 439,500 0.8% Chinese or Other: Other 412,100 0.8% Total 51,809,700 100%


 yasy
 palkan
 pauljervisheath
 mclloyd
 tammyeverts
 inesmontani
 thirion
 chriscoyier
 badams
 baasie
 aleyda