Upgrade to Pro — share decks privately, control downloads, hide ads and more …

Anomaly Detection by Mean and Standard Deviation

Anomaly Detection by Mean and Standard Deviation

Yoshihiro Iwanaga

September 26, 2013
Tweet

More Decks by Yoshihiro Iwanaga

Other Decks in Technology

Transcript

  1. Motivation for detecting anomaly Traditional system monitoring •  process existence

    •  ping, http, tcp response •  disk usage → “fixed” rule / threshold
  2. Motivation for detecting anomaly Notice something out of ordinary • 

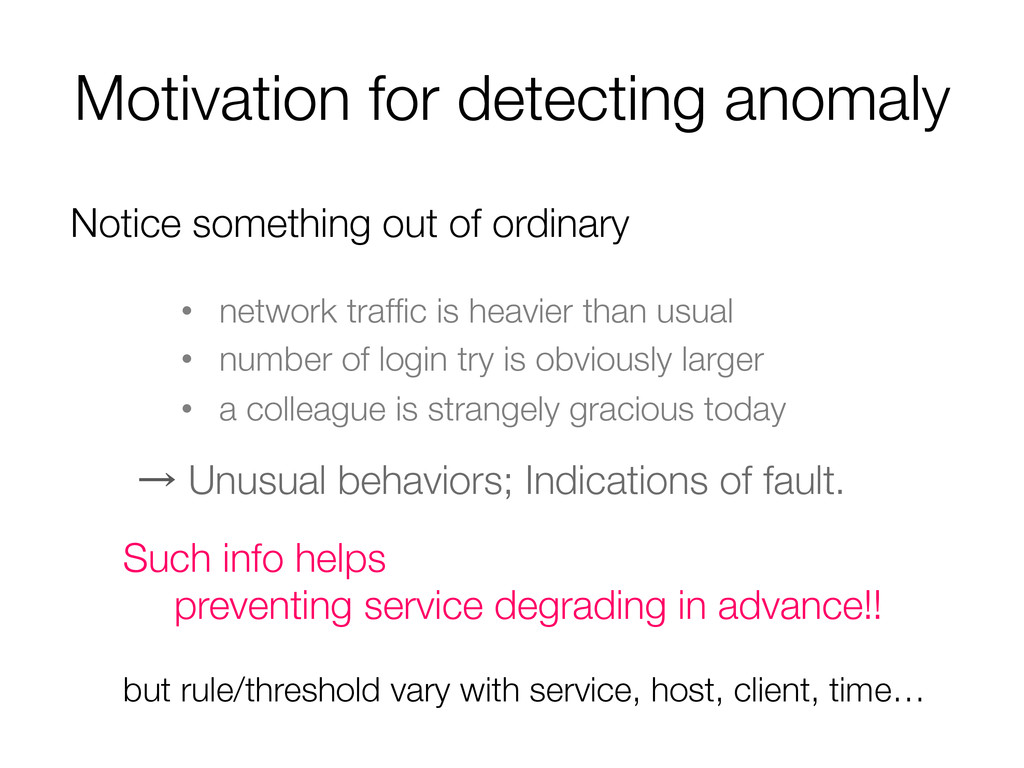
    network traffic is heavier than usual •  number of login try is obviously larger •  a colleague is strangely gracious today → Unusual behaviors; Indications of fault. Such info helps preventing service degrading in advance!! but rule/threshold vary with service, host, client, time…
  3. Superimpose 24 hour plot Traffic at 15:00 on workday is

    about 1.2 Gbps traffic time Periodicity!!
  4. mean mean - 3σ mean + 3σ amount of dispersion

    from mean = 1 N v u u t N X i=1 (¯ x xi)2 Acceptable “range” → e.g. Acceptable range of traffic at 15:00 on workday is 1.01 to 1.38 Gbps
  5. downloading large files mass e-mail sending “Traffic spike” happens so

    frequently Frequent false-positive alerting will be “cry-wolf” system…
  6. heuristic filtering In usual, traffic gets cool down within 15

    minutes notify engineers if anomaly continues more than 15 minutes Engineers’ knowledge is gold mine for better algorithm J → one practical example: