Velocity is an important metric to a lot of software teams, but in my experience, it’s often been the most important metric to management — often at the expense of missing out on the rest of the story. In this talk, we'll explore Earned Business Value, Lead Time, and Cumulative Flow to examine how these metrics might deliver additional insight into teams' development lifecycles.
The content of this talk is available as an article here.
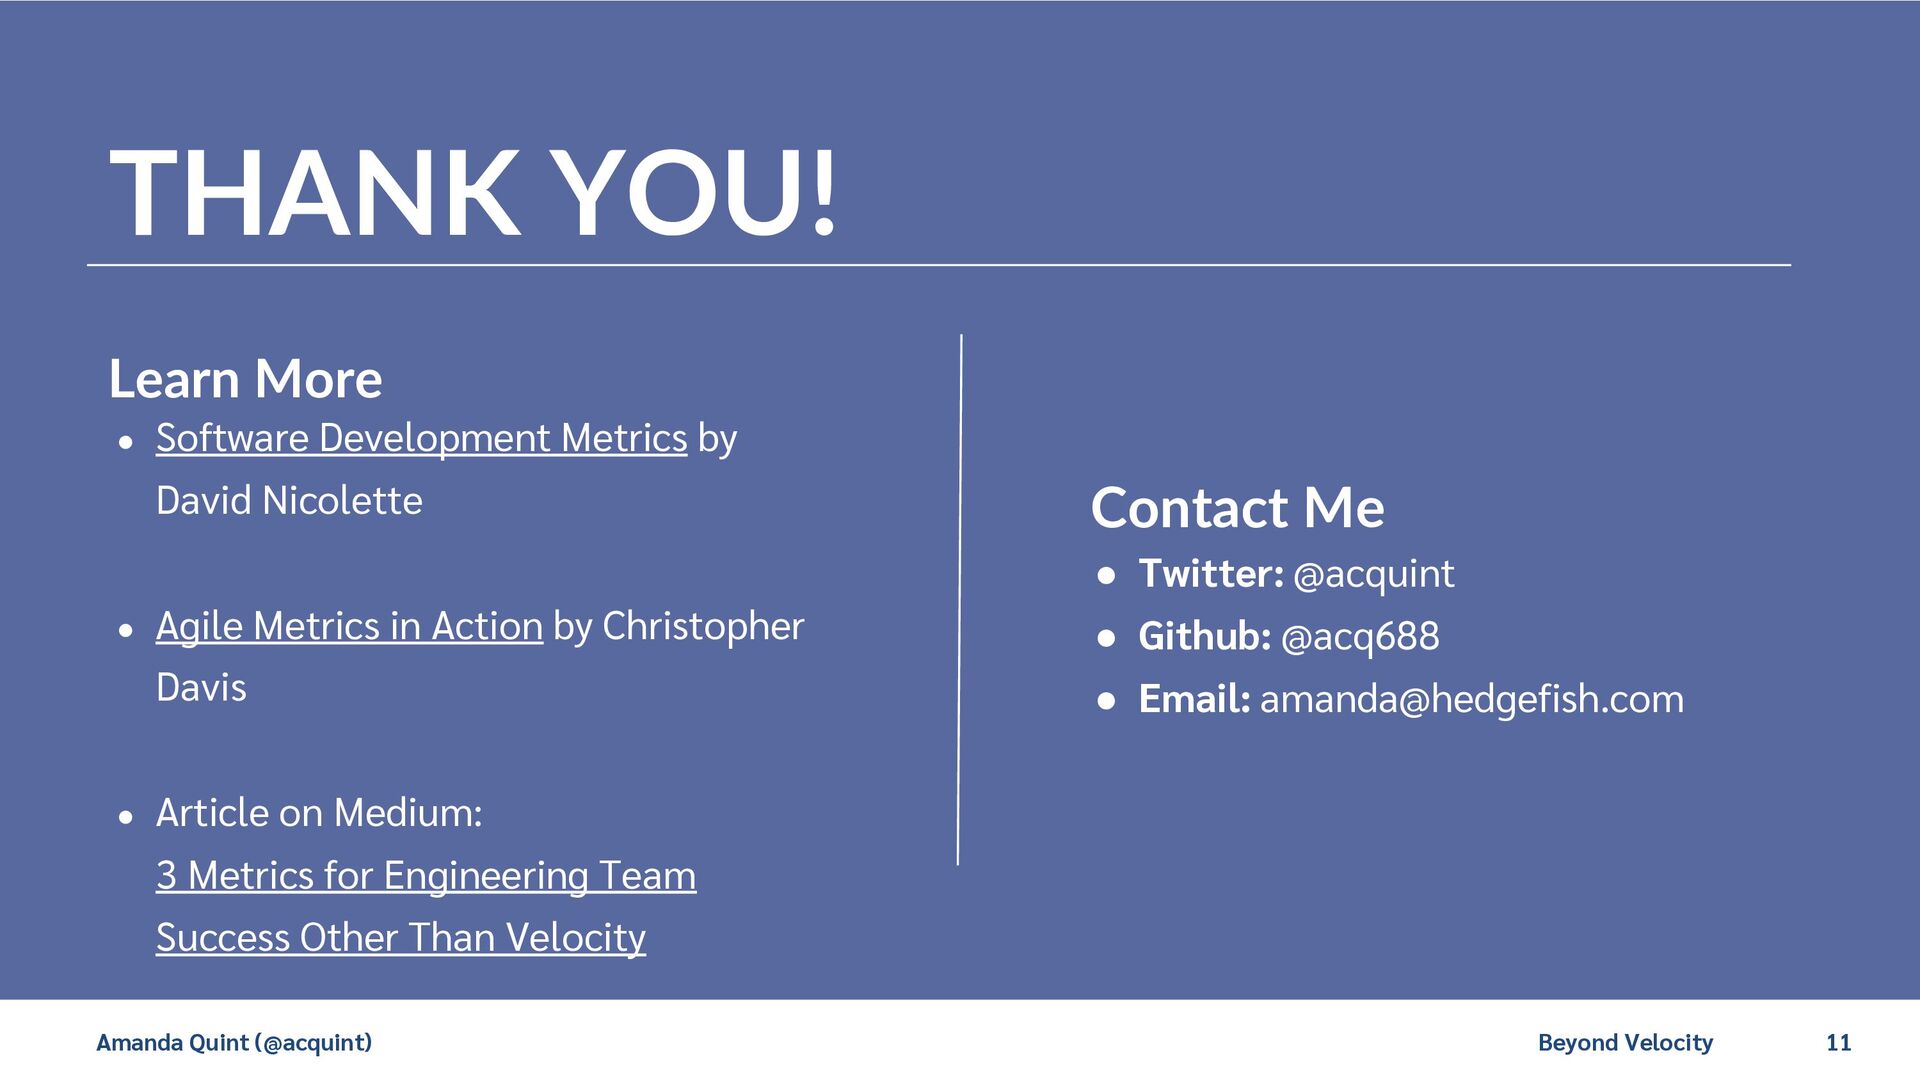
If you'd like to learn more about software metrics, I recommend these two books:
* Software Development Metrics by David Nicolette
* Agile Metrics in Action by Christopher Davis
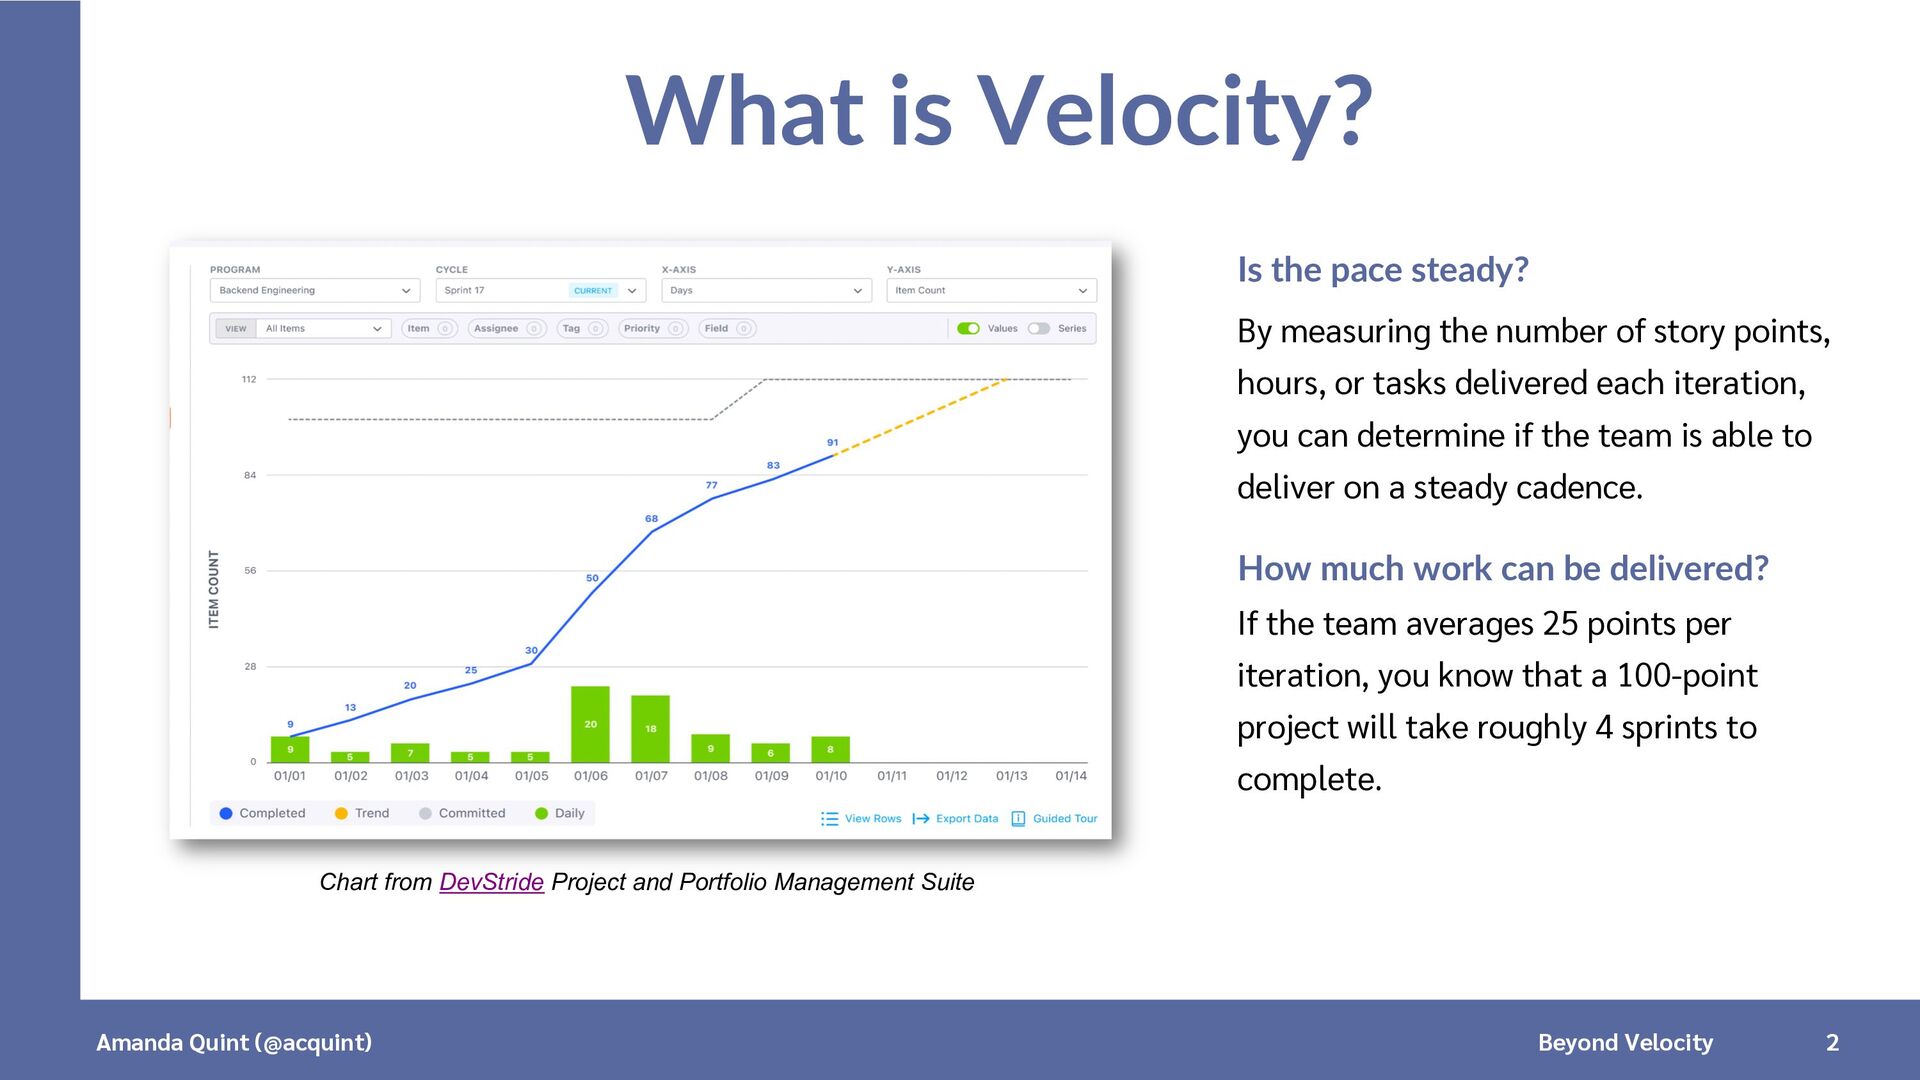
Charts built in:
* DevStride
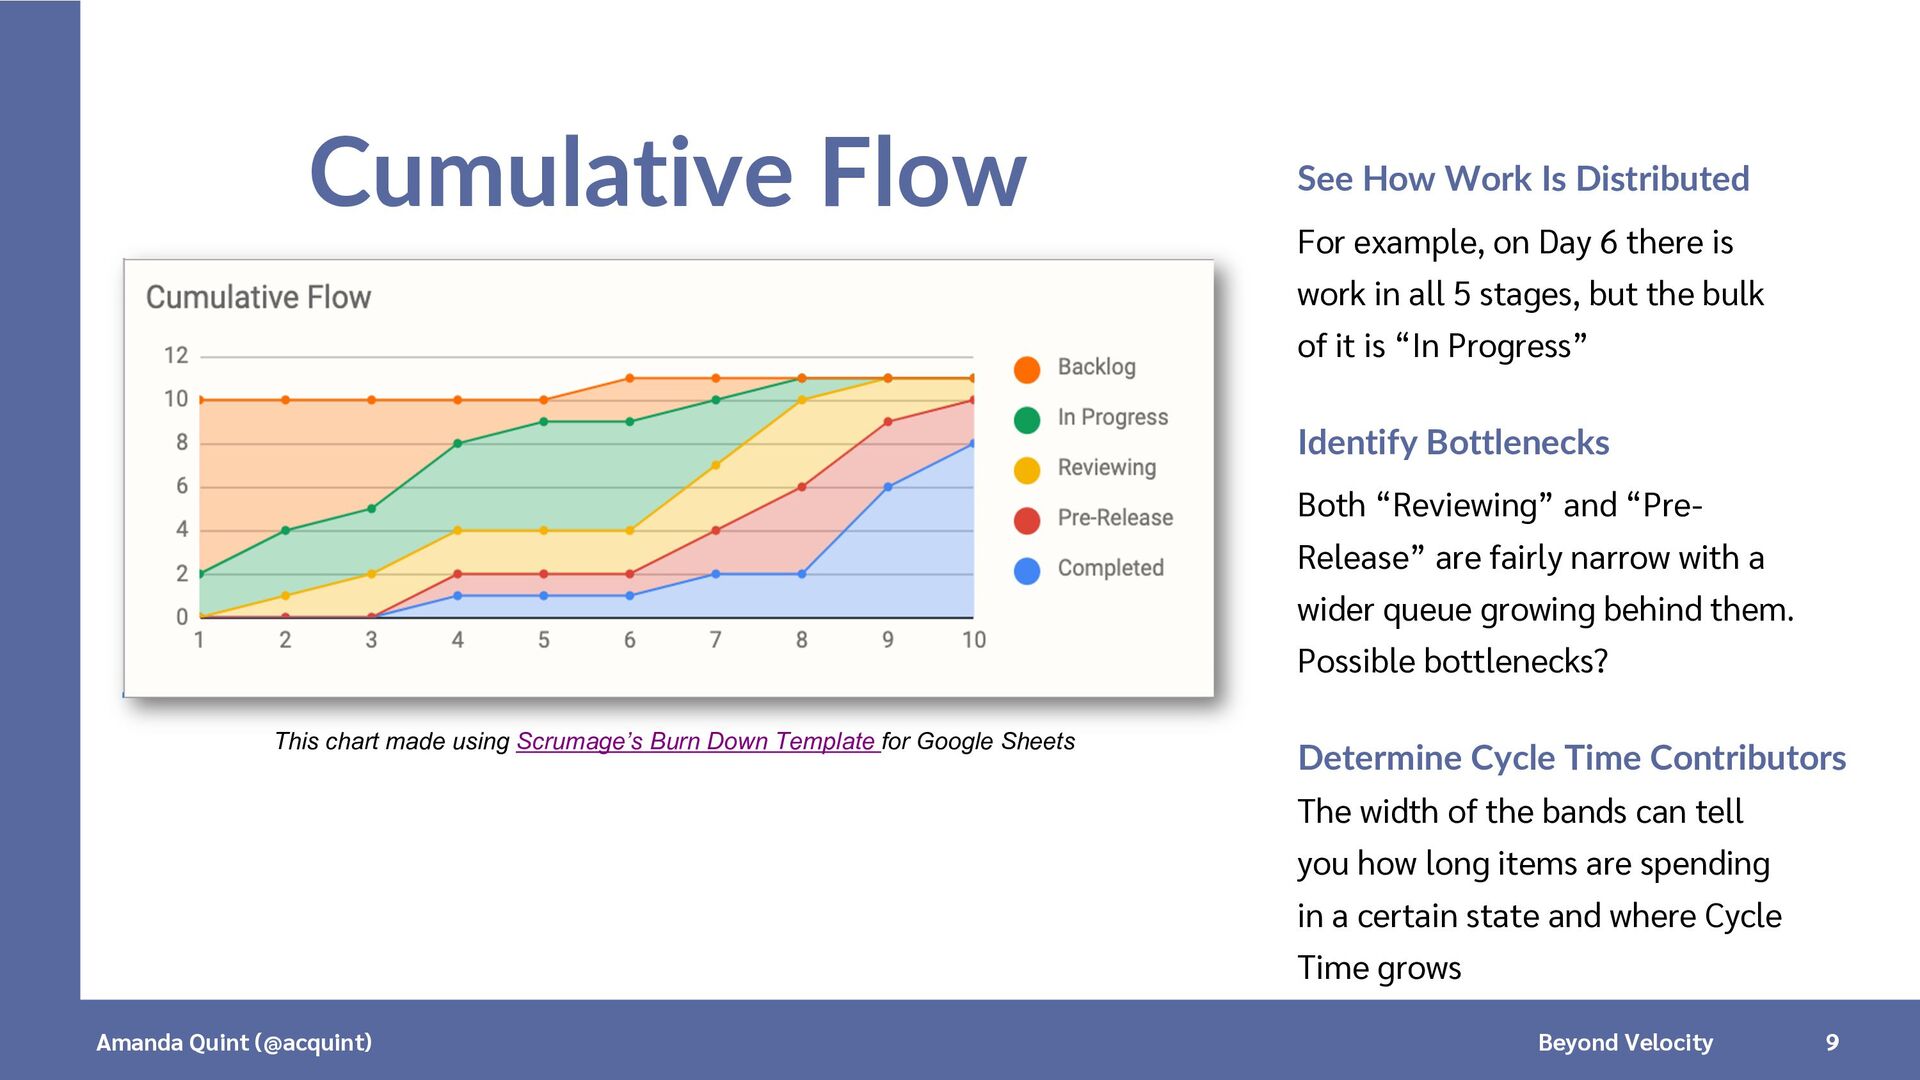
* Scrumage’s Burn Down Template