Upgrade to Pro
— share decks privately, control downloads, hide ads and more …
Speaker Deck
Features
Speaker Deck
PRO
Sign in
Sign up for free
Search
Search
DevOps Taiwan - Monitoring Tools 大亂鬥 - Prometheus
Search
adaam
May 26, 2018
Technology
0
270
DevOps Taiwan - Monitoring Tools 大亂鬥 - Prometheus
adaam
May 26, 2018
Tweet
Share
More Decks by adaam
See All by adaam
Terraform Introduction
adaam
0
53
三分鐘用 PMM 架好監控系統
adaam
0
84
Kubernetes HA with CoreOS
adaam
0
130
Other Decks in Technology
See All in Technology
[CV勉強会@関東 World Model 読み会] Orbis: Overcoming Challenges of Long-Horizon Prediction in Driving World Models (Mousakhan+, NeurIPS 2025)
abemii
0
150
1,000 にも届く AWS Organizations 組織のポリシー運用をちゃんとしたい、という話
kazzpapa3
0
170
ECS障害を例に学ぶ、インシデント対応に備えた AIエージェントの育て方 / How to develop AI agents for incident response with ECS outage
iselegant
4
350
AWS DevOps Agent x ECS on Fargate検証 / AWS DevOps Agent x ECS on Fargate
kinunori
2
150
SREが向き合う大規模リアーキテクチャ 〜信頼性とアジリティの両立〜
zepprix
0
480
Frontier Agents (Kiro autonomous agent / AWS Security Agent / AWS DevOps Agent) の紹介
msysh
3
190
Cloud Runでコロプラが挑む 生成AI×ゲーム『神魔狩りのツクヨミ』の裏側
colopl
0
140
Cosmos World Foundation Model Platform for Physical AI
takmin
0
970
Codex 5.3 と Opus 4.6 にコーポレートサイトを作らせてみた / Codex 5.3 vs Opus 4.6
ama_ch
0
210
Claude Code for NOT Programming
kawaguti
PRO
1
100
日本の85%が使う公共SaaSは、どう育ったのか
taketakekaho
1
240
ファインディの横断SREがTakumi byGMOと取り組む、セキュリティと開発スピードの両立
rvirus0817
1
1.6k
Featured
See All Featured
New Earth Scene 8
popppiees
1
1.5k
Between Models and Reality
mayunak
1
190
A Modern Web Designer's Workflow
chriscoyier
698
190k
Large-scale JavaScript Application Architecture
addyosmani
515
110k
Git: the NoSQL Database
bkeepers
PRO
432
66k
We Analyzed 250 Million AI Search Results: Here's What I Found
joshbly
1
750
Bootstrapping a Software Product
garrettdimon
PRO
307
120k
Building Adaptive Systems
keathley
44
2.9k
Easily Structure & Communicate Ideas using Wireframe
afnizarnur
194
17k
Tell your own story through comics
letsgokoyo
1
810
Money Talks: Using Revenue to Get Sh*t Done
nikkihalliwell
0
160
The Invisible Side of Design
smashingmag
302
51k
Transcript
Monitor Tools 大亂鬥 Prometheus 篇 Adam Chen
Agenda ▪ Prometheus ▪ Percona Monitoring and Management ▪ Demo
2
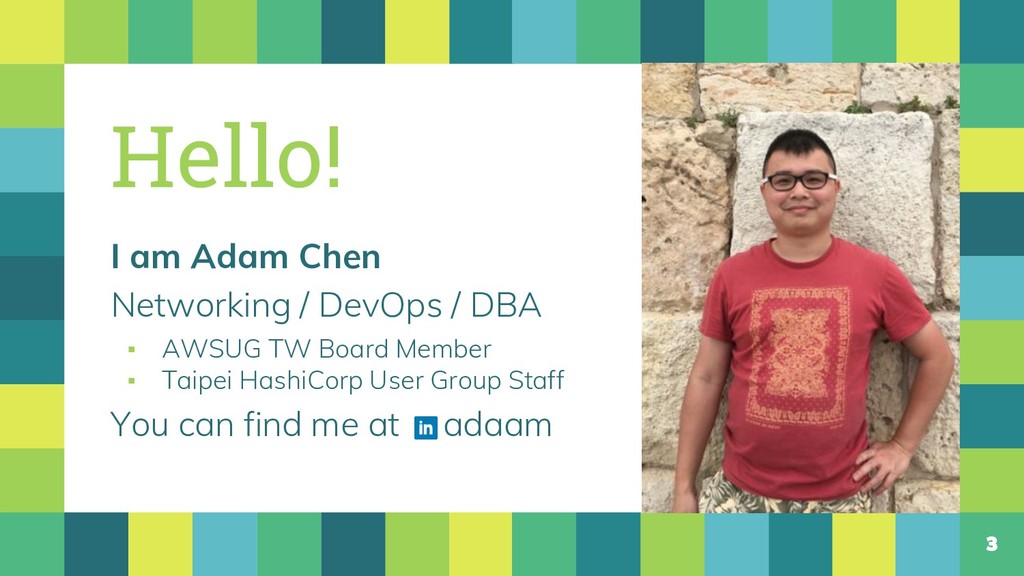
Hello! I am Adam Chen Networking / DevOps / DBA
▪ AWSUG TW Board Member ▪ Taipei HashiCorp User Group Staff You can find me at adaam 3
About Prometheus 普羅米修斯
5
6 豆知識: Prometheus 其實是源自希臘文,在希臘神話中,是提坦神族的神明之一, 名字的意思是「先見之明」 (forethought)
What is Prometheus? ▪ Monitor System ▪ Timeseries Database ▪
Pull based ▪ Alert System (with AlertManager) ▪ Metrics Collection & Storage ▪ Dashboarding / Graphing / Trending ▪ Focus on OS monitoring 7
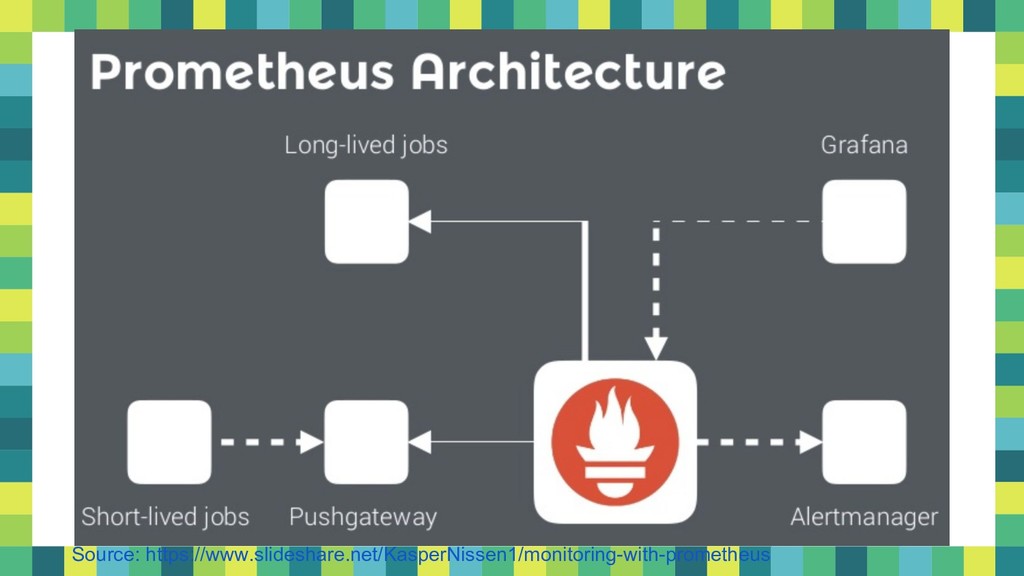
8 Source: https://www.slideshare.net/KasperNissen1/monitoring-with-prometheus
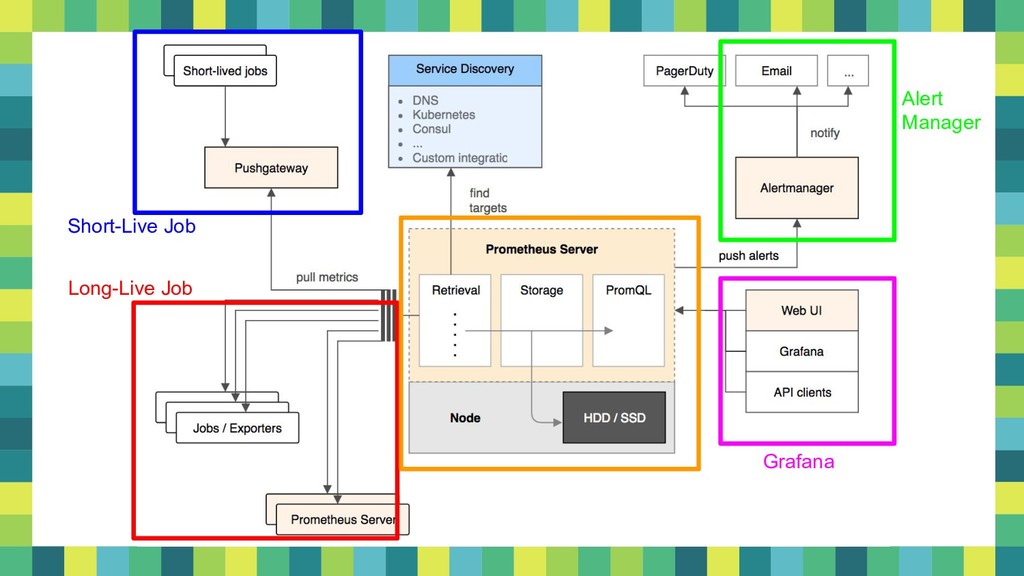
9 Short-Live Job Long-Live Job Grafana Alert Manager
10
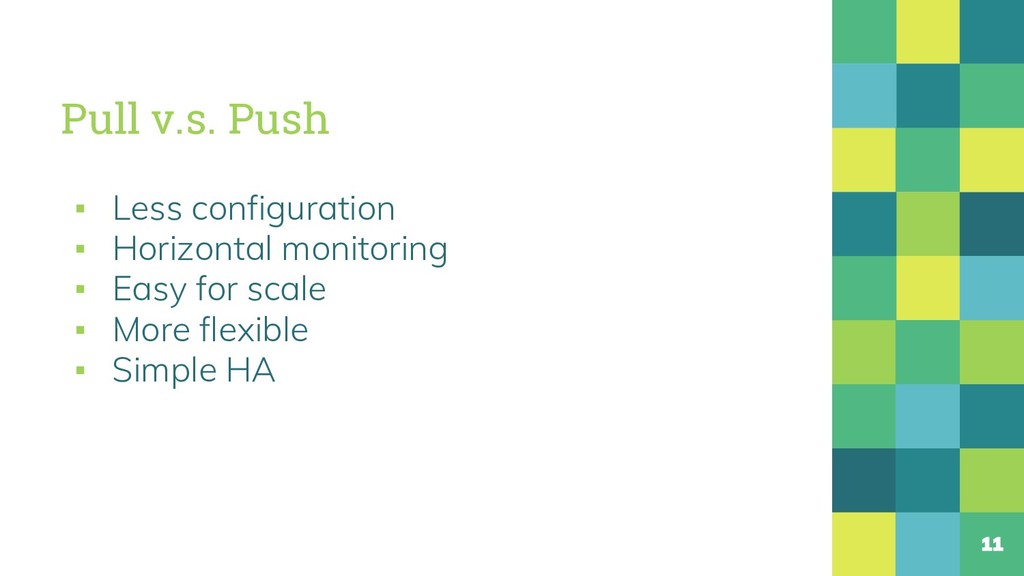
Pull v.s. Push ▪ Less configuration ▪ Horizontal monitoring ▪
Easy for scale ▪ More flexible ▪ Simple HA 11
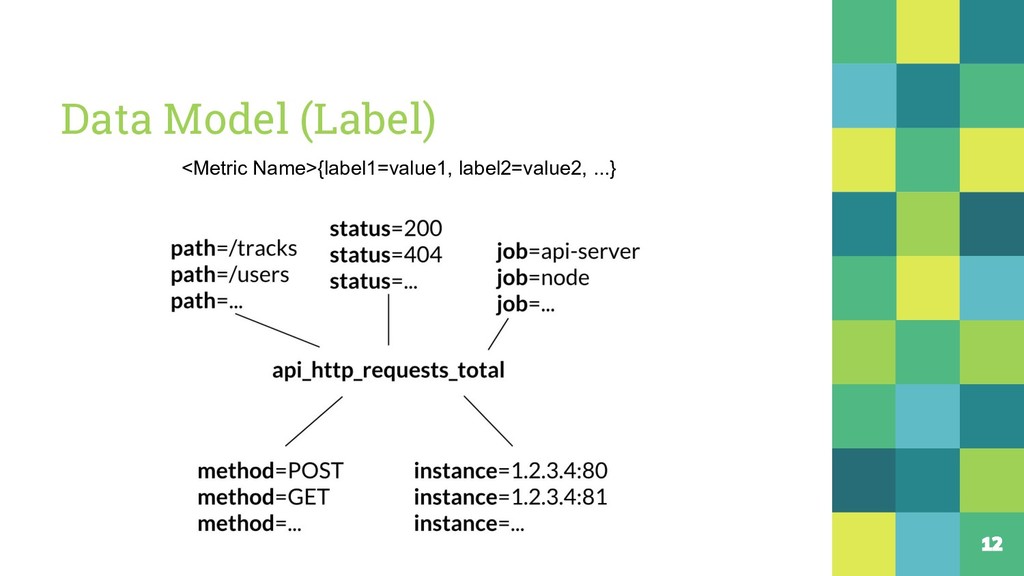
Data Model (Label) 12 <Metric Name>{label1=value1, label2=value2, ...}
Prometheus NOT do ▪ Raw log / Event collection ▪
Durable long-term storage (can use remote storage) ▪ Automatic horizontal scaling 13
Percona Monitoring and Management
What is PMM ▪ Open-source platform for managing and monitoring
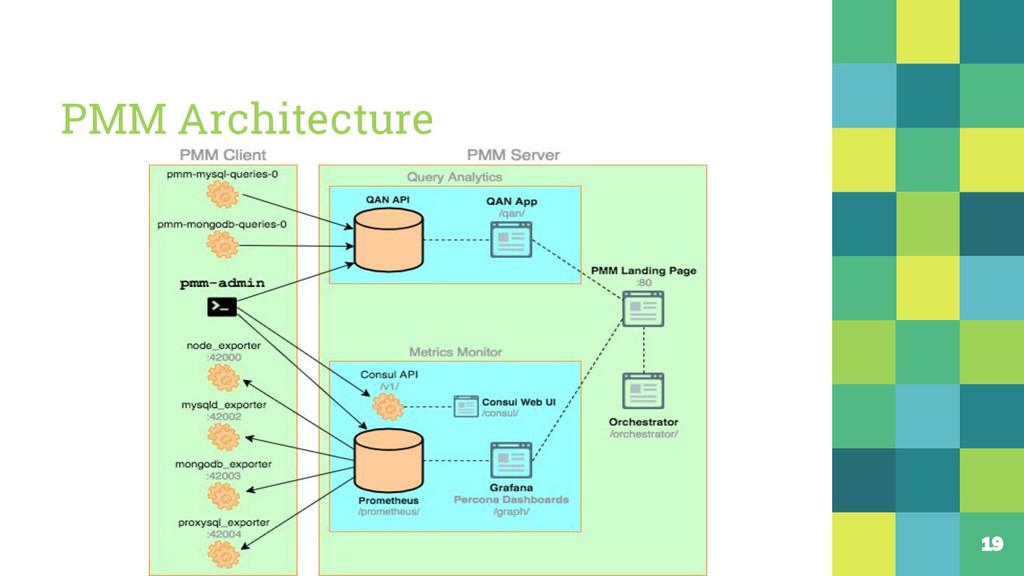
MySQL and MongoDB performance. ▪ Based on Prometheus, Consul, Grafana, Application exporters 15
Why PMM ? 16 ▪ Easy to configure (Compare to
Prometheus Config) ▪ 3 Step: Install, config, use ▪ Pre-installed Grafana Template
17
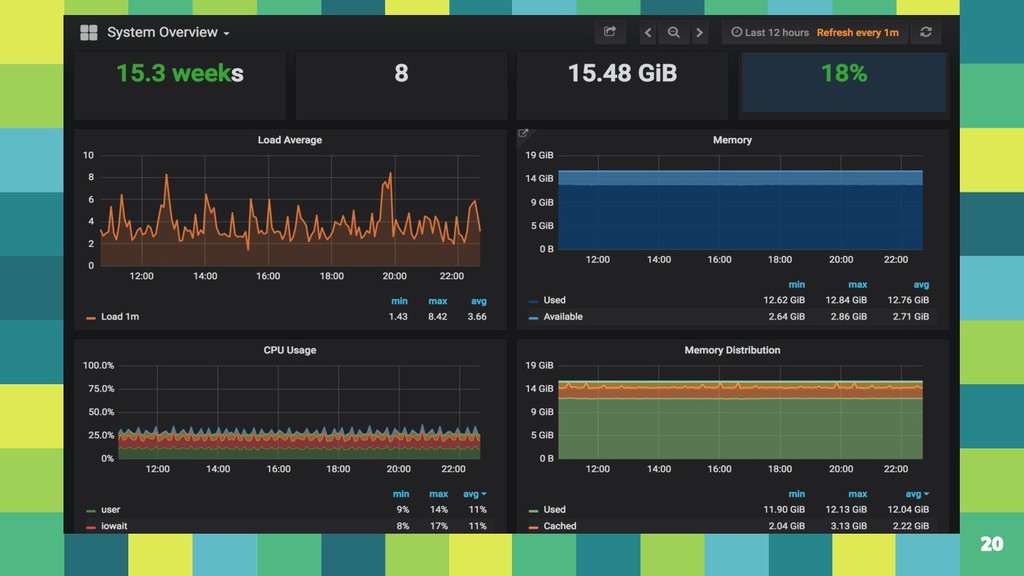
Demo Use Percona Monitoring and Management (PMM)
PMM Architecture 19
20
21 Thanks! Any questions? You can find me at ▪
adaam ▪ Adam dot cws@gmail dot com