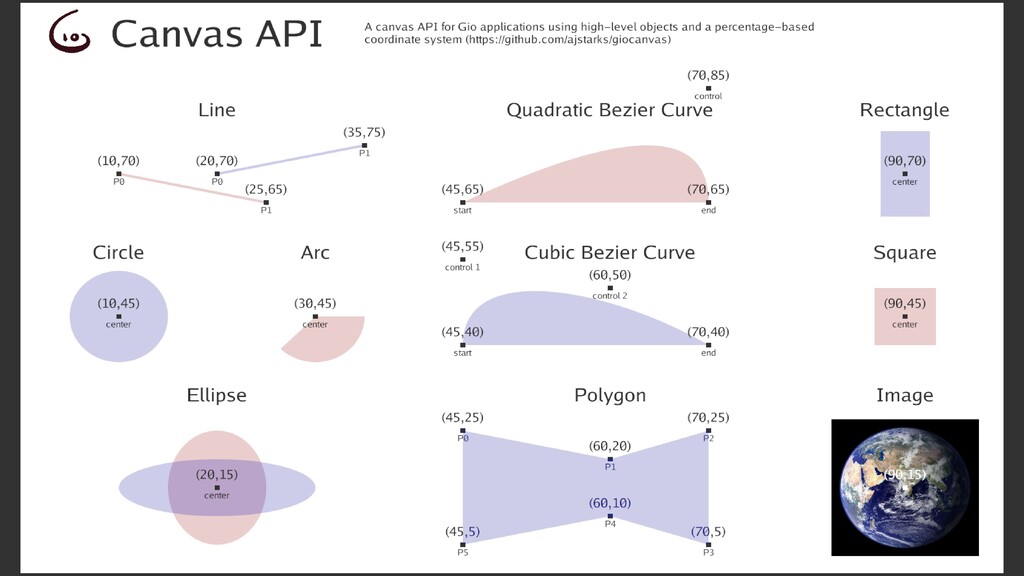
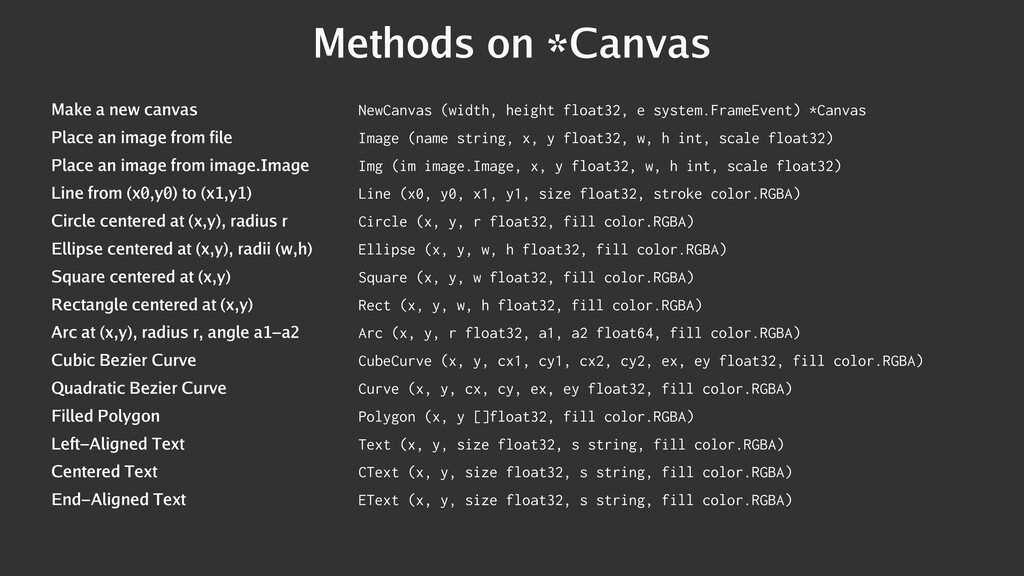
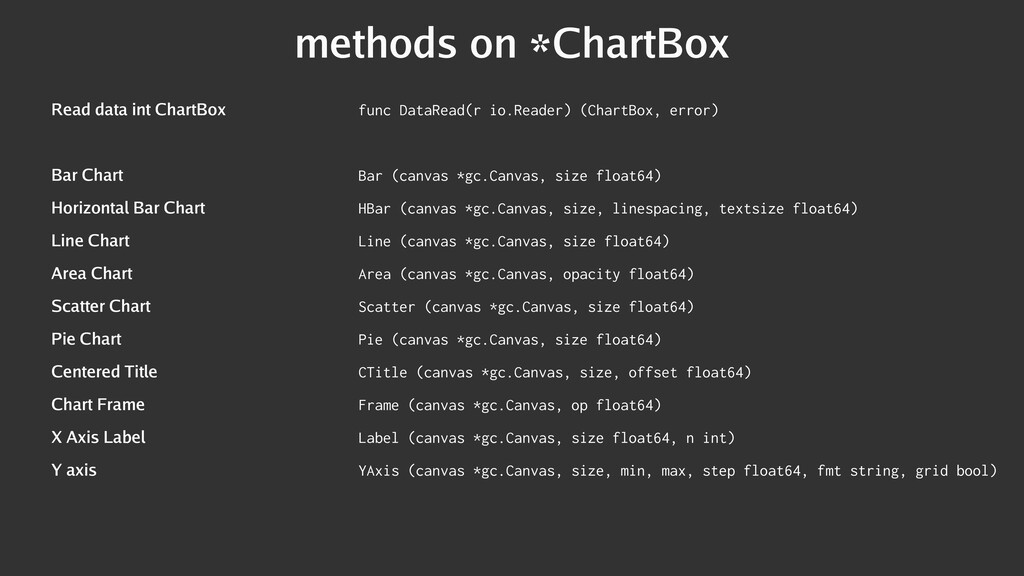
from file Place an image from image.Image Line from (x0,y0) to (x1,y1) Circle centered at (x,y), radius r Ellipse centered at (x,y), radii (w,h) Square centered at (x,y) Rectangle centered at (x,y) Arc at (x,y), radius r, angle a1-a2 Cubic Bezier Curve Quadratic Bezier Curve Filled Polygon Left-Aligned Text Centered Text End-Aligned Text NewCanvas (width, height float32, e system.FrameEvent) *Canvas Image (name string, x, y float32, w, h int, scale float32) Img (im image.Image, x, y float32, w, h int, scale float32) Line (x0, y0, x1, y1, size float32, stroke color.RGBA) Circle (x, y, r float32, fill color.RGBA) Ellipse (x, y, w, h float32, fill color.RGBA) Square (x, y, w float32, fill color.RGBA) Rect (x, y, w, h float32, fill color.RGBA) Arc (x, y, r float32, a1, a2 float64, fill color.RGBA) CubeCurve (x, y, cx1, cy1, cx2, cy2, ex, ey float32, fill color.RGBA) Curve (x, y, cx, cy, ex, ey float32, fill color.RGBA) Polygon (x, y []float32, fill color.RGBA) Text (x, y, size float32, s string, fill color.RGBA) CText (x, y, size float32, s string, fill color.RGBA) EText (x, y, size float32, s string, fill color.RGBA)