user expectations. When a page feels slow, we often jump to conclusions: <Is it the browser? The network? The JS? CPU ?î This talk is about moving beyond guesswork. We'll explore how to read and understand two powerful tools built right into your browser: Flame Charts 4 to uncover what¾s clogging the main thread Waterfall Charts 4 to trace how every asset loads, stalls, or blocks
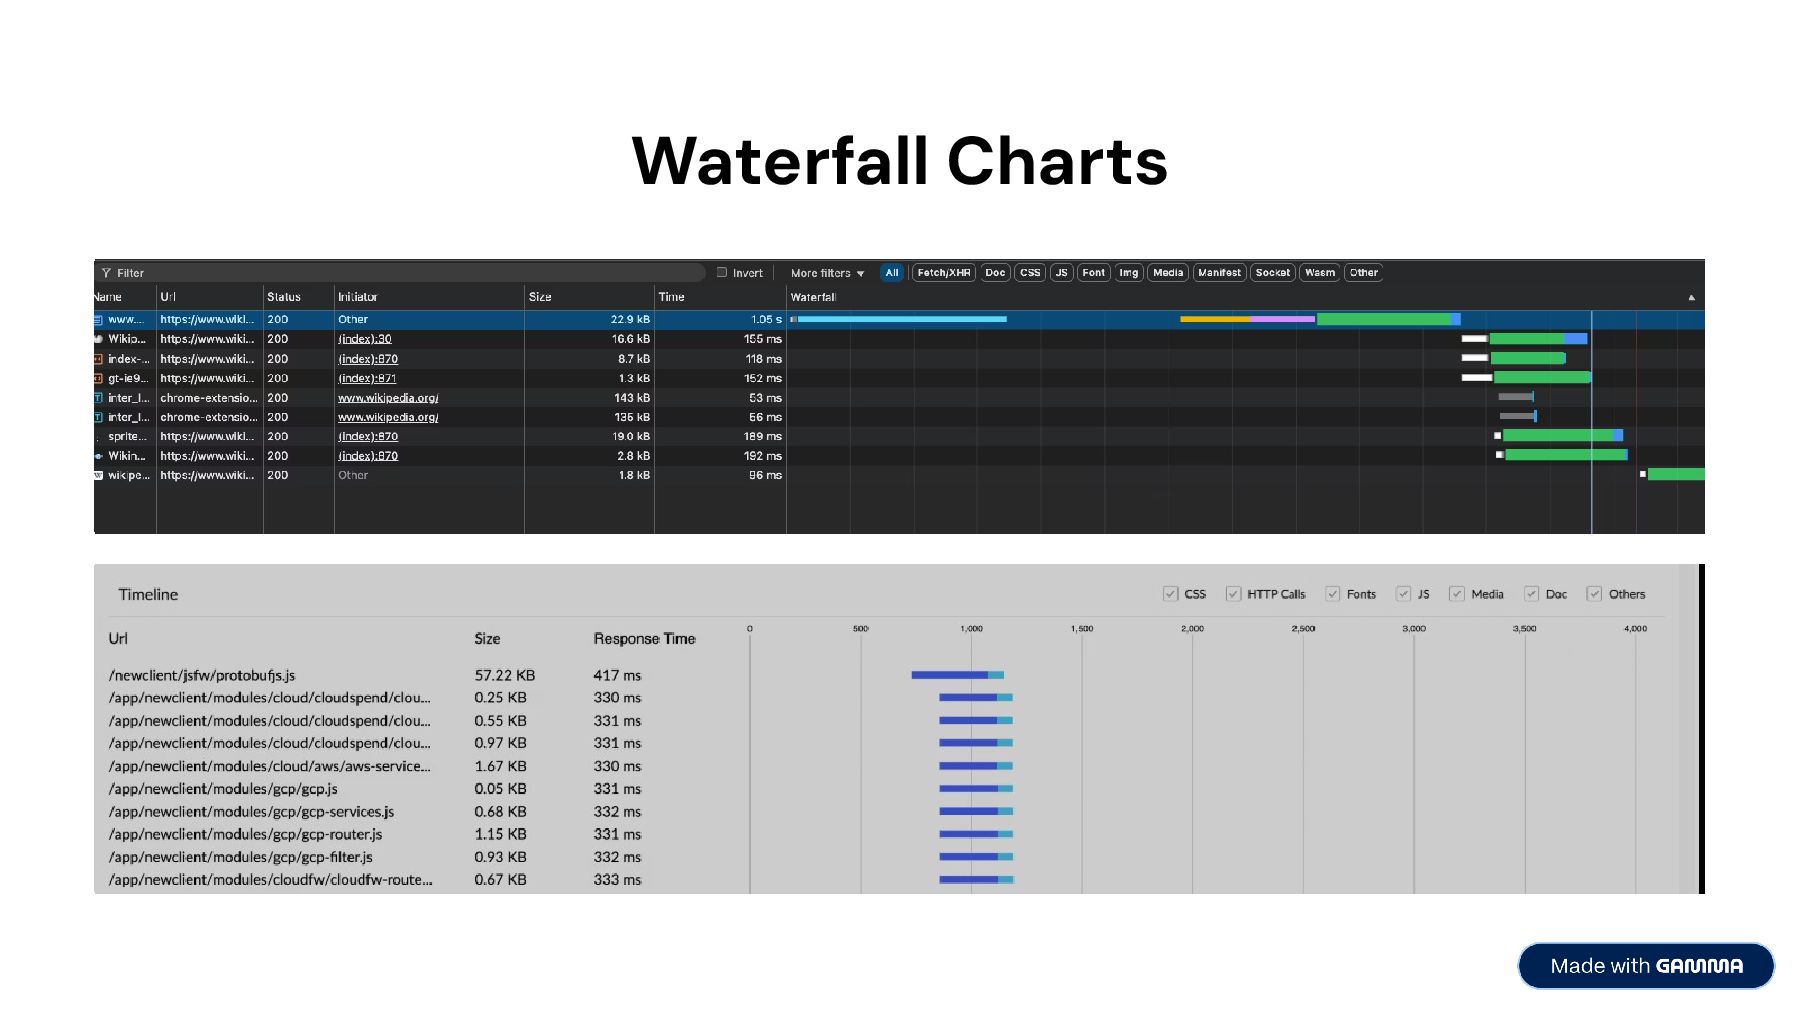
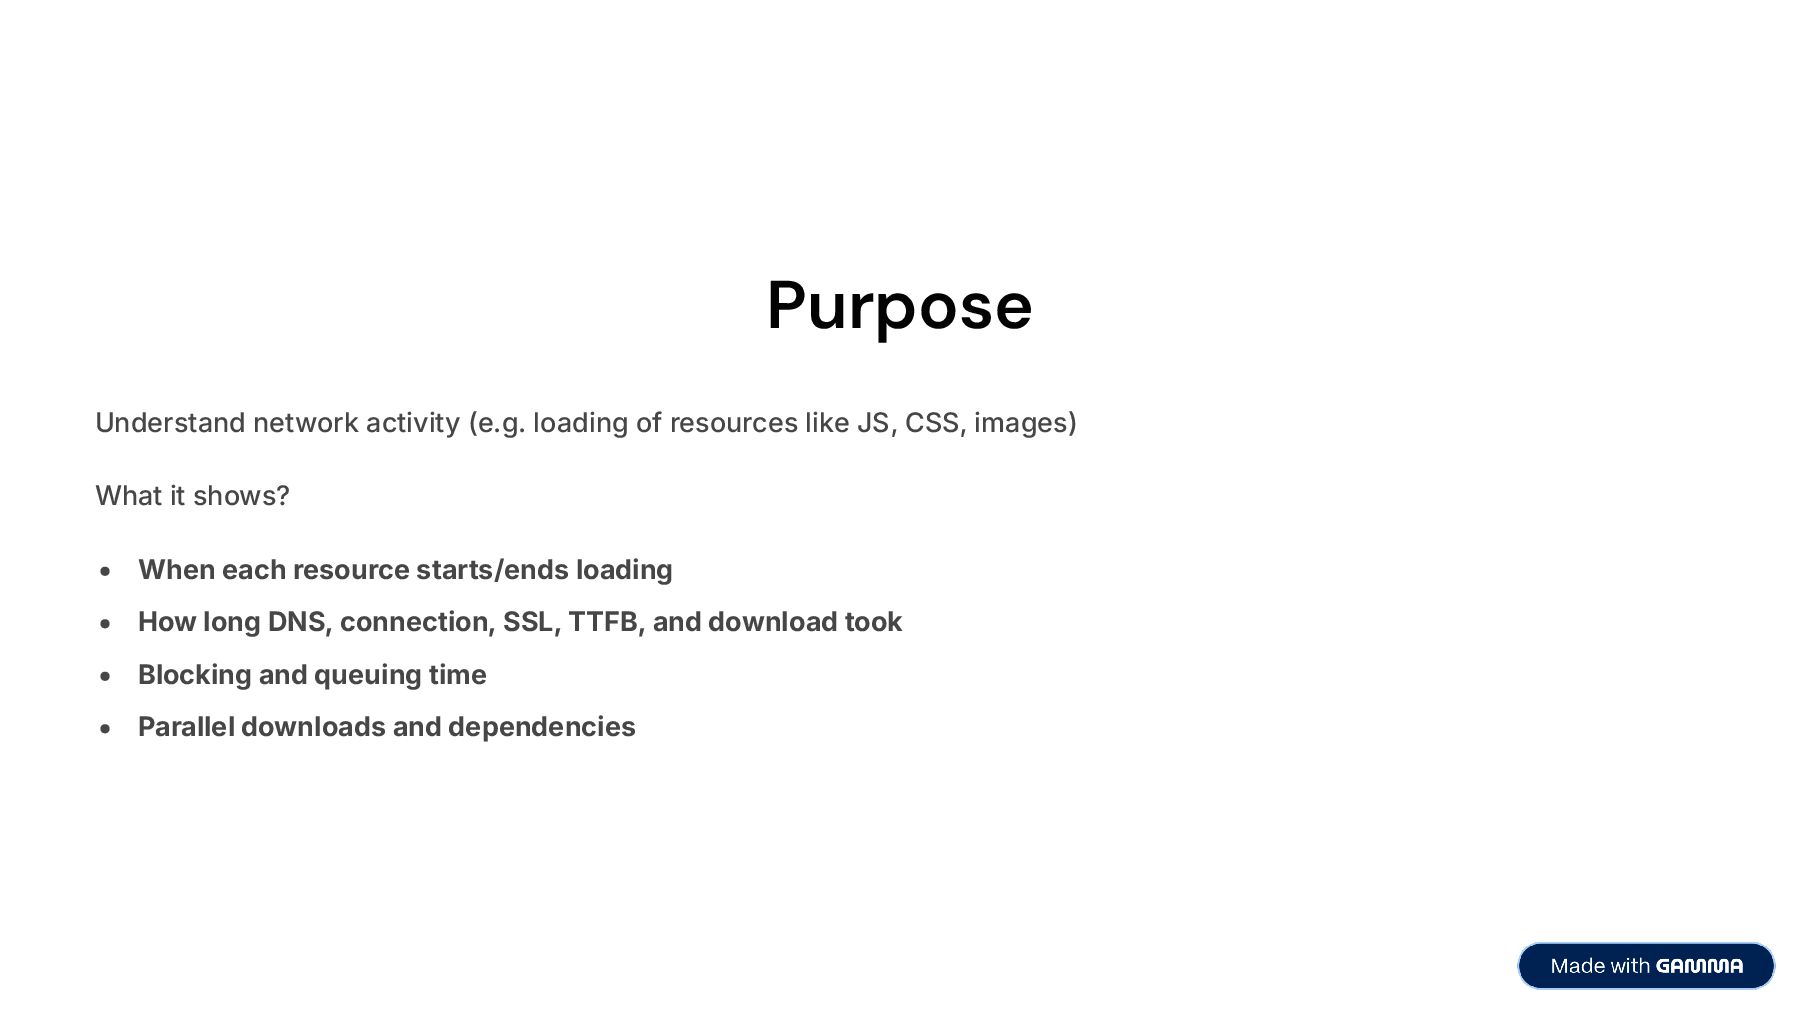
CSS, images) What it shows? When each resource starts/ends loading How long DNS, connection, SSL, TTFB, and download took Blocking and queuing time Parallel downloads and dependencies
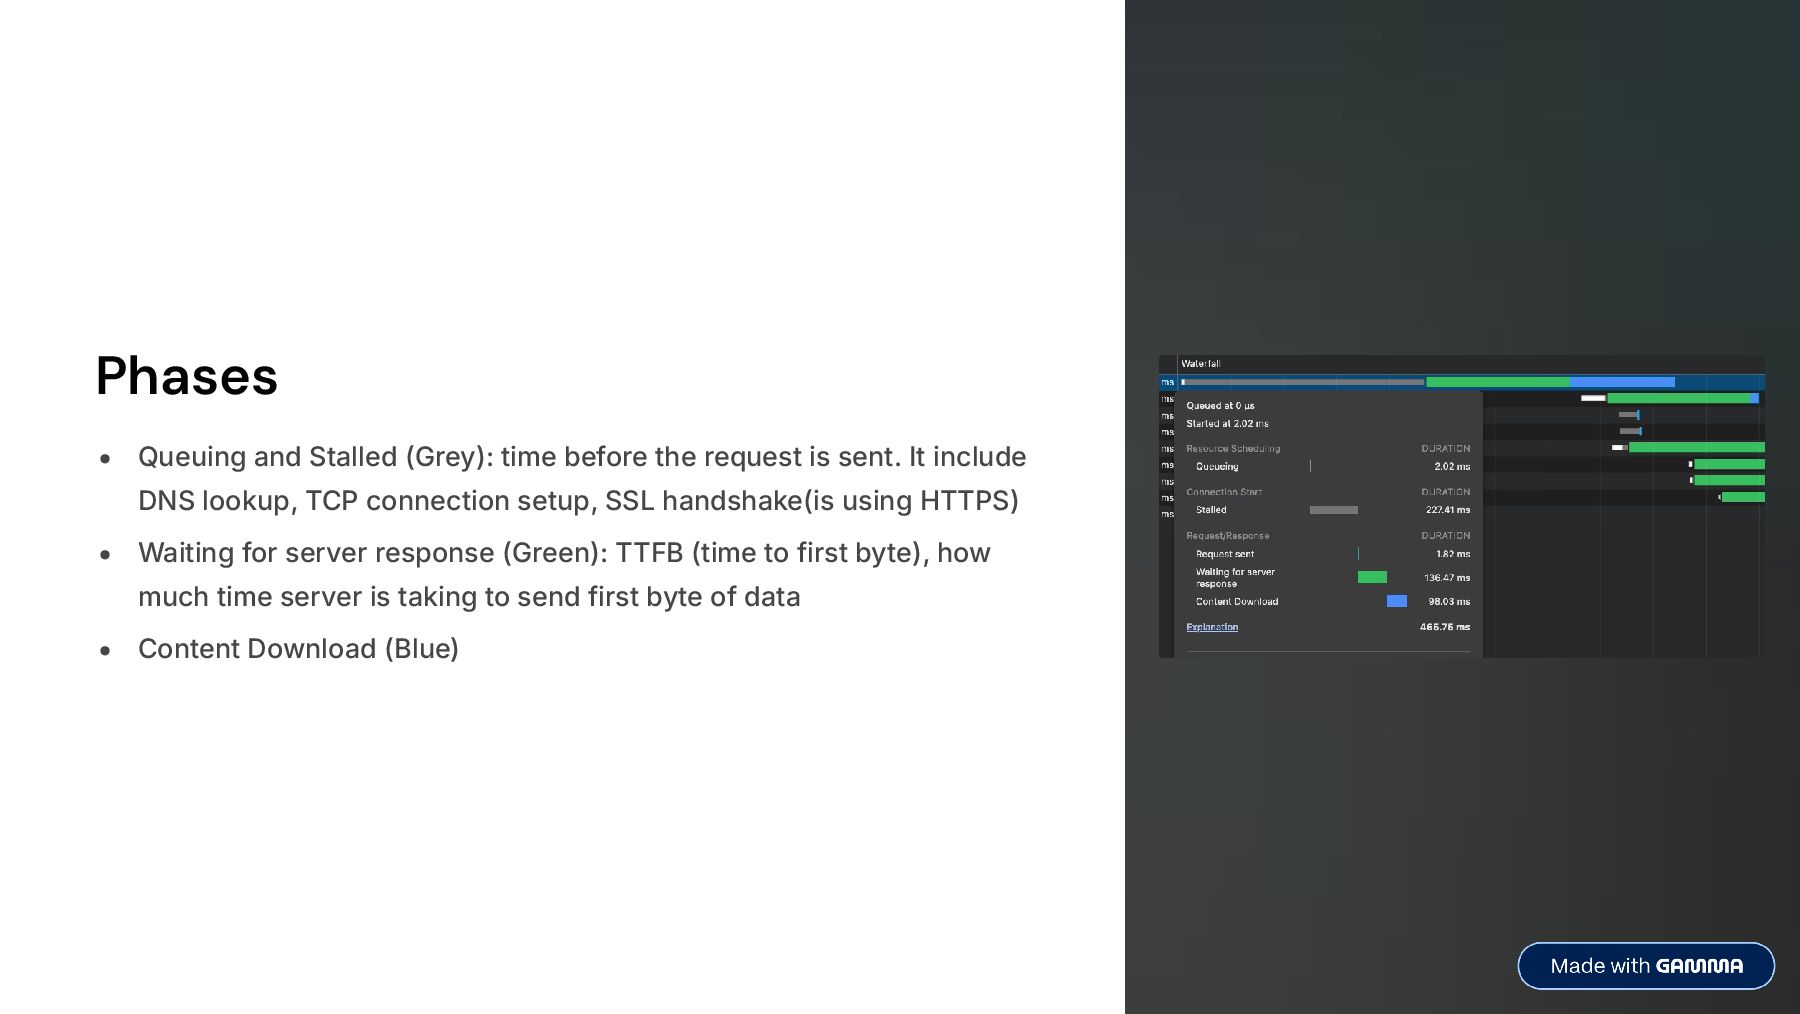
sent. It include DNS lookup, TCP connection setup, SSL handshake(is using HTTPS) Waiting for server response (Green): TTFB (time to first byte), how much time server is taking to send first byte of data Content Download (Blue)
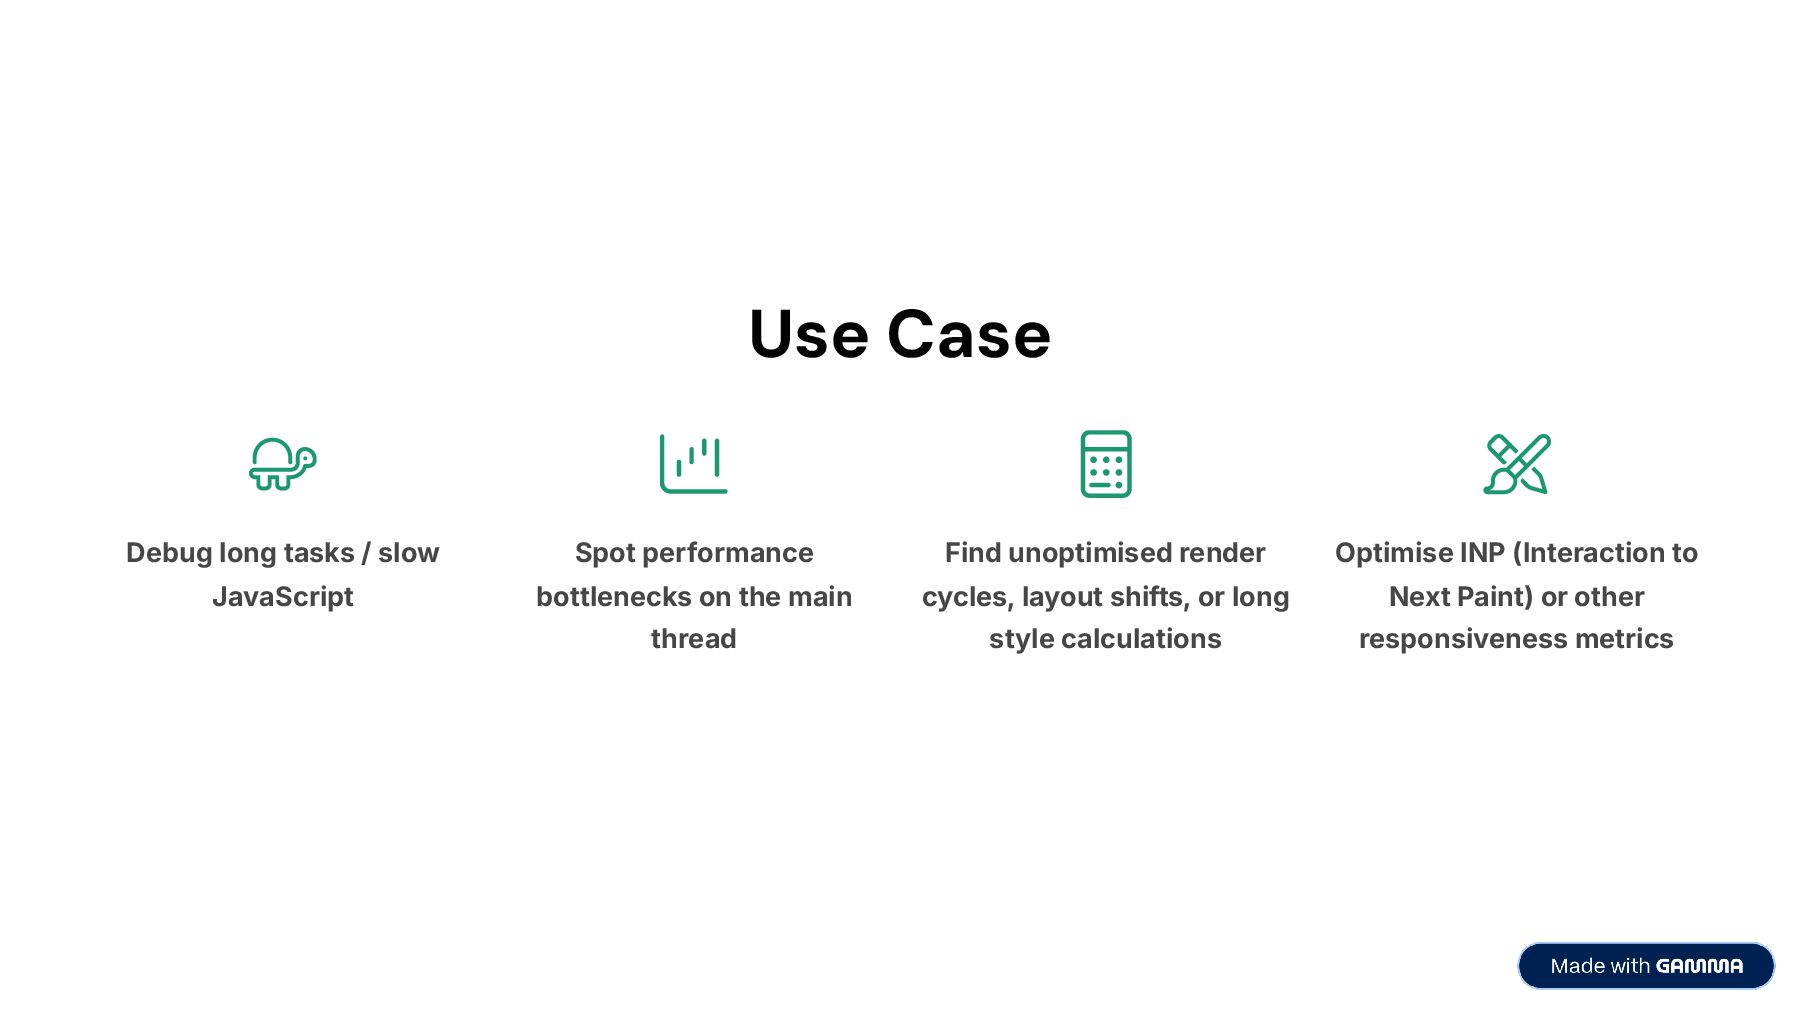
bottlenecks on the main thread Find unoptimised render cycles, layout shifts, or long style calculations Optimise INP (Interaction to Next Paint) or other responsiveness metrics