Upgrade to Pro — share decks privately, control downloads, hide ads and more …

JQuery Flot

Sponsored · SiteGround - Reliable hosting with speed, security, and support you can count on.

JQuery Flot

Presentation about JQuery Flot charting library

Avatar for alexarsh

alexarsh

March 27, 2012
Tweet

More Decks by alexarsh

Other Decks in Programming

Transcript

  1. JQuery Flot b y A r s h a v

    s k i A l e x a n d e r
  2. ...

  3. Flot works on: Firefox 2.x+ Safari 3.0+ Opera 9.5+ Konqueror

    4.x+ Internet Explorer 6+ (the excanvas Javascript emulation helper is used for IE < 9)
  4. A lot of plugins and examples Plugins - http://code.google.com/p/flot/wiki/ Plugins

    Bubble charts - https://github.com/ ubermajestix/flot-plugins Usage examples: http://code.google.com/p/ flot/wiki/FlotUsage
  5. Imports <link type="text/css" href="...jquery-ui.css"> <link type="text/css" href="...flot_layout.css" > <link type="text/css"

    href="...jquery-ui-1.8.16.custom.css"> <script type="text/javascript" src="...jquery-1.5.1.min.js"></script> <script type="text/javascript" src="...jquery-ui-1.8.10.custom.min.js"></script> <script type="text/javascript" src="...jquery.flot.min.js"></script> <script type="text/javascript" src="...jquery.flot.pie.min.js"></script> <script type="text/javascript" src="...jquery.blockUI.js"></script>
  6. Radio buttons <div id="radio"> <input type="radio" id="connections_radio" name="radio" checked="checked" /><label

    for="connections_radio">Connections</label> <input type="radio" id="usage_radio" name="radio" /><label for="usage_radio">Usage</label> <input type="radio" id="export_radio" name="radio" /><label for="export_radio">Export</label> </div>
  7. Tabs <div id="usage" style="display: none"> <div id="usage_tabs"> <ul> <li><a href="#day_statistics">Day</a></li>

    <li><a href="#week_statistics">Week</a></li> <li><a href="#month_statistics">Month</a></li> <li><a href="#year_statistics">Year</a></li> </ul> <div id="day_statistics"> <div id="graphs_container1" class="graph_container"> <div id="graph1"></div> <div id="graph1_legend" class="graph_legend"></div> </div> </div> ... </div> ... </div>
  8. Radio buttons $(function () { $("#connections_radio").click(function(event) { $("#connections").show(); $("#usage").hide(); $("#export").hide();

    }); $("#usage_radio").click(function(event) { $("#connections").hide(); $("#usage").show(); $("#export").hide(); }); $("#export_radio").click(function(event) { $("#connections").hide(); $("#usage").hide(); $("#export").show(); }); });
  9. As a python guy it’s a lot of code for

    me already, so it’s gonna be a mess
  10. Refactoring <script type="text/javascript" src="...statistics.js"></script> $(function () { ... get_connections_statistics(); get_usage_statistics();

    get_api_distribution_statistics(); get_distribution_statistics(); ... }); {% include "statistics/connections.html" %} {% include "statistics/usage.html" %} {% include "statistics/export.html" %}
  11. And now to the main part... var weekdayNames = "Sunday

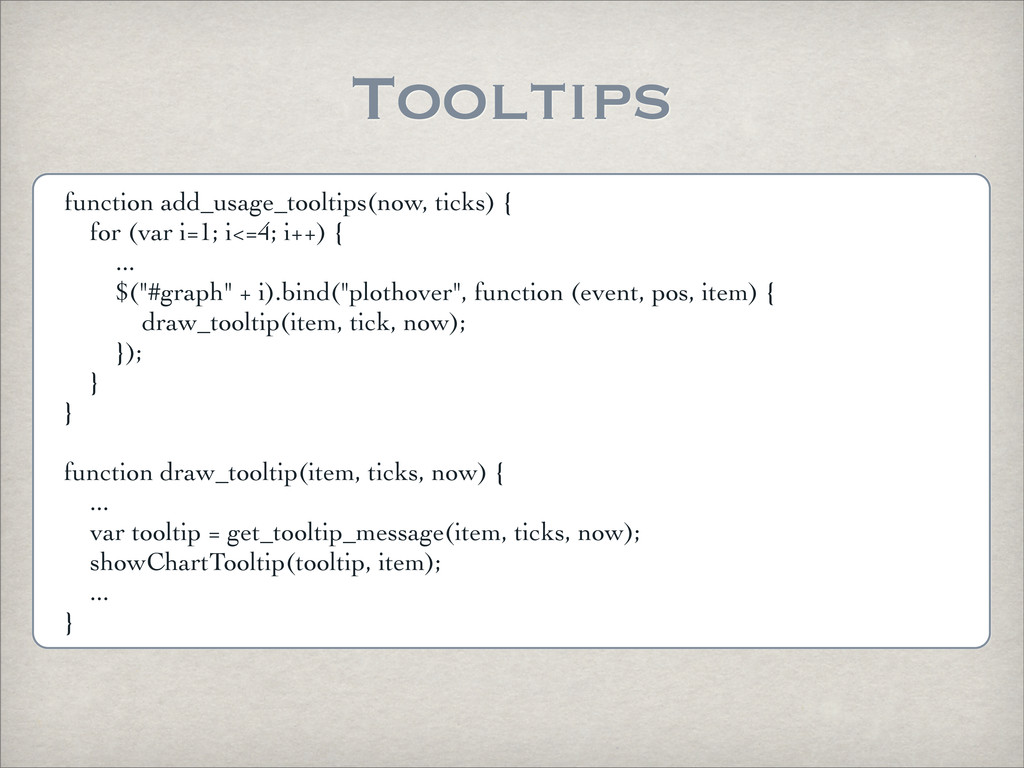
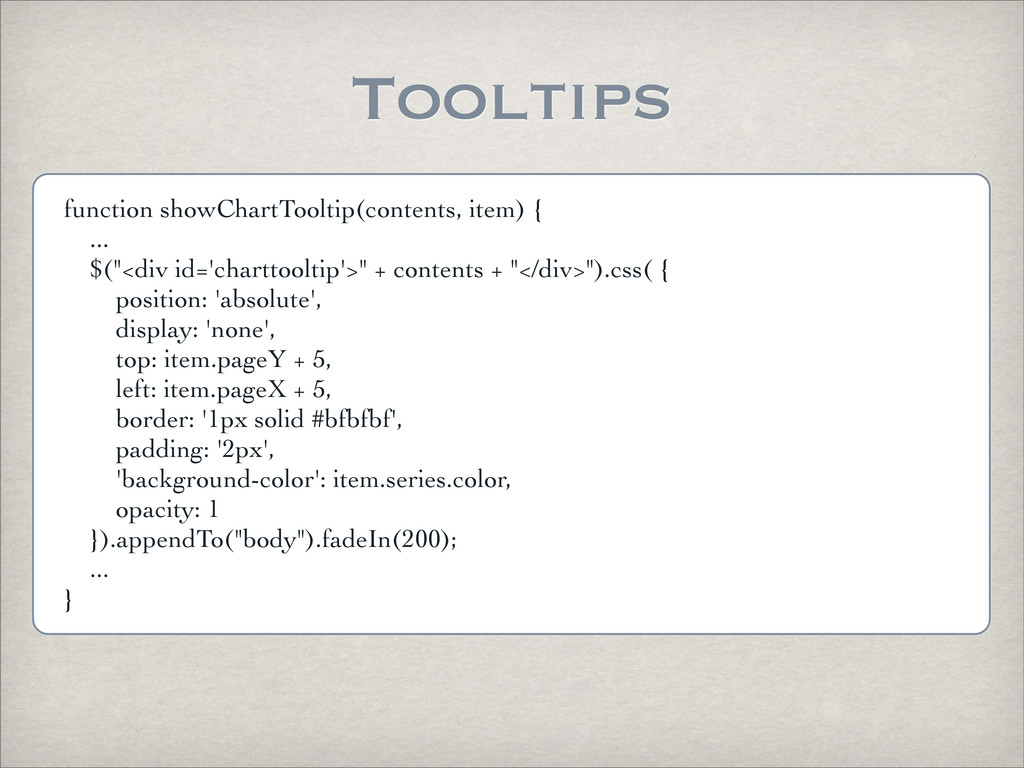
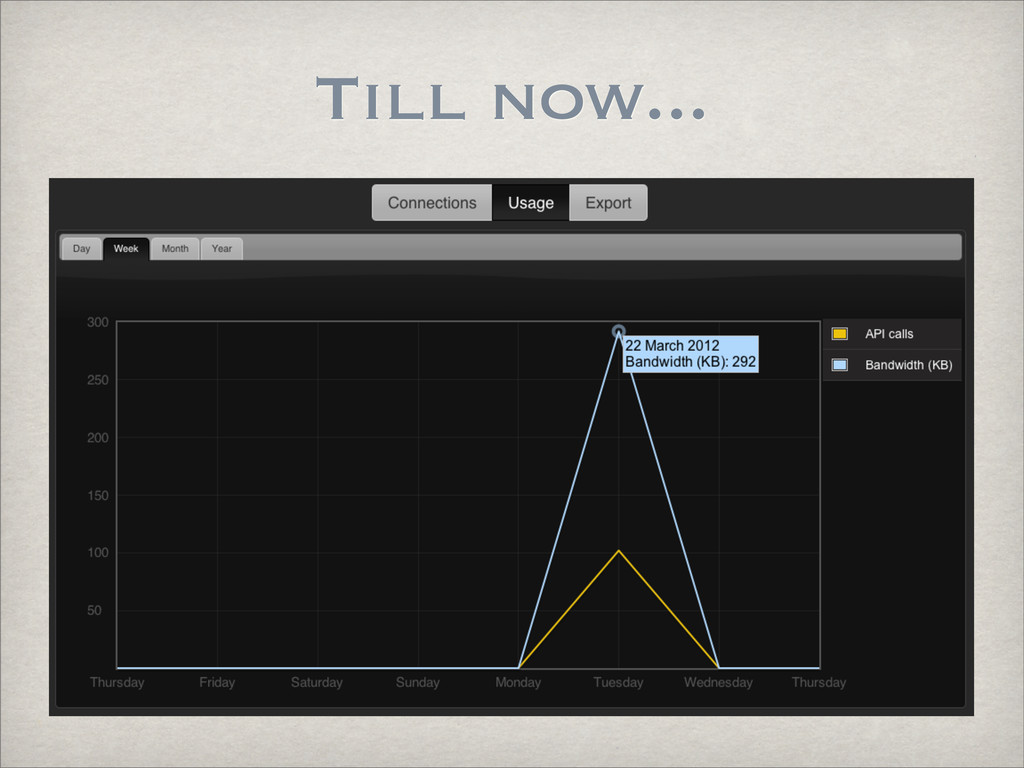
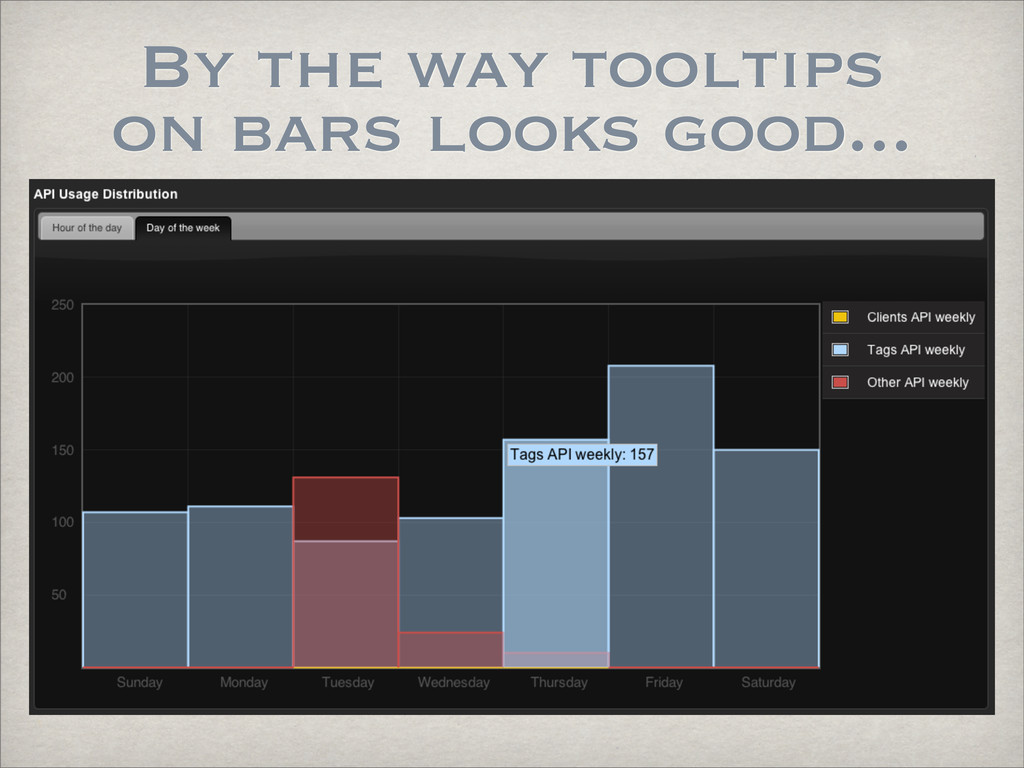
    Monday Tuesday Wednesday Thursday Friday Saturday".split(" "); var shortMonthNames = "Jan Feb Mar Apr May Jun Jul Aug Sep Oct Nov Dec".split(" "); $.get('/manage/get_statistics_usage_data', {}, function(data){ var stat_data = jQuery.parseJSON(data); //variables init var now = new Date().getTime() + stat_data.time_offset; var weekday = new Date(now).getDay(); var month = new Date(now).getMonth(); ...
  12. And now to the main part... //building weekly data var

    api_calls_points = stat_data.api_calls_weekly; var bandwidth_points = stat_data.bandwidth_weekly; for(var i=0; i<api_calls_points.length; i++) { graph2_ticks.push([7-i, weekdayNames[(weekday+7-i)%7]]); api_calls_weekly.push([i, api_calls_points[i]]); bandwidth_weekly.push([i, bandwidth_points[i]]); } ... //building yearly data var api_calls_points = stat_data.api_calls_yearly; var bandwidth_points = stat_data.bandwidth_yearly; for(var i=0; i<api_calls_points.length; i++) { graph4_ticks.push([12-i, shortMonthNames[(month+12-i)%12]]); api_calls_yearly.push([i, api_calls_points[i]]); bandwidth_yearly.push([i, bandwidth_points[i]]); }
  13. And now to the main part... var options2 = {

    legend: { position: "ne", container: $("#graph2_legend") }, xaxis: { ticks: graph2_ticks }, yaxis: { min: 0, tickDecimals: 0 //only whole numbers }, grid: { hoverable: true } }; xaxis: { //in case of time axis mode: "time", timeformat: "%H:%M" },
  14. And now to the main part... var usage_plot2 = $.plot($("#graph2"),

    [ { data: api_calls_weekly, label: "API calls", lines: { show: true } }, { label: "Bandwidth (KB)", data: bandwidth_weekly, lines: { show: true } }, ], options2);
  15. Graph Select $('.legendColorBox').parent().click(function() { var plot = usage_plot1; var data

    = [api_calls_daily, bandwidth_daily]; var graph = $(this).parent().parent().parent().attr("id").split("_")[0]; if (graph == "graph2") { plot = usage_plot2; data = [api_calls_weekly, bandwidth_weekly]; } ... if ($(this).children().text() == "API calls") { plot.setData(get_plot_data([data[0], null, "lines", [], null, "lines"])); } if ($(this).children().text() == "Bandwidth (KB)") { plot.setData(get_plot_data([[], null, "lines", data[1], null, "lines"])); } plot.draw(); ...
  16. Graph Select var ticks = [graph2_ticks, graph3_ticks, graph4_ticks]; if ($(this).siblings().text().search("Show

    all") == -1) { $('<tr/>', { style: 'cursor: auto;' }).bind('click', {plot: plot, data: data, ticks: ticks, now: now}, show_all_usage_graphs) .append("<td class='legendColorBox'></td><td>Show all</td>").appendTo($ (this).parent()); } }); function show_all_usage_graphs(e) { e.data.plot.setData(get_plot_data([e.data.data[0], null, "lines", e.data.data[1], null, "lines"])); e.data.plot.draw(); $(this).remove(); }
  17. What about tooltips? I could take them from a lot

    of places. For example: http://jquerytools.org/
  18. Tooltips function add_usage_tooltips(now, ticks) { for (var i=1; i<=4; i++)

    { ... $("#graph" + i).bind("plothover", function (event, pos, item) { draw_tooltip(item, tick, now); }); } } function draw_tooltip(item, ticks, now) { ... var tooltip = get_tooltip_message(item, ticks, now); showChartTooltip(tooltip, item); ... }
  19. Tooltips function showChartTooltip(contents, item) { ... $("<div id='charttooltip'>" + contents

    + "</div>").css( { position: 'absolute', display: 'none', top: item.pageY + 5, left: item.pageX + 5, border: '1px solid #bfbfbf', padding: '2px', 'background-color': item.series.color, opacity: 1 }).appendTo("body").fadeIn(200); ... }
  20. How can I make bars? $.plot($("#graph2"), [ { data: api_calls_weekly,

    label: "Clients API hourly", bars: { show: true } //instead of: lines: { show: true } }, ... ], options2);
  21. Charts var options = { series: { pie: { show:

    true, radius: 1, label: { show: true, radius: 3/4, formatter: function(label, series){ return '<div style="font-size:12pt;text-align:center;padding: 2px;color:black;">'+label+'<br/>'+Math.round(series.percent)+'%</div>'; }, background: { opacity: 0.5 } } } } }; $.plot($("#countries_piechart"), data, options);
  22. BlockUI <script type="text/javascript" src="...jquery.blockUI.js"></script> $(function () { ... var message

    = '<img src=".../loader.gif" /> Please wait...'; $("#usage_tabs").block({ message: message }); ... get_usage_statistics(); ... } function get_usage_statistics() { $.get('.../get_statistics_usage_data', {}, function(data){ ... $("#usage_tabs").unblock(); }); }