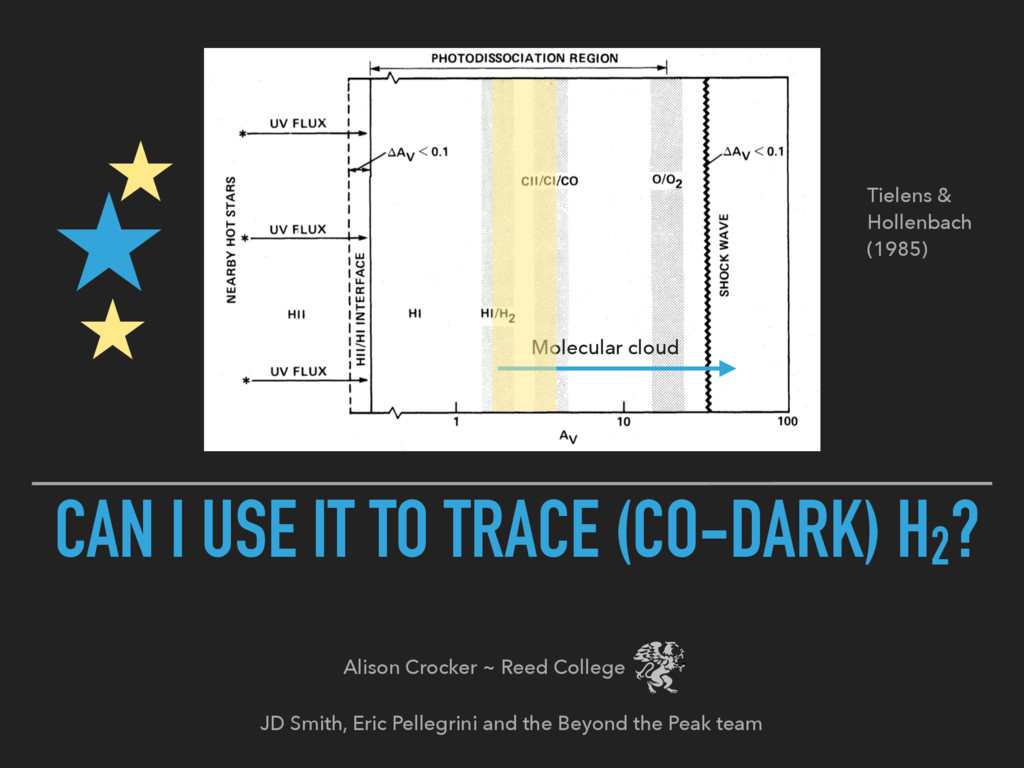
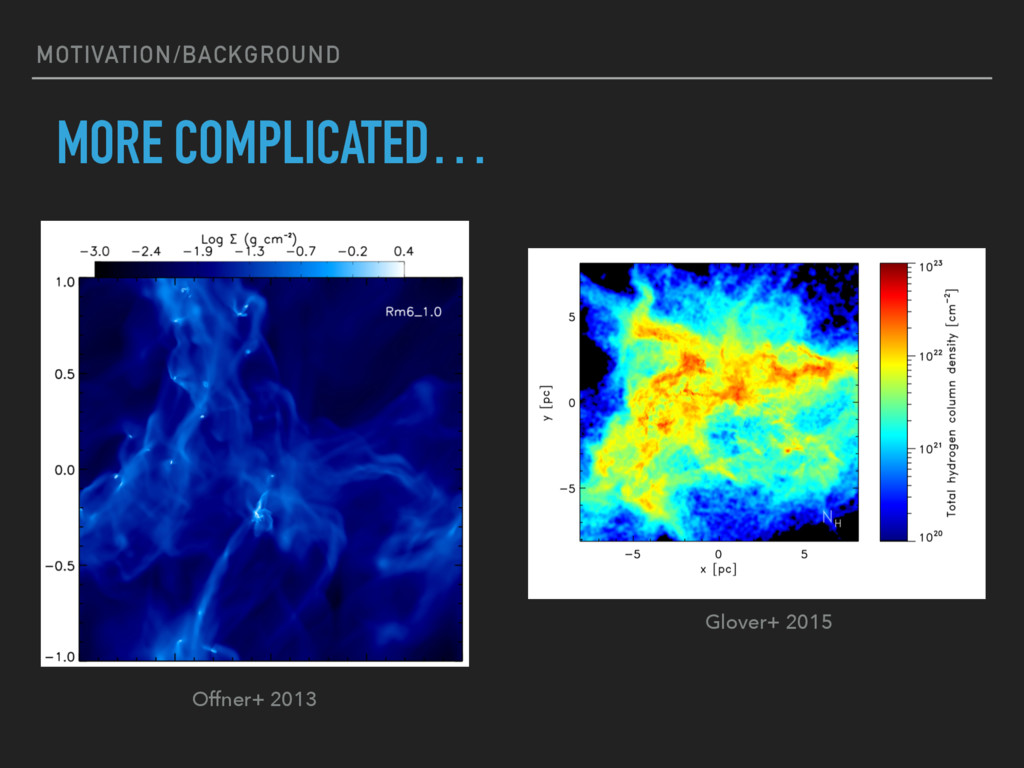
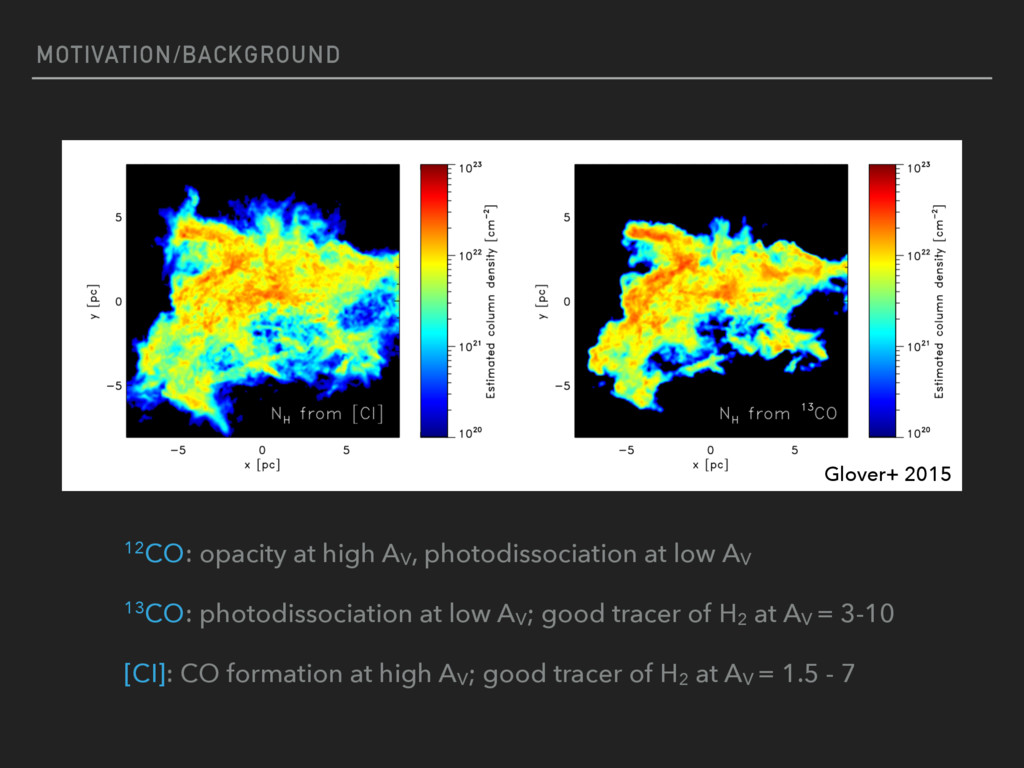
Neutral, atomic carbon exists in the interstellar medium between regions where singly-ionized carbon and carbon monoxide lock away the carbon. While it's known this should be in regions where hydrogen is predominantly molecular, it is not known whether the [CI] emission traces mostly a diffuse or dense portion of the molecular gas.
![WHAT ISM PHASE DOES [CI] EMISSION TRACE? Alison Crocker ~](https://files.speakerdeck.com/presentations/0ba0c7b3d4904cb9aadbfc5637822826/slide_0.jpg)
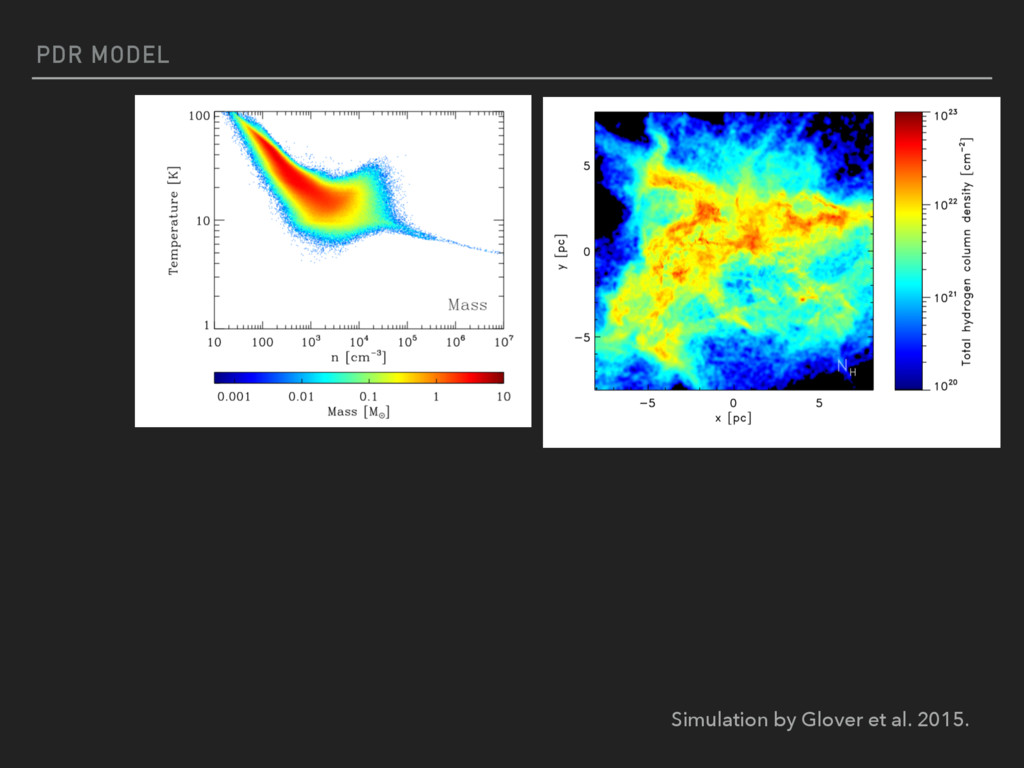
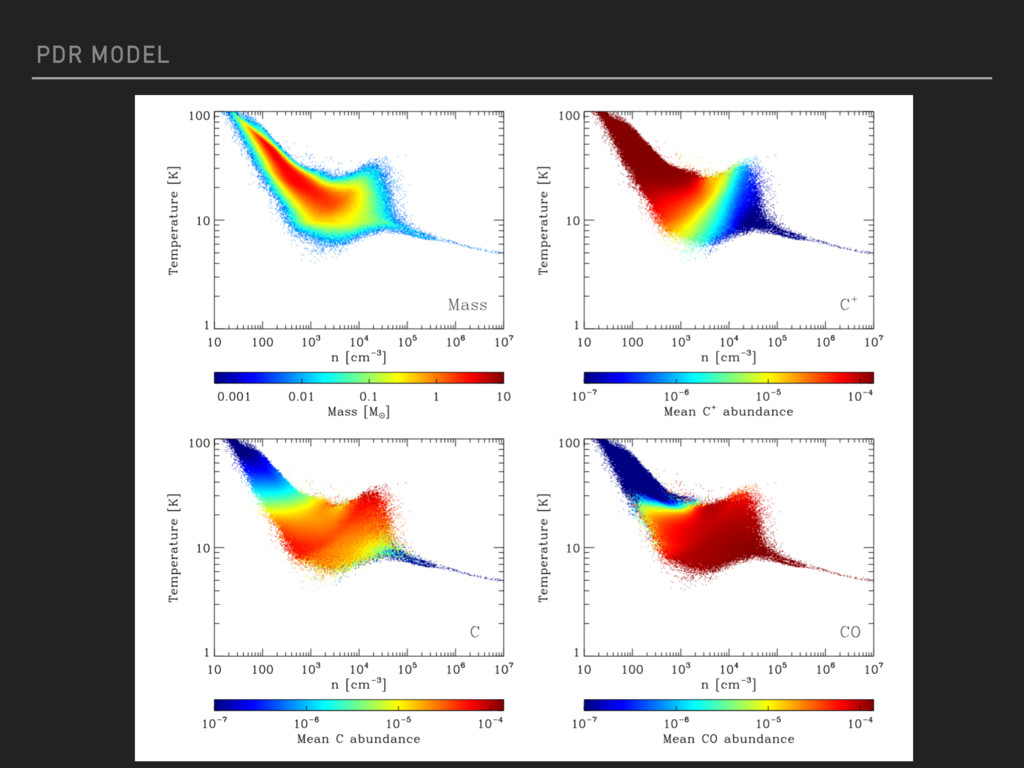
![MOTIVATION/BACKGROUND Glover et al. 2015 [CI] lines come from fine-structure](https://files.speakerdeck.com/presentations/0ba0c7b3d4904cb9aadbfc5637822826/slide_3.jpg)
![MOTIVATION/BACKGROUND Glover et al. 2015 [CI] lines come from fine-structure](https://files.speakerdeck.com/presentations/0ba0c7b3d4904cb9aadbfc5637822826/slide_4.jpg)
![MOTIVATION/BACKGROUND log(X12CO ) log(X[CI] ) -1.91 1.91 0.0 0.64 1.27](https://files.speakerdeck.com/presentations/0ba0c7b3d4904cb9aadbfc5637822826/slide_9.jpg)
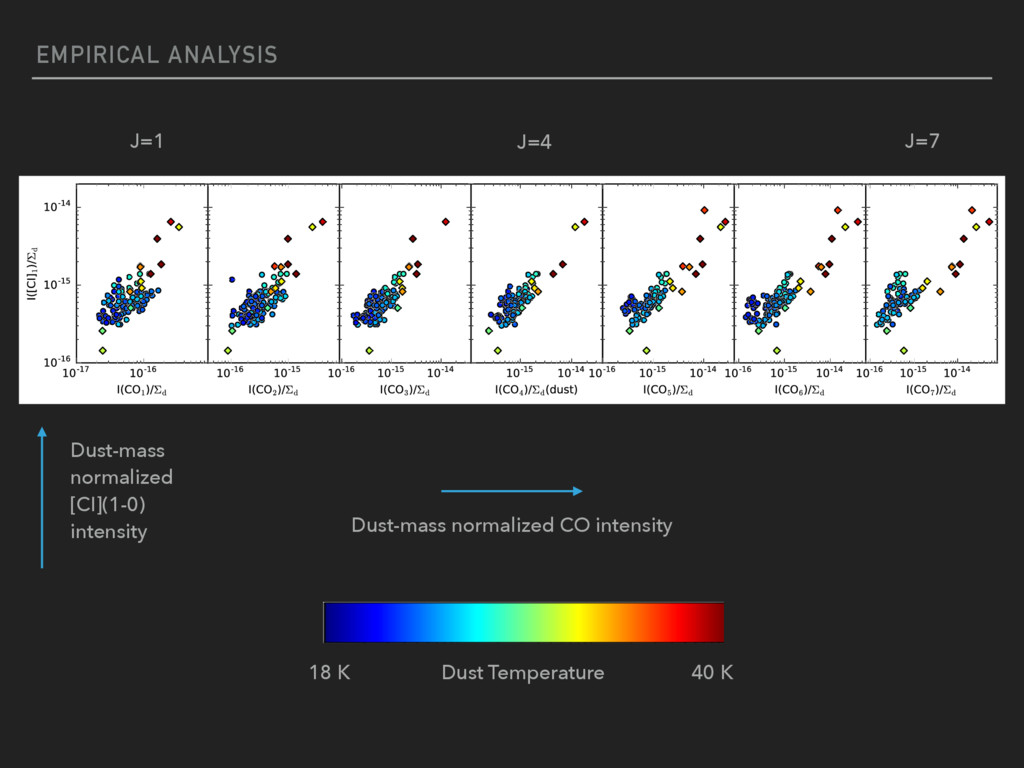
/[CI](1-0)](https://files.speakerdeck.com/presentations/0ba0c7b3d4904cb9aadbfc5637822826/slide_14.jpg)
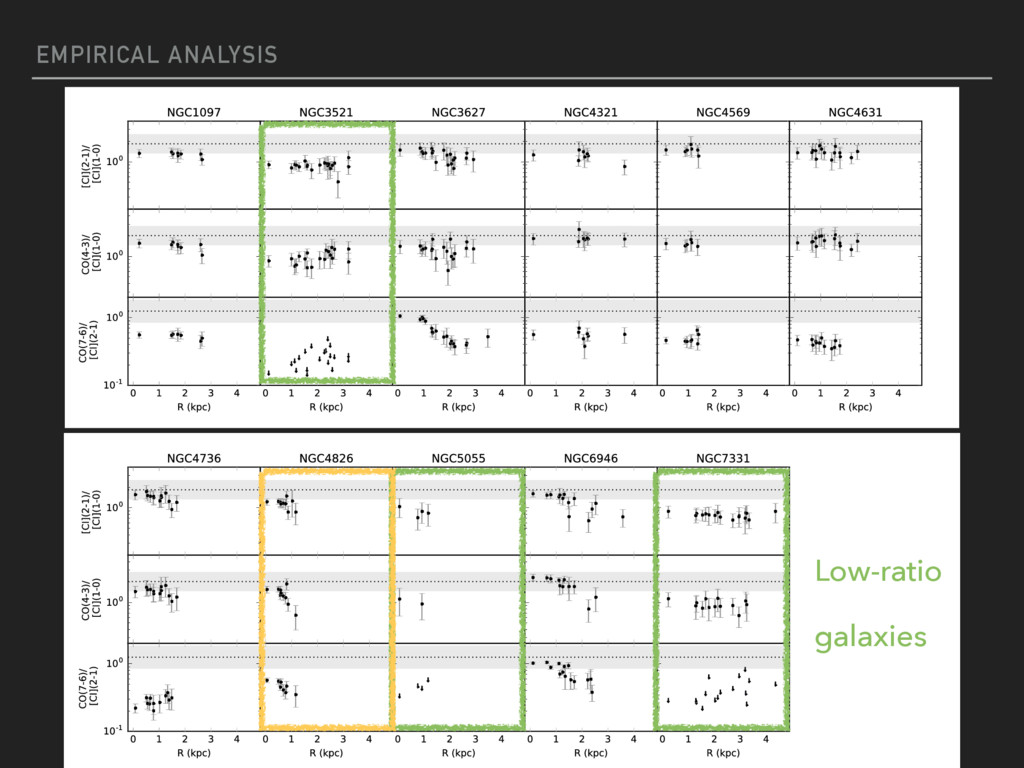
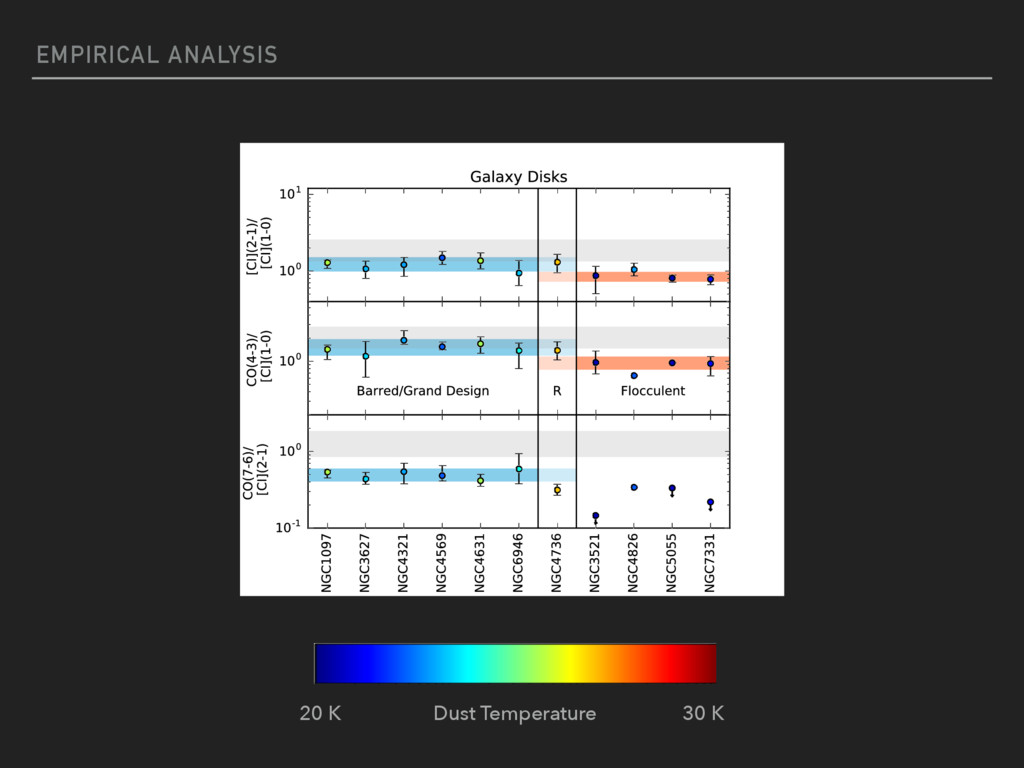
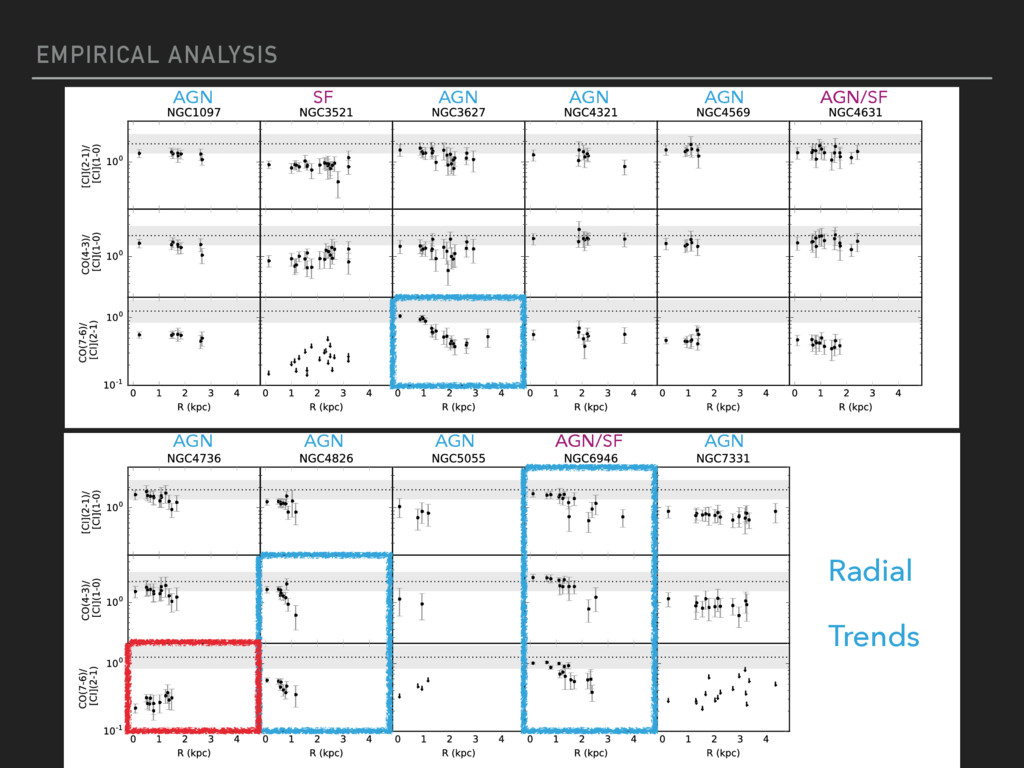
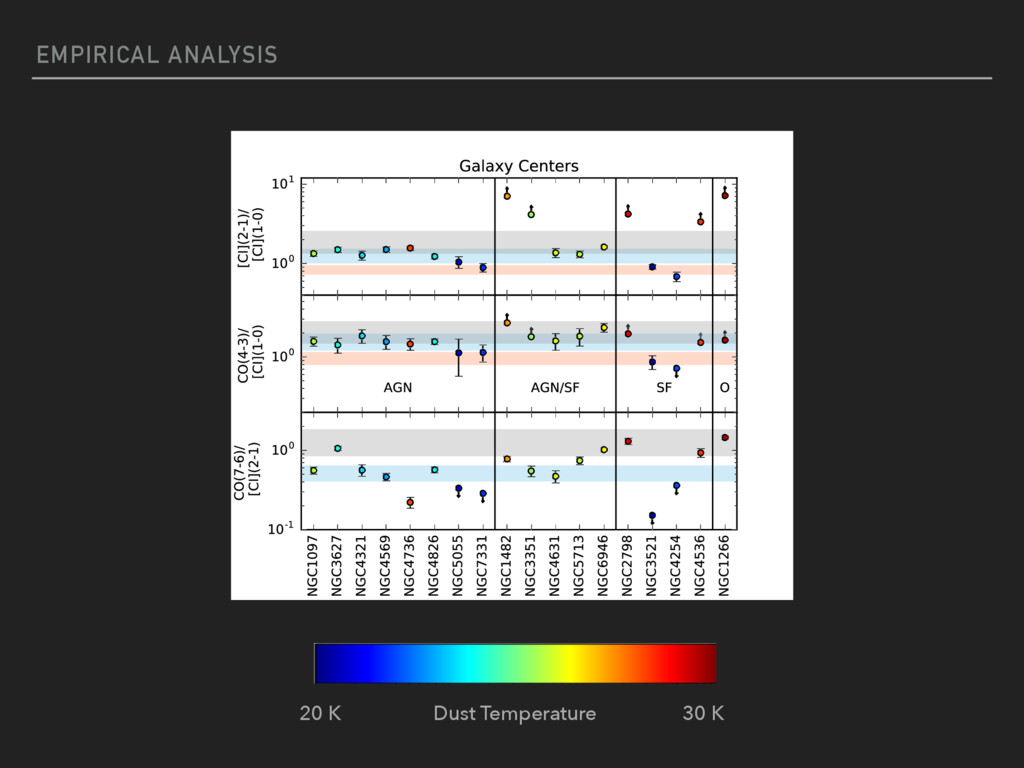
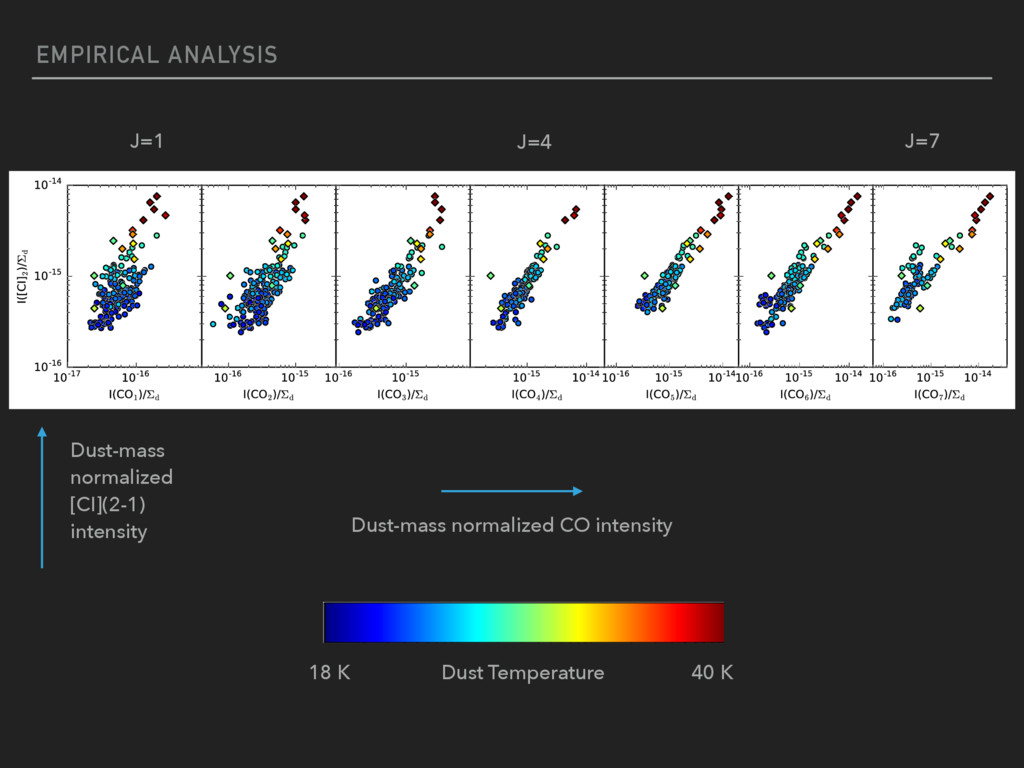
![EMPIRICAL ANALYSIS What 12CO line do the [CI] lines best](https://files.speakerdeck.com/presentations/0ba0c7b3d4904cb9aadbfc5637822826/slide_23.jpg)
 intensity J=1 J=7](https://files.speakerdeck.com/presentations/0ba0c7b3d4904cb9aadbfc5637822826/slide_24.jpg)
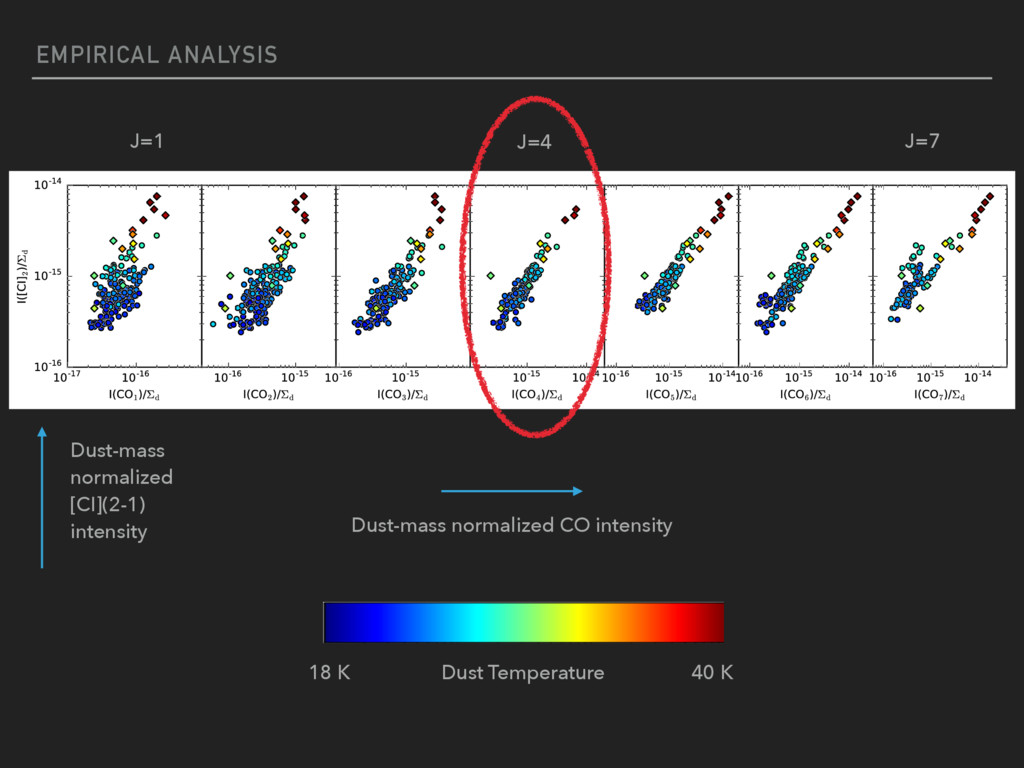
 intensity J=1 J=7](https://files.speakerdeck.com/presentations/0ba0c7b3d4904cb9aadbfc5637822826/slide_28.jpg)
 intensity J=1 J=7](https://files.speakerdeck.com/presentations/0ba0c7b3d4904cb9aadbfc5637822826/slide_29.jpg)
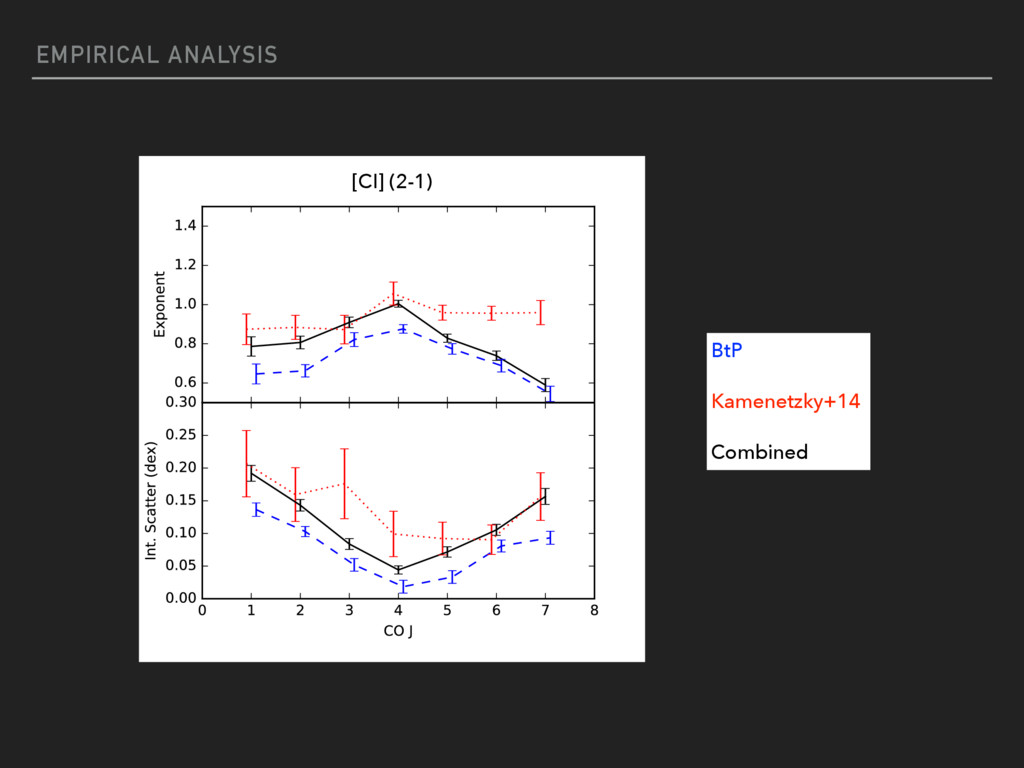
![Glover et al. 2015 EMPIRICAL ANALYSIS BtP Kamenetzky+14 Combined [CI]](https://files.speakerdeck.com/presentations/0ba0c7b3d4904cb9aadbfc5637822826/slide_31.jpg)
, and](https://files.speakerdeck.com/presentations/0ba0c7b3d4904cb9aadbfc5637822826/slide_36.jpg)
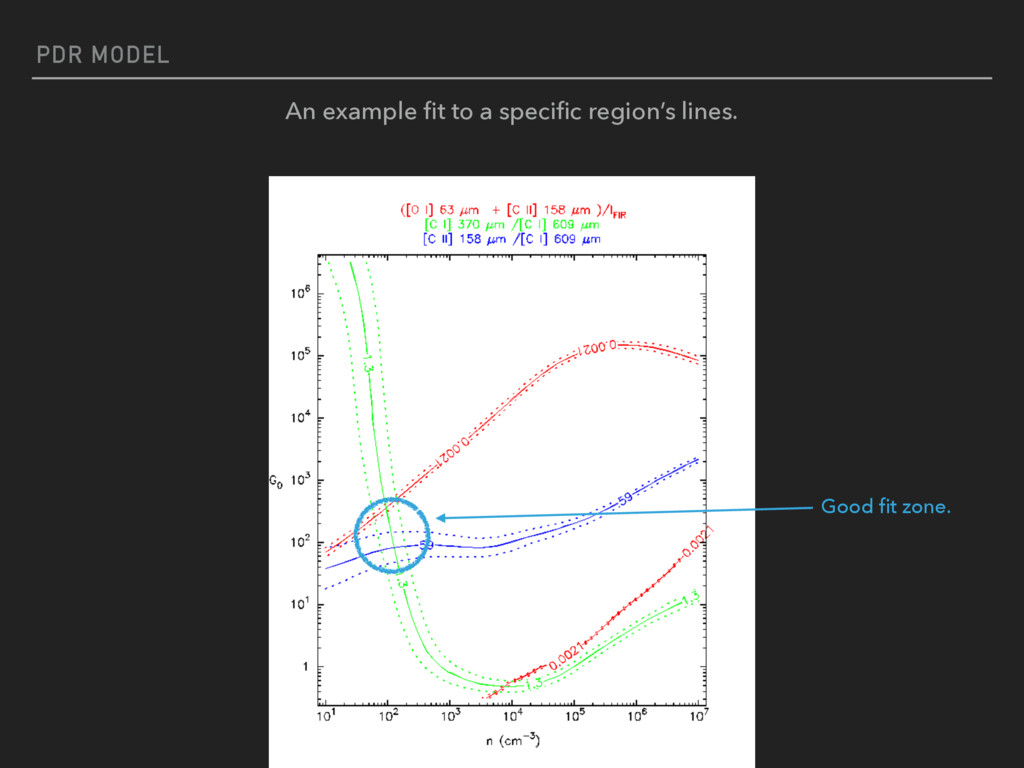
![PDR MODEL PDR fit results to FIR, [CII], [OI], [CI](1-0),](https://files.speakerdeck.com/presentations/0ba0c7b3d4904cb9aadbfc5637822826/slide_38.jpg)
![PDR MODEL PDR fit results to FIR, [CII], [OI], [CI](1-0),](https://files.speakerdeck.com/presentations/0ba0c7b3d4904cb9aadbfc5637822826/slide_39.jpg)