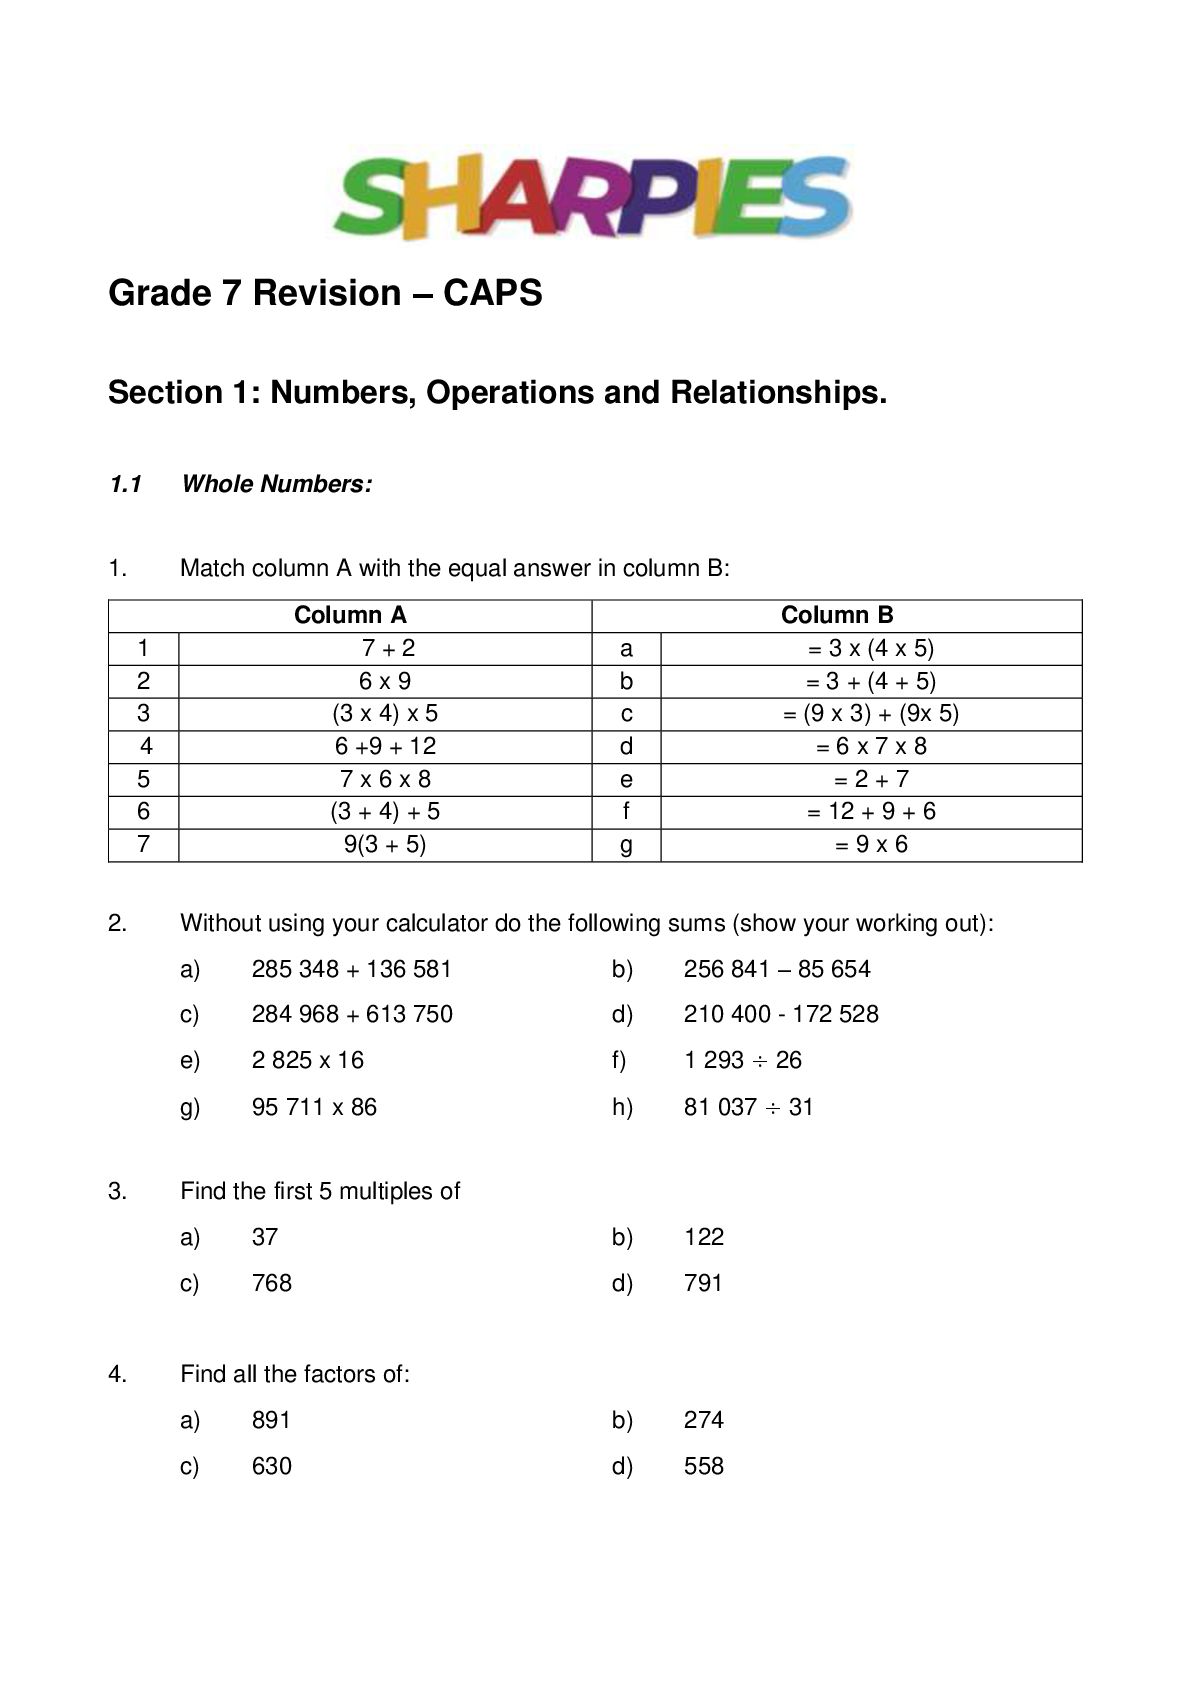
Relationships. 1.1 Whole Numbers: 1. Match column A with the equal answer in column B: Column A 7+2 6x9 (3 x 4) x 5 6 +9 + 12 7x6x8 (3 + 4) + 5 9(3 + 5) 1 2 3 4 5 6 7 2. 3. 4. Column B = 3 x (4 x 5) = 3 + (4 + 5) = (9 x 3) + (9x 5) =6x7x8 =2+7 = 12 + 9 + 6 =9x6 a b c d e f g Without using your calculator do the following sums (show your working out): a) 285 348 + 136 581 b) 256 841 – 85 654 c) 284 968 + 613 750 d) 210 400 - 172 528 e) 2 825 x 16 f) 1 293 ÷ 26 g) 95 711 x 86 h) 81 037 ÷ 31 Find the first 5 multiples of a) 37 b) 122 c) 768 d) 791 Find all the factors of: a) 891 b) 274 c) 630 d) 558
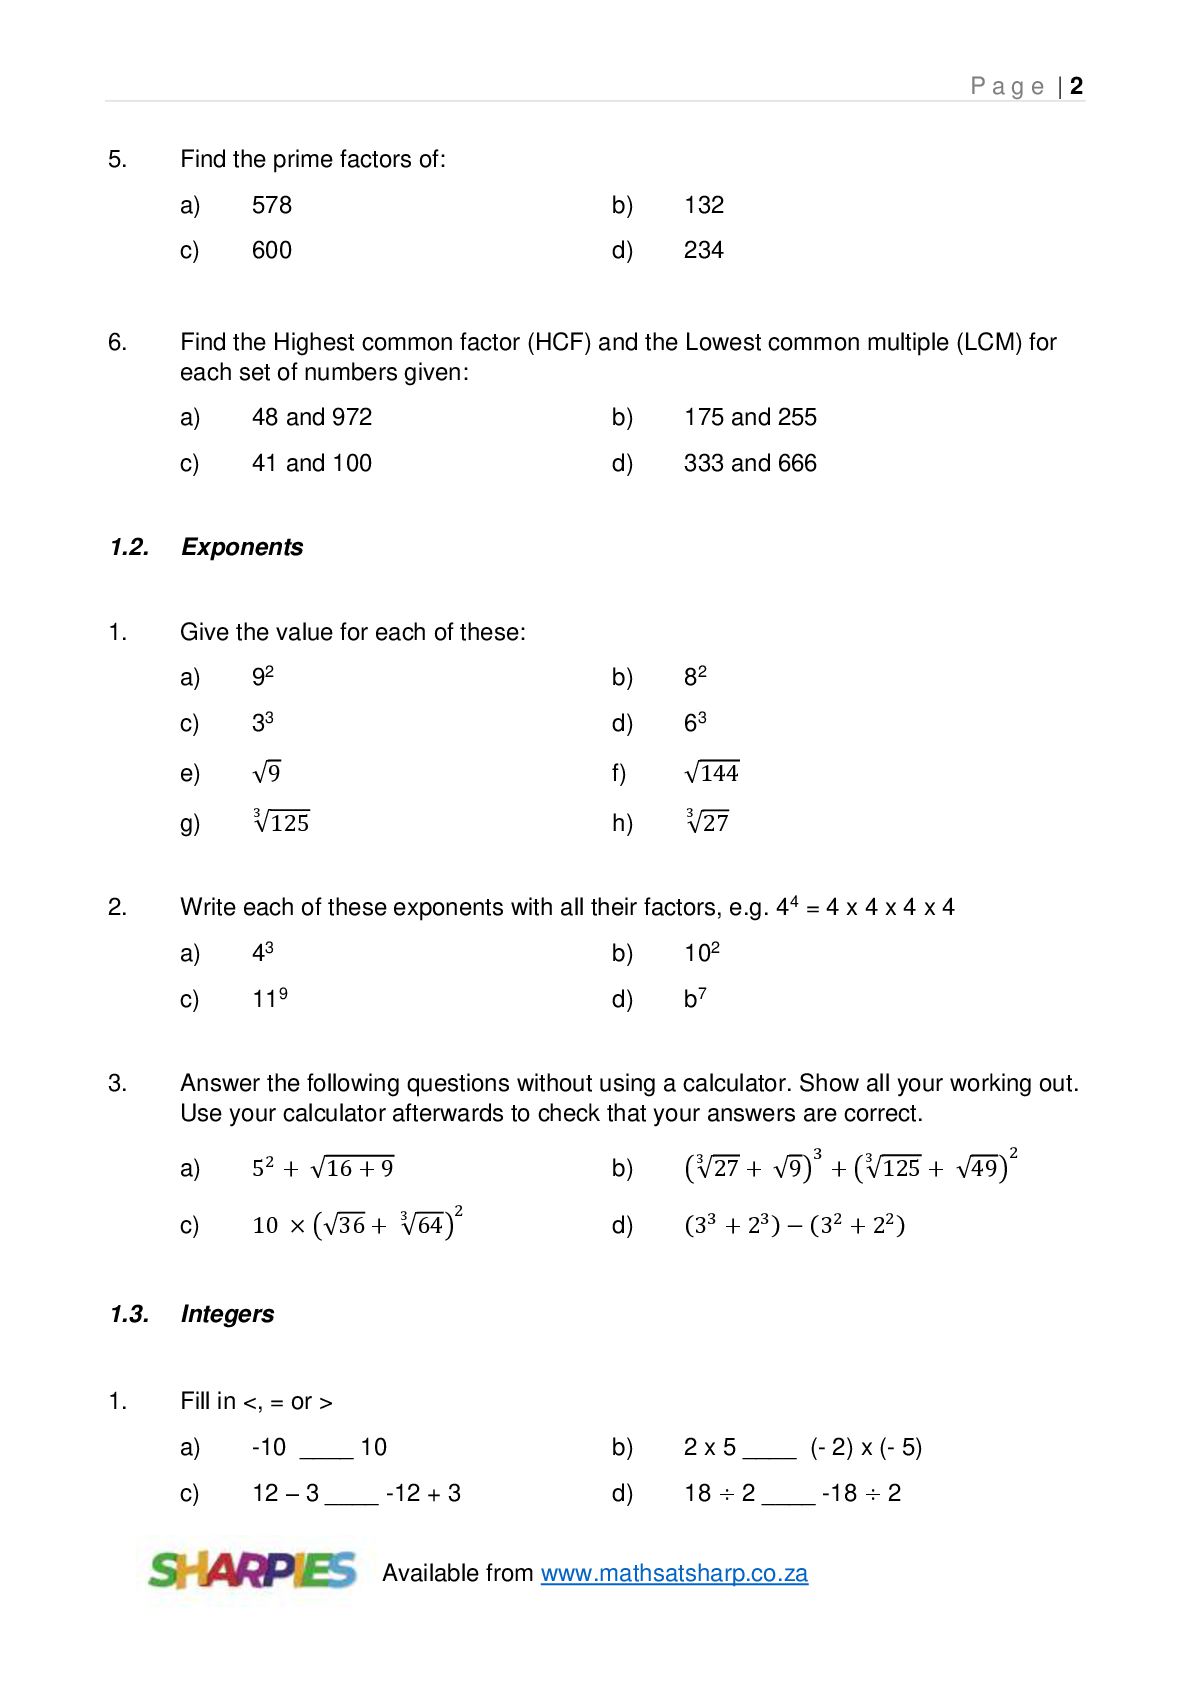
578 b) 132 c) 600 d) 234 Find the Highest common factor (HCF) and the Lowest common multiple (LCM) for each set of numbers given: a) 48 and 972 b) 175 and 255 c) 41 and 100 d) 333 and 666 1.2. Exponents 1. Give the value for each of these: a) 92 b) 82 c) 33 d) 63 e) √9 f) √144 h) 3 g) 2. 3. 3 √125 √27 Write each of these exponents with all their factors, e.g. 44 = 4 x 4 x 4 x 4 a) 43 b) 102 c) 119 d) b7 Answer the following questions without using a calculator. Show all your working out. Use your calculator afterwards to check that your answers are correct. a) 52 + √16 + 9 c) 10 × (√36 + √64) 3 1.3. Integers 1. Fill in <, = or > 2 3 3 3 b) ( √27 + √9) + ( √125 + √49) d) (33 + 23 ) − (32 + 22 ) a) -10 ____ 10 b) 2 x 5 ____ (- 2) x (- 5) c) 12 – 3 ____ -12 + 3 d) 18 ÷ 2 ____ -18 ÷ 2 Available from www.mathsatsharp.co.za 2
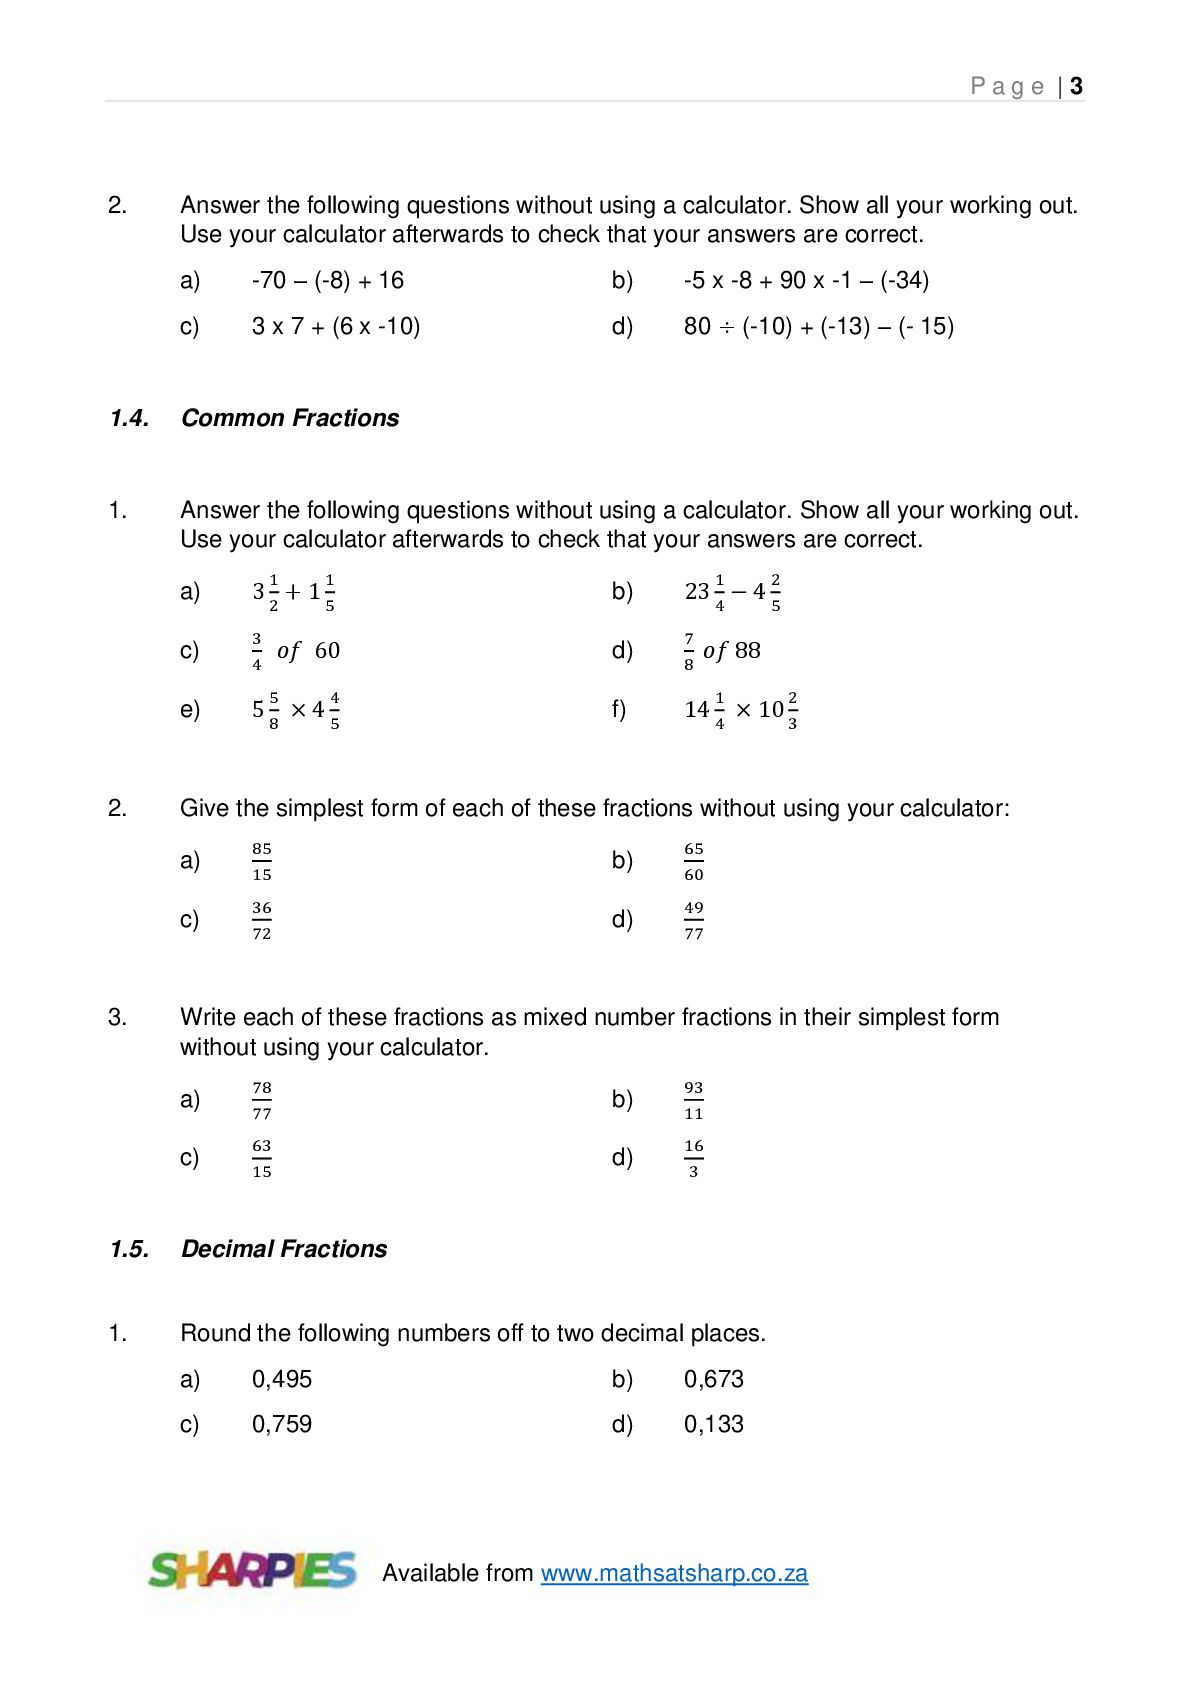
calculator. Show all your working out. Use your calculator afterwards to check that your answers are correct. a) -70 – (-8) + 16 b) -5 x -8 + 90 x -1 – (-34) c) 3 x 7 + (6 x -10) d) 80 ÷ (-10) + (-13) – (- 15) 1.4. Common Fractions 1. Answer the following questions without using a calculator. Show all your working out. Use your calculator afterwards to check that your answers are correct. a) c) e) 2. 1 3 b) 𝑜𝑓 60 4 5 d) 4 58 × 45 f) 1 2 23 4 − 4 5 7 8 𝑜𝑓 88 1 2 14 4 × 10 3 Give the simplest form of each of these fractions without using your calculator: a) c) 3. 1 32 + 15 85 b) 15 36 d) 72 65 60 49 77 Write each of these fractions as mixed number fractions in their simplest form without using your calculator. a) c) 78 b) 77 63 d) 15 93 11 16 3 1.5. Decimal Fractions 1. Round the following numbers off to two decimal places. a) 0,495 b) 0,673 c) 0,759 d) 0,133 Available from www.mathsatsharp.co.za
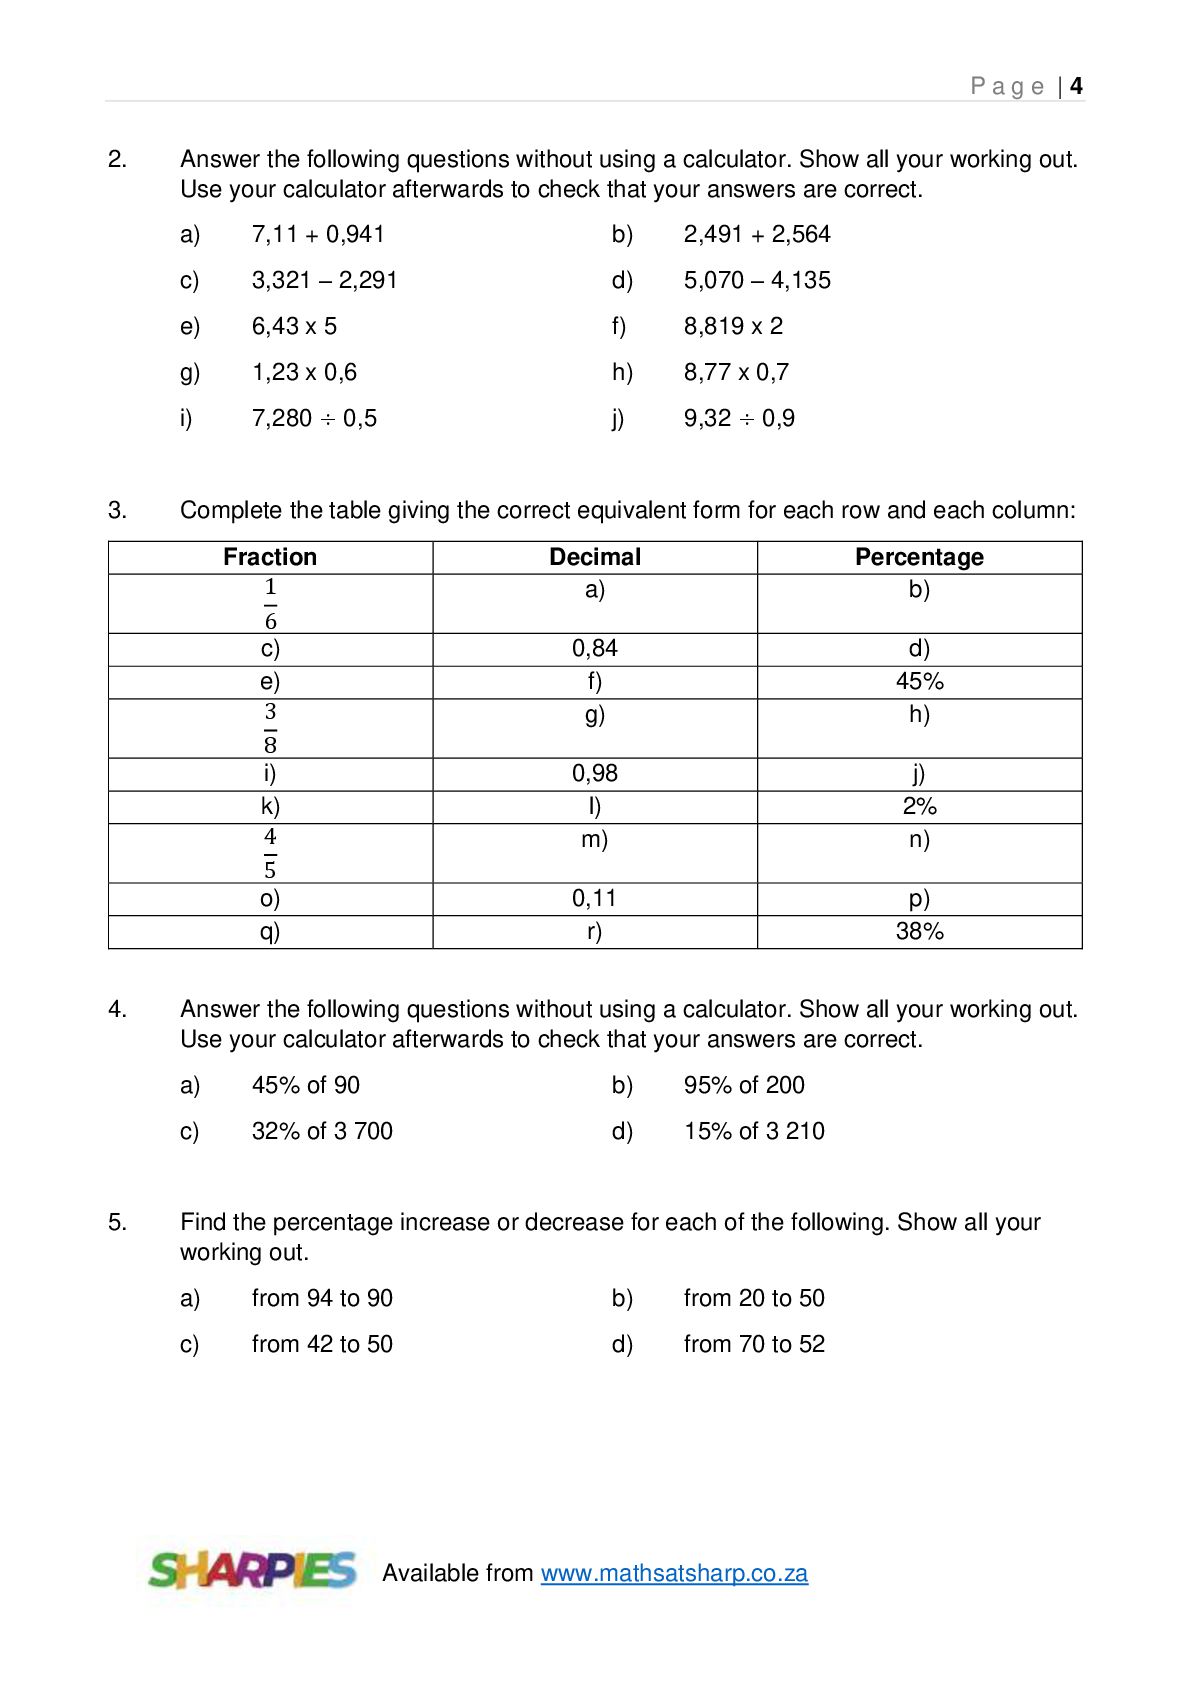
a calculator. Show all your working out. Use your calculator afterwards to check that your answers are correct. a) 7,11 + 0,941 b) 2,491 + 2,564 c) 3,321 – 2,291 d) 5,070 – 4,135 e) 6,43 x 5 f) 8,819 x 2 g) 1,23 x 0,6 h) 8,77 x 0,7 i) 7,280 ÷ 0,5 j) 9,32 ÷ 0,9 Complete the table giving the correct equivalent form for each row and each column: Fraction 1 6 c) e) 3 8 i) k) 4 5 o) q) 4. 5. Decimal a) Percentage b) 0,84 f) g) d) 45% h) 0,98 l) m) j) 2% n) 0,11 r) p) 38% Answer the following questions without using a calculator. Show all your working out. Use your calculator afterwards to check that your answers are correct. a) 45% of 90 b) 95% of 200 c) 32% of 3 700 d) 15% of 3 210 Find the percentage increase or decrease for each of the following. Show all your working out. a) from 94 to 90 b) from 20 to 50 c) from 42 to 50 d) from 70 to 52 Available from www.mathsatsharp.co.za
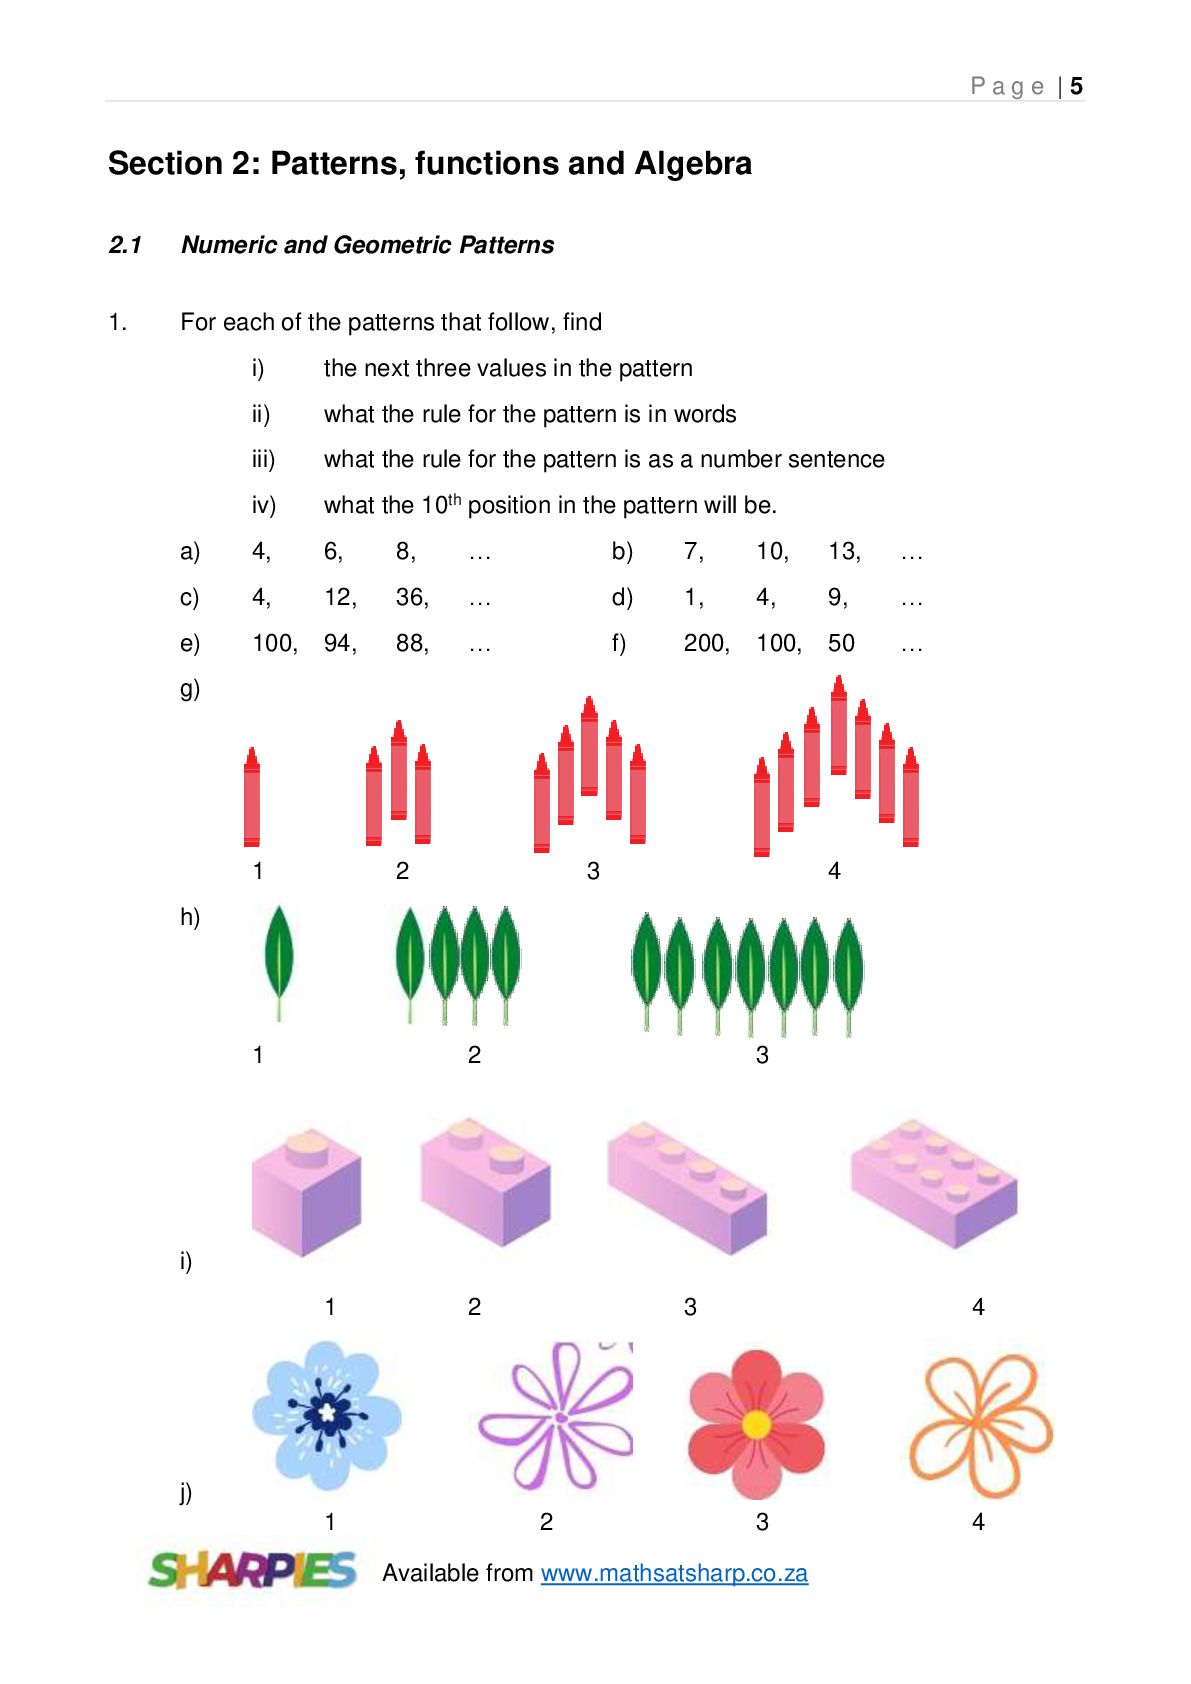
and Geometric Patterns 1. For each of the patterns that follow, find i) the next three values in the pattern ii) what the rule for the pattern is in words iii) what the rule for the pattern is as a number sentence iv) what the 10th position in the pattern will be. a) 4, 6, 8, … b) 7, 10, 13, … c) 4, 12, 36, … d) 1, 4, 9, … e) 100, 94, 88, … f) 200, 100, 50 … g) 1 2 3 4 h) 1 2 3 i) 1 2 3 4 j) 1 2 3 Available from www.mathsatsharp.co.za 4
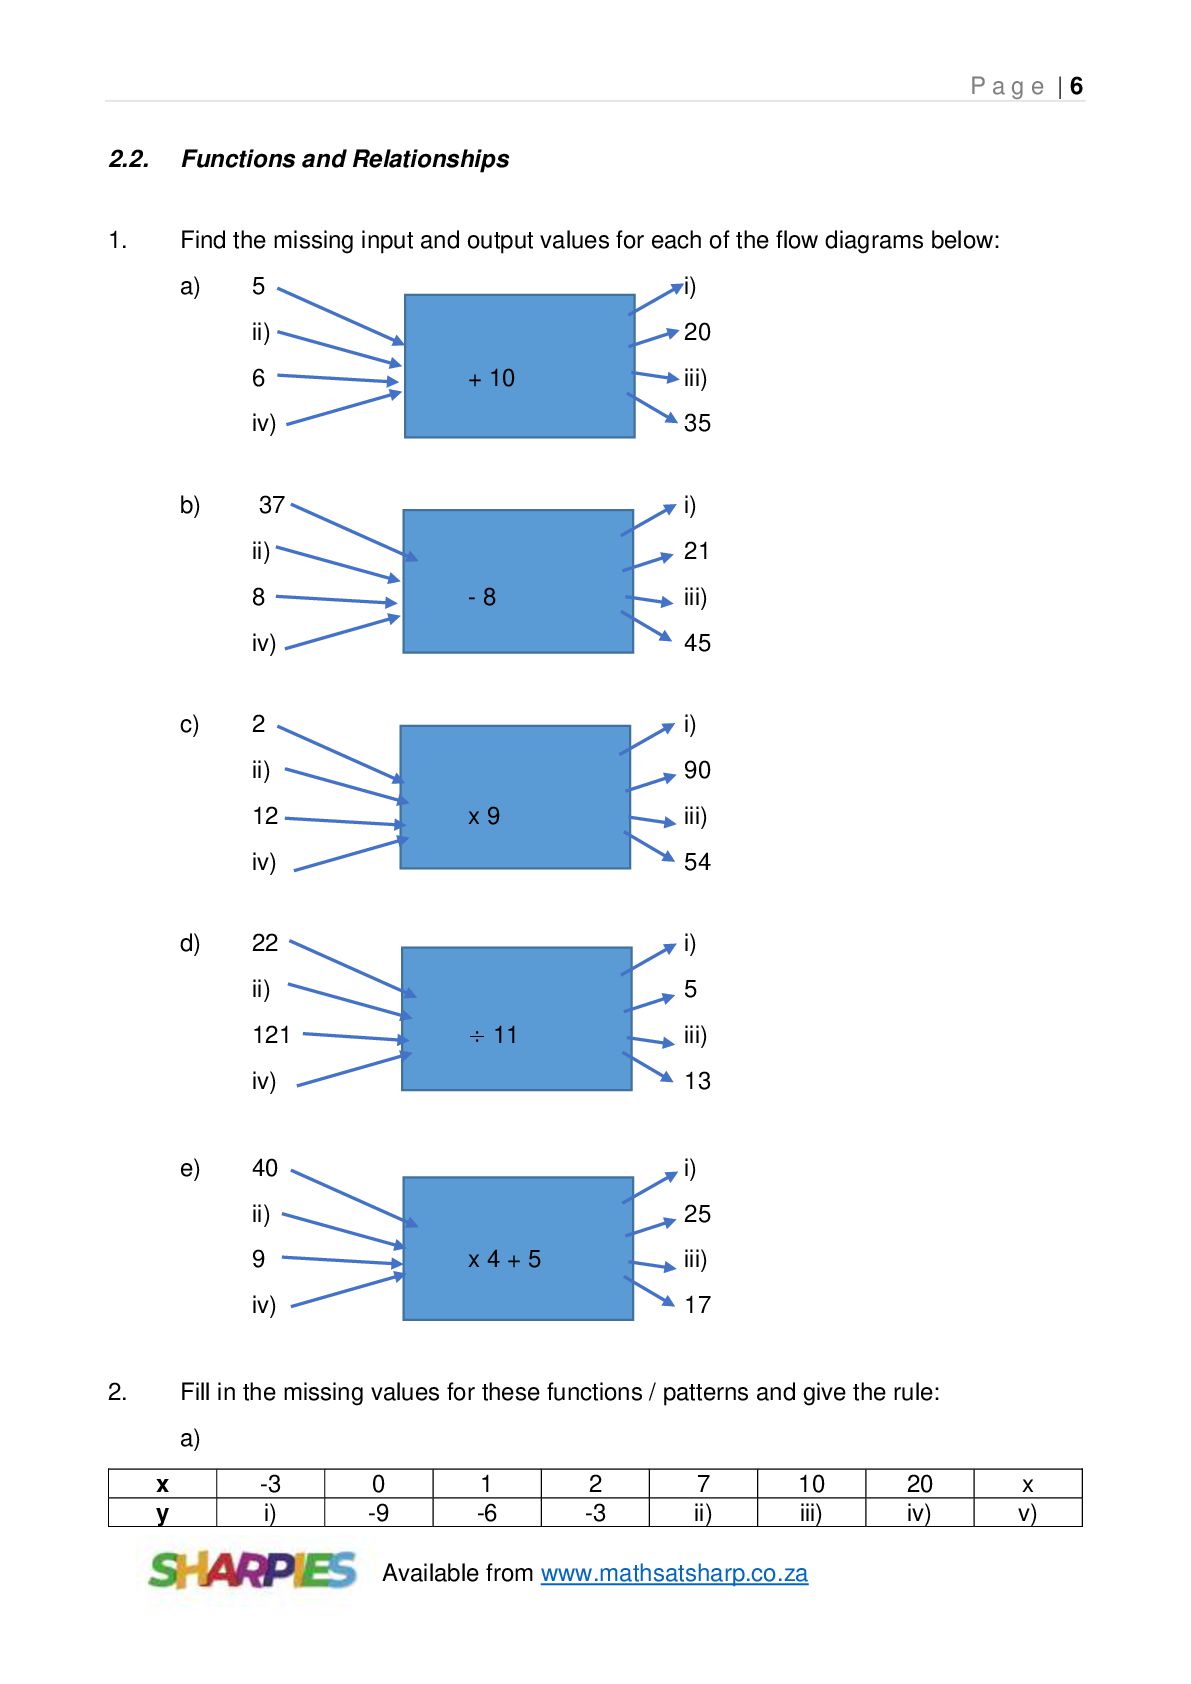
input and output values for each of the flow diagrams below: a) 5 i) ii) 20 6 b) + 10 iv) 35 37 i) ii) 21 8 c) -8 45 2 i) ii) 90 x9 iii) iv) 54 22 i) ii) 5 ÷ 11 121 e) iii) iv) 12 d) iii) iii) iv) 13 40 i) ii) 25 9 x4+5 iii) iv) 2. 17 Fill in the missing values for these functions / patterns and give the rule: a) x y -3 i) 0 -9 1 -6 2 -3 7 ii) 10 iii) Available from www.mathsatsharp.co.za 20 iv) x v)
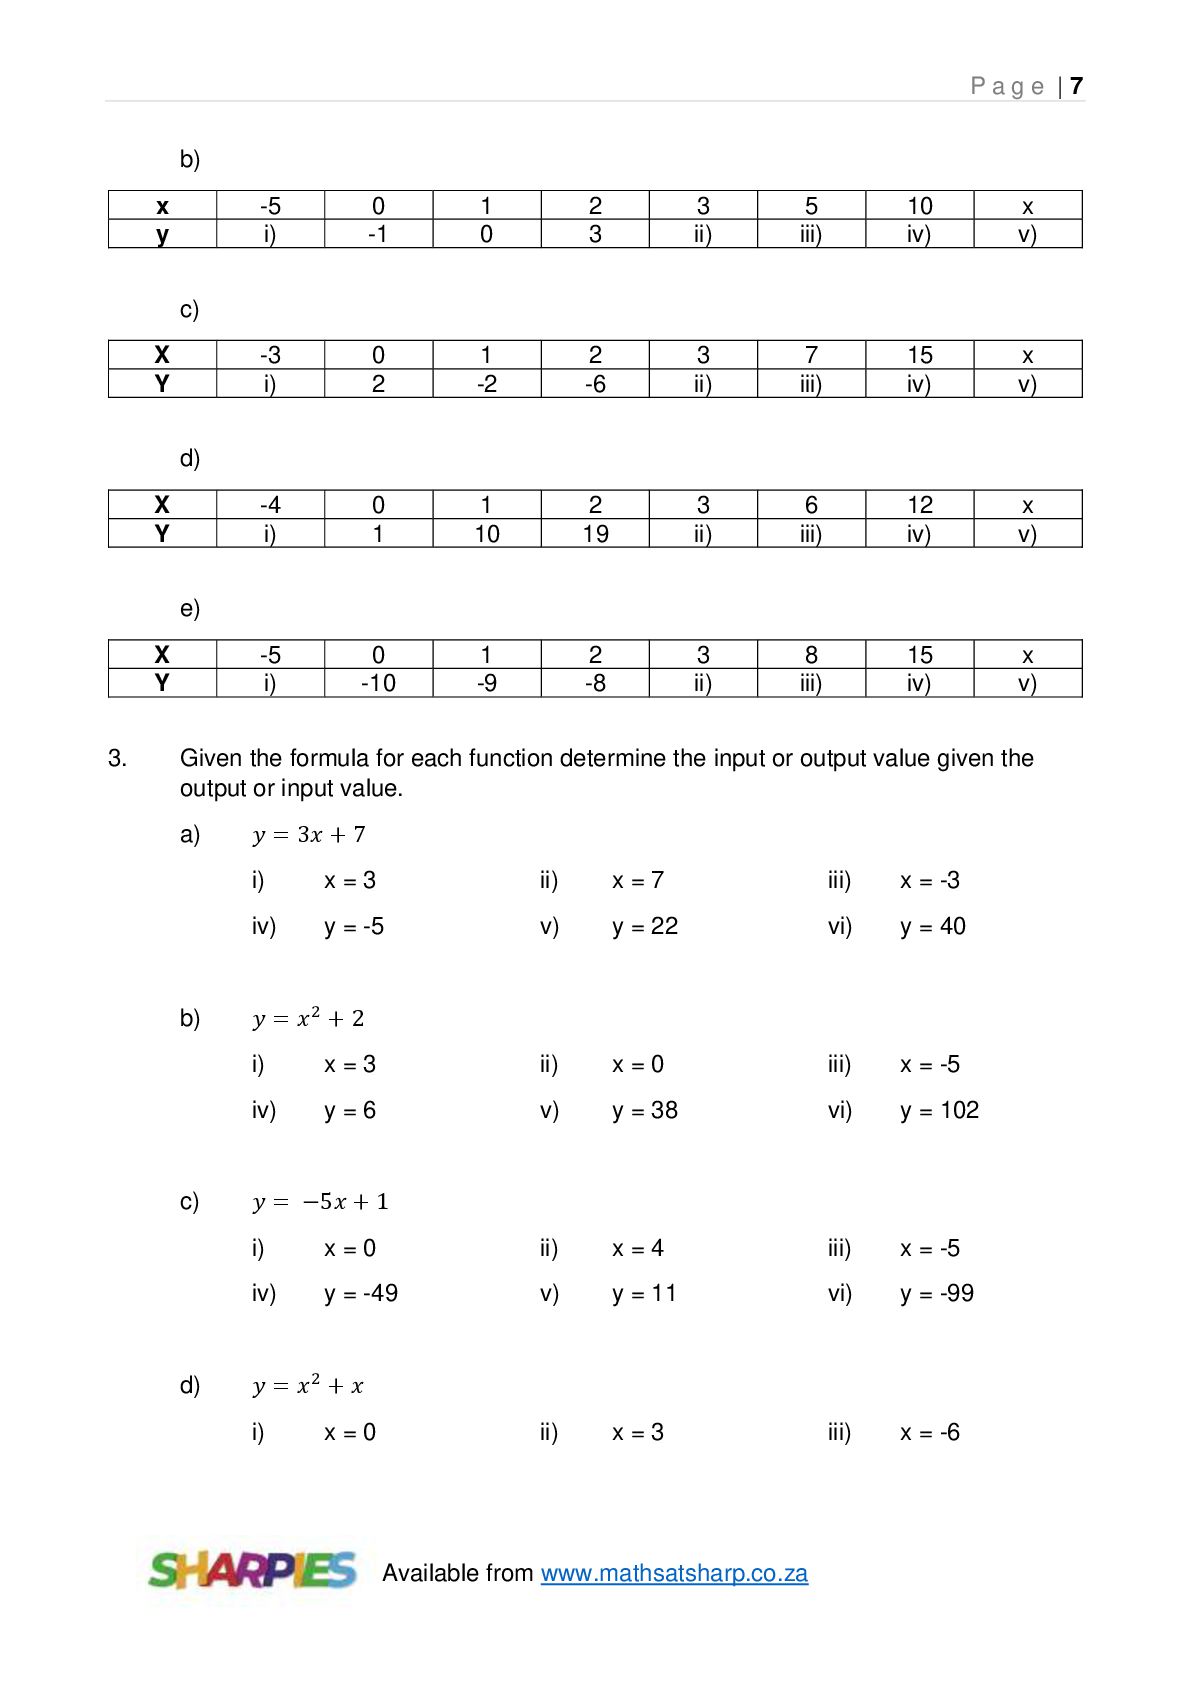
0 2 3 3 ii) 5 iii) 10 iv) x v) -3 i) 0 2 1 -2 2 -6 3 ii) 7 iii) 15 iv) x v) -4 i) 0 1 1 10 2 19 3 ii) 6 iii) 12 iv) x v) -5 i) 0 -10 1 -9 2 -8 3 ii) 8 iii) 15 iv) x v) c) X Y d) X Y e) X Y 3. Given the formula for each function determine the input or output value given the output or input value. a) b) c) d) 𝑦 = 3𝑥 + 7 i) x=3 ii) x=7 iii) x = -3 iv) y = -5 v) y = 22 vi) y = 40 𝑦 = 𝑥2 + 2 i) x=3 ii) x=0 iii) x = -5 iv) y=6 v) y = 38 vi) y = 102 𝑦 = −5𝑥 + 1 i) x=0 ii) x=4 iii) x = -5 iv) y = -49 v) y = 11 vi) y = -99 ii) x=3 iii) x = -6 𝑦 = 𝑥2 + 𝑥 i) x=0 Available from www.mathsatsharp.co.za
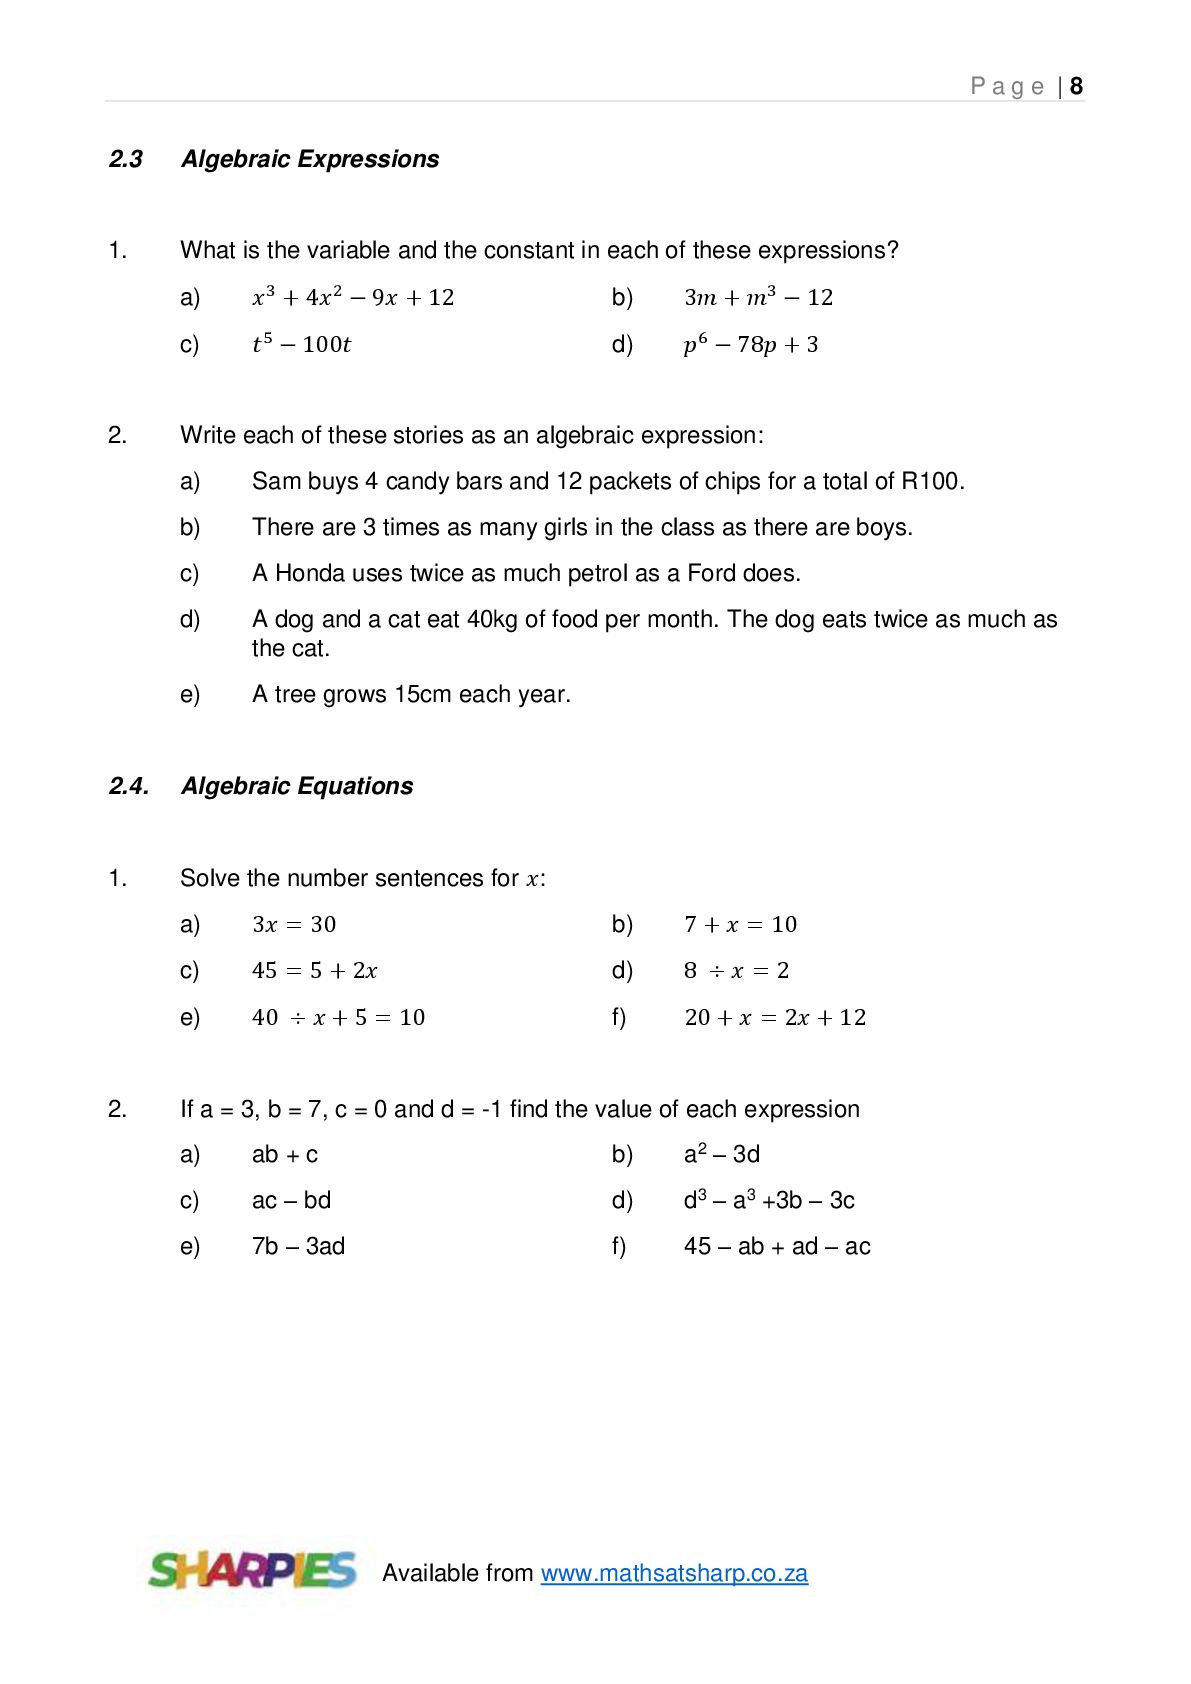
and the constant in each of these expressions? 2. a) 𝑥 3 + 4𝑥 2 − 9𝑥 + 12 b) 3𝑚 + 𝑚3 − 12 c) 𝑡 5 − 100𝑡 d) 𝑝6 − 78𝑝 + 3 Write each of these stories as an algebraic expression: a) Sam buys 4 candy bars and 12 packets of chips for a total of R100. b) There are 3 times as many girls in the class as there are boys. c) A Honda uses twice as much petrol as a Ford does. d) A dog and a cat eat 40kg of food per month. The dog eats twice as much as the cat. e) A tree grows 15cm each year. 2.4. Algebraic Equations 1. Solve the number sentences for 𝑥: 2. a) 3𝑥 = 30 b) 7 + 𝑥 = 10 c) 45 = 5 + 2𝑥 d) 8 ÷𝑥 =2 e) 40 ÷ 𝑥 + 5 = 10 f) 20 + 𝑥 = 2𝑥 + 12 If a = 3, b = 7, c = 0 and d = -1 find the value of each expression a) ab + c b) a2 – 3d c) ac – bd d) d3 – a3 +3b – 3c e) 7b – 3ad f) 45 – ab + ad – ac Available from www.mathsatsharp.co.za
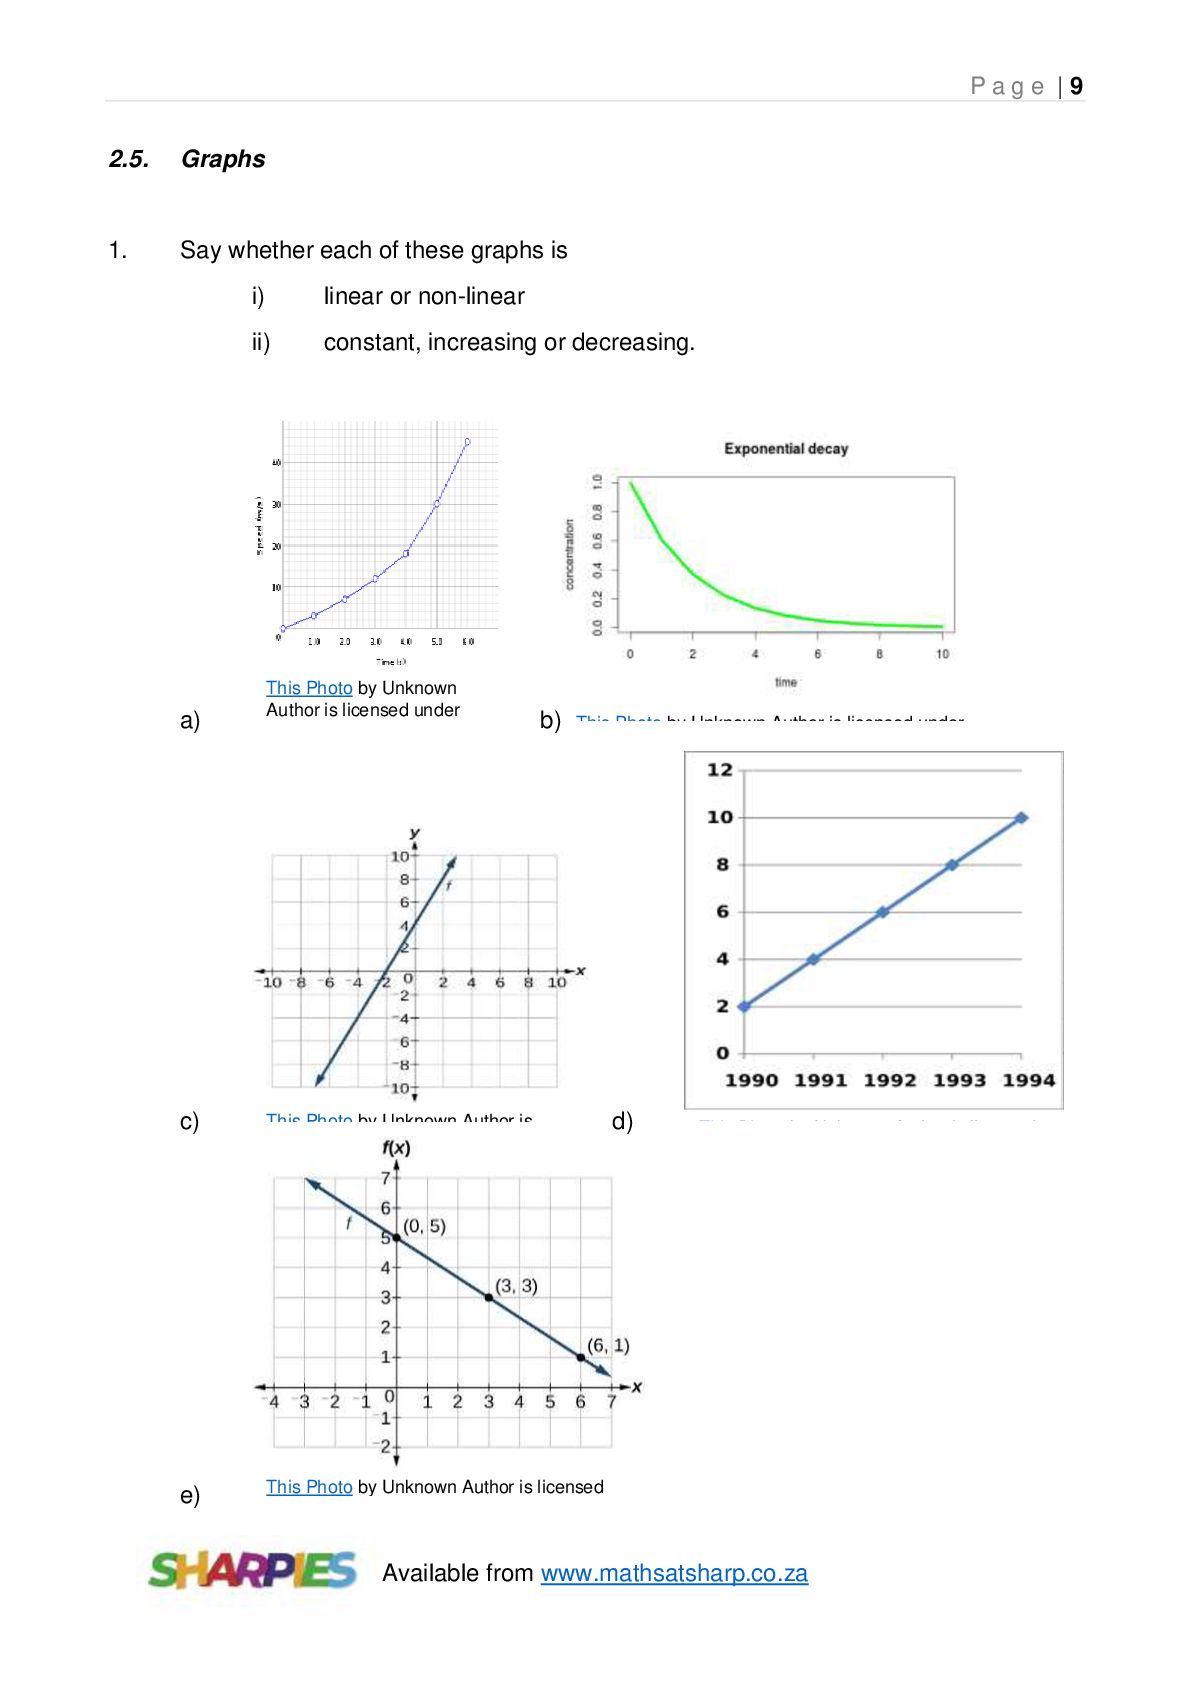
graphs is a) i) linear or non-linear ii) constant, increasing or decreasing. This Photo by Unknown Author is licensed under CC BY-SA b) This Photo by Unknown Author is licensed under c) This Photo by Unknown Author is e) This Photo by Unknown Author is licensed under CC BY d) This Photo by Unknown Author is licensed Available from www.mathsatsharp.co.za
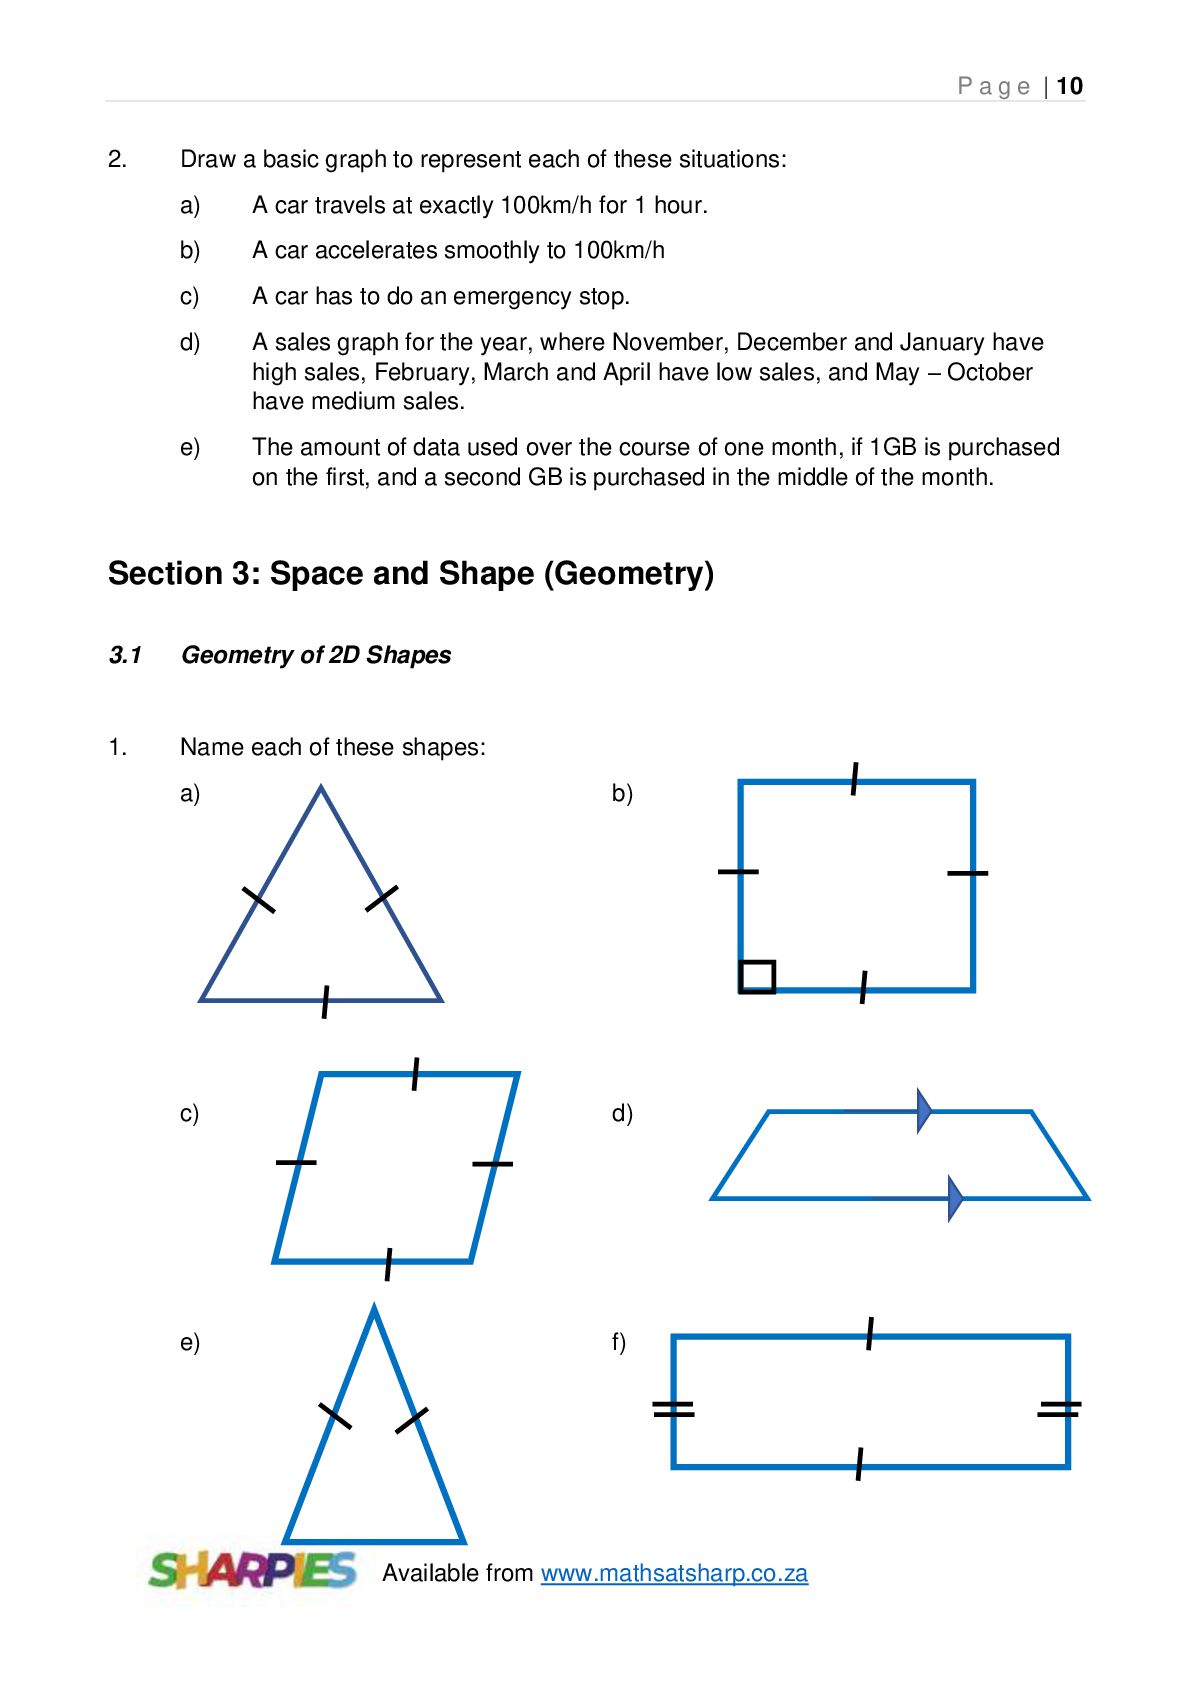
graph to represent each of these situations: a) A car travels at exactly 100km/h for 1 hour. b) A car accelerates smoothly to 100km/h c) A car has to do an emergency stop. d) A sales graph for the year, where November, December and January have high sales, February, March and April have low sales, and May – October have medium sales. e) The amount of data used over the course of one month, if 1GB is purchased on the first, and a second GB is purchased in the middle of the month. Section 3: Space and Shape (Geometry) 3.1 Geometry of 2D Shapes 1. Name each of these shapes: a) b) c) d) e) f) Available from www.mathsatsharp.co.za
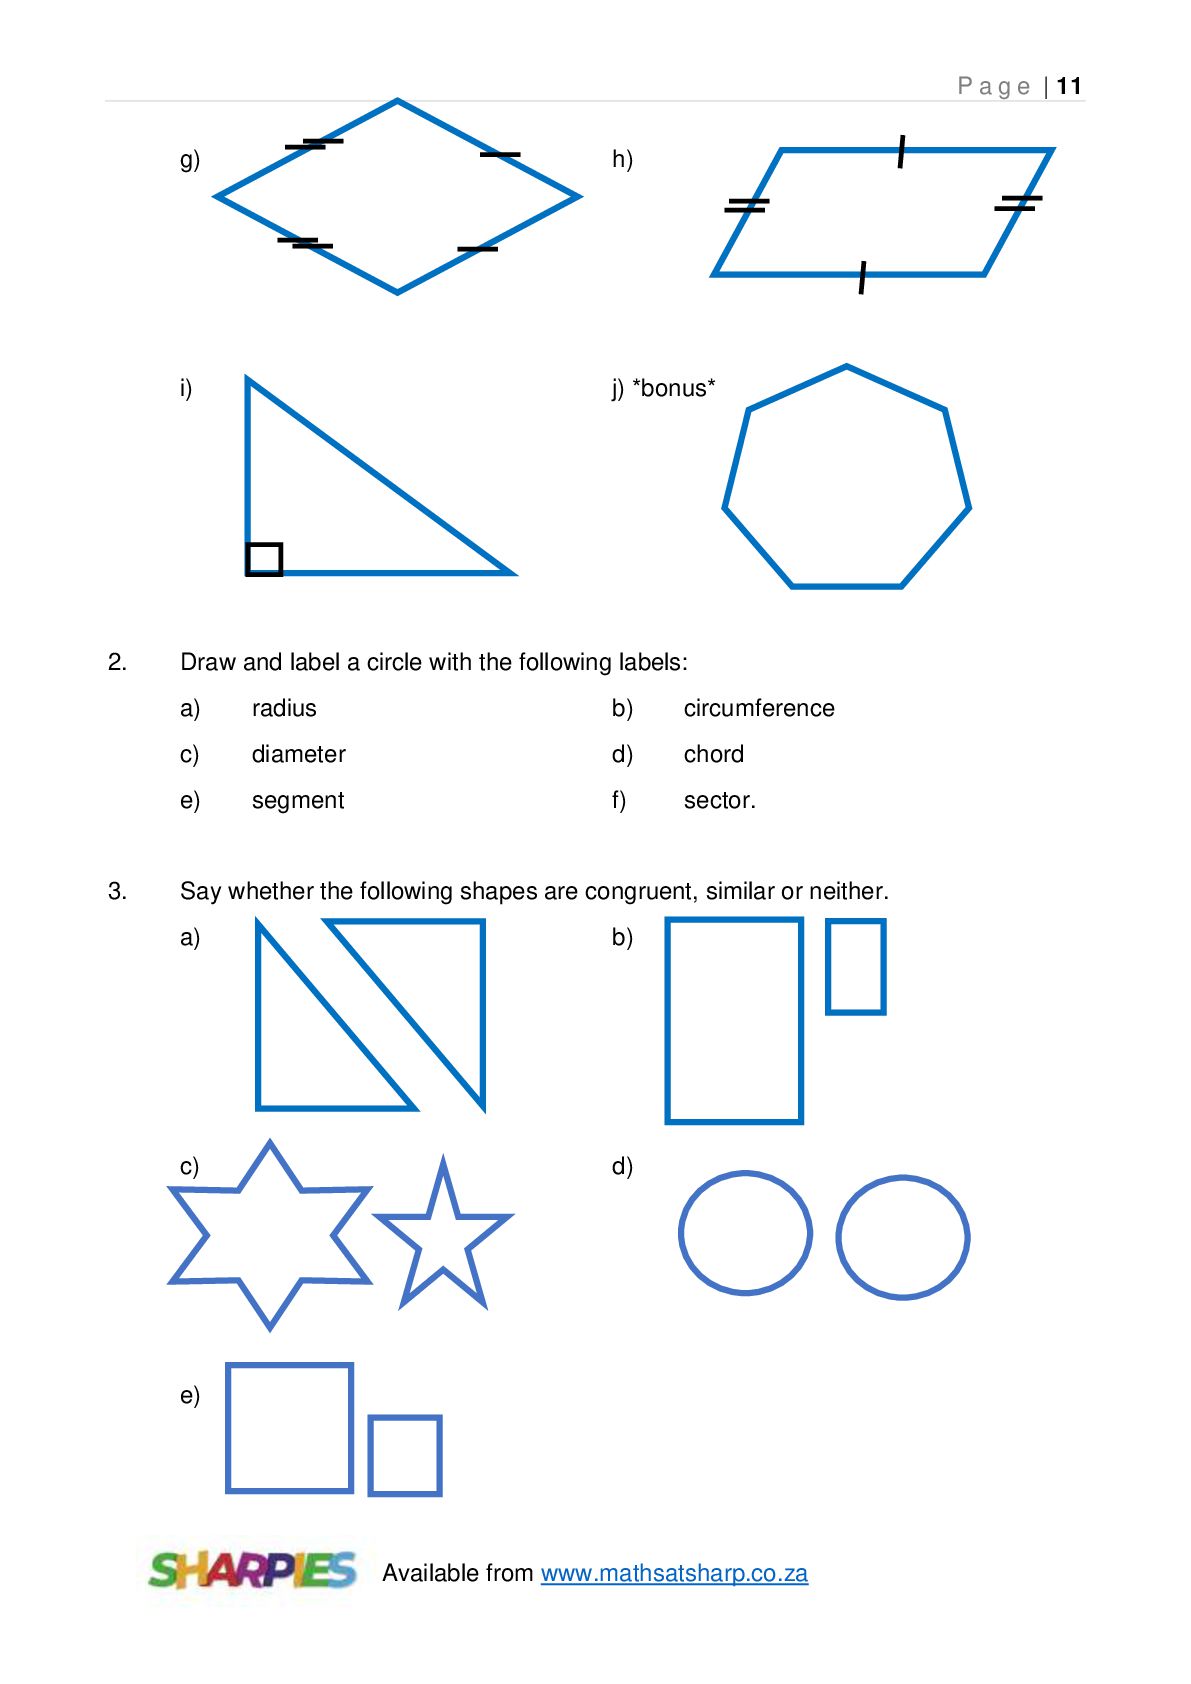
i) j) *bonus* Draw and label a circle with the following labels: a) radius b) circumference c) diameter d) chord e) segment f) sector. Say whether the following shapes are congruent, similar or neither. a) b) c) d) e) Available from www.mathsatsharp.co.za
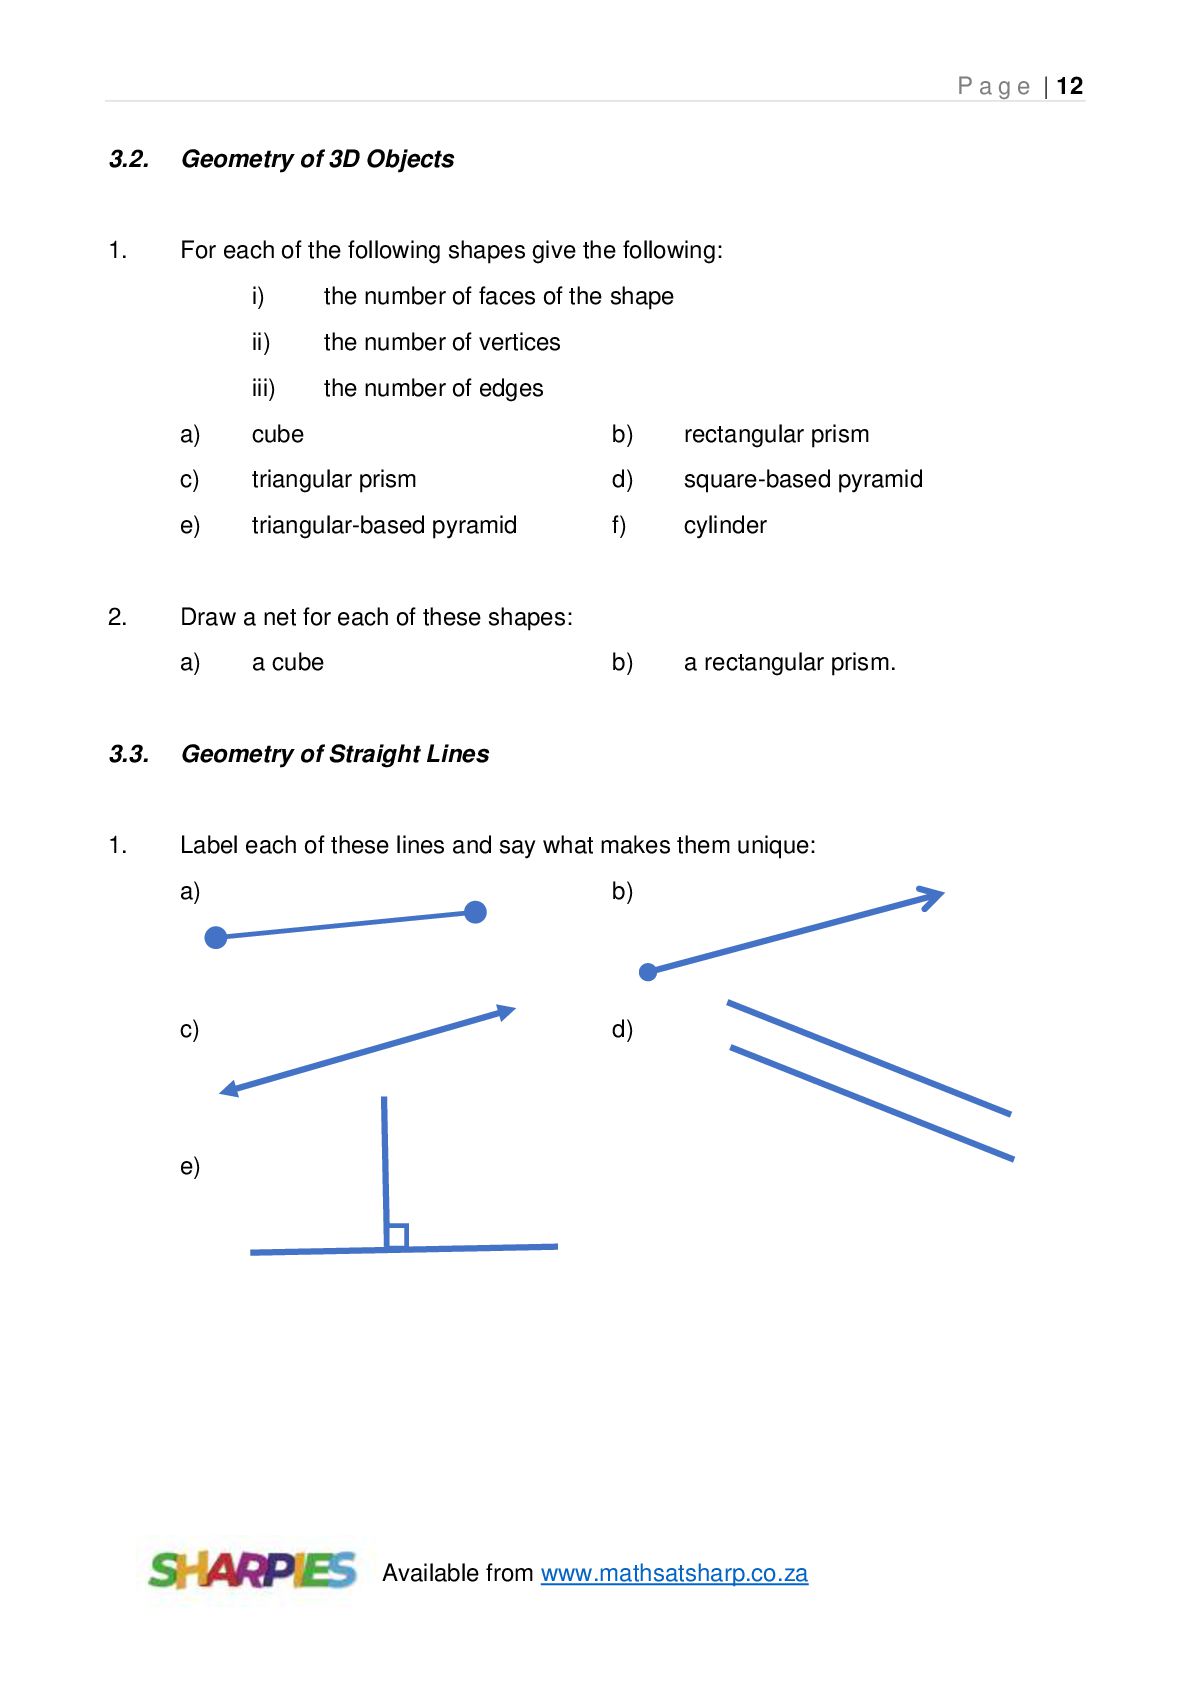
Objects 1. For each of the following shapes give the following: 2. i) the number of faces of the shape ii) the number of vertices iii) the number of edges a) cube b) rectangular prism c) triangular prism d) square-based pyramid e) triangular-based pyramid f) cylinder b) a rectangular prism. Draw a net for each of these shapes: a) a cube 3.3. Geometry of Straight Lines 1. Label each of these lines and say what makes them unique: a) b) c) d) e) Available from www.mathsatsharp.co.za
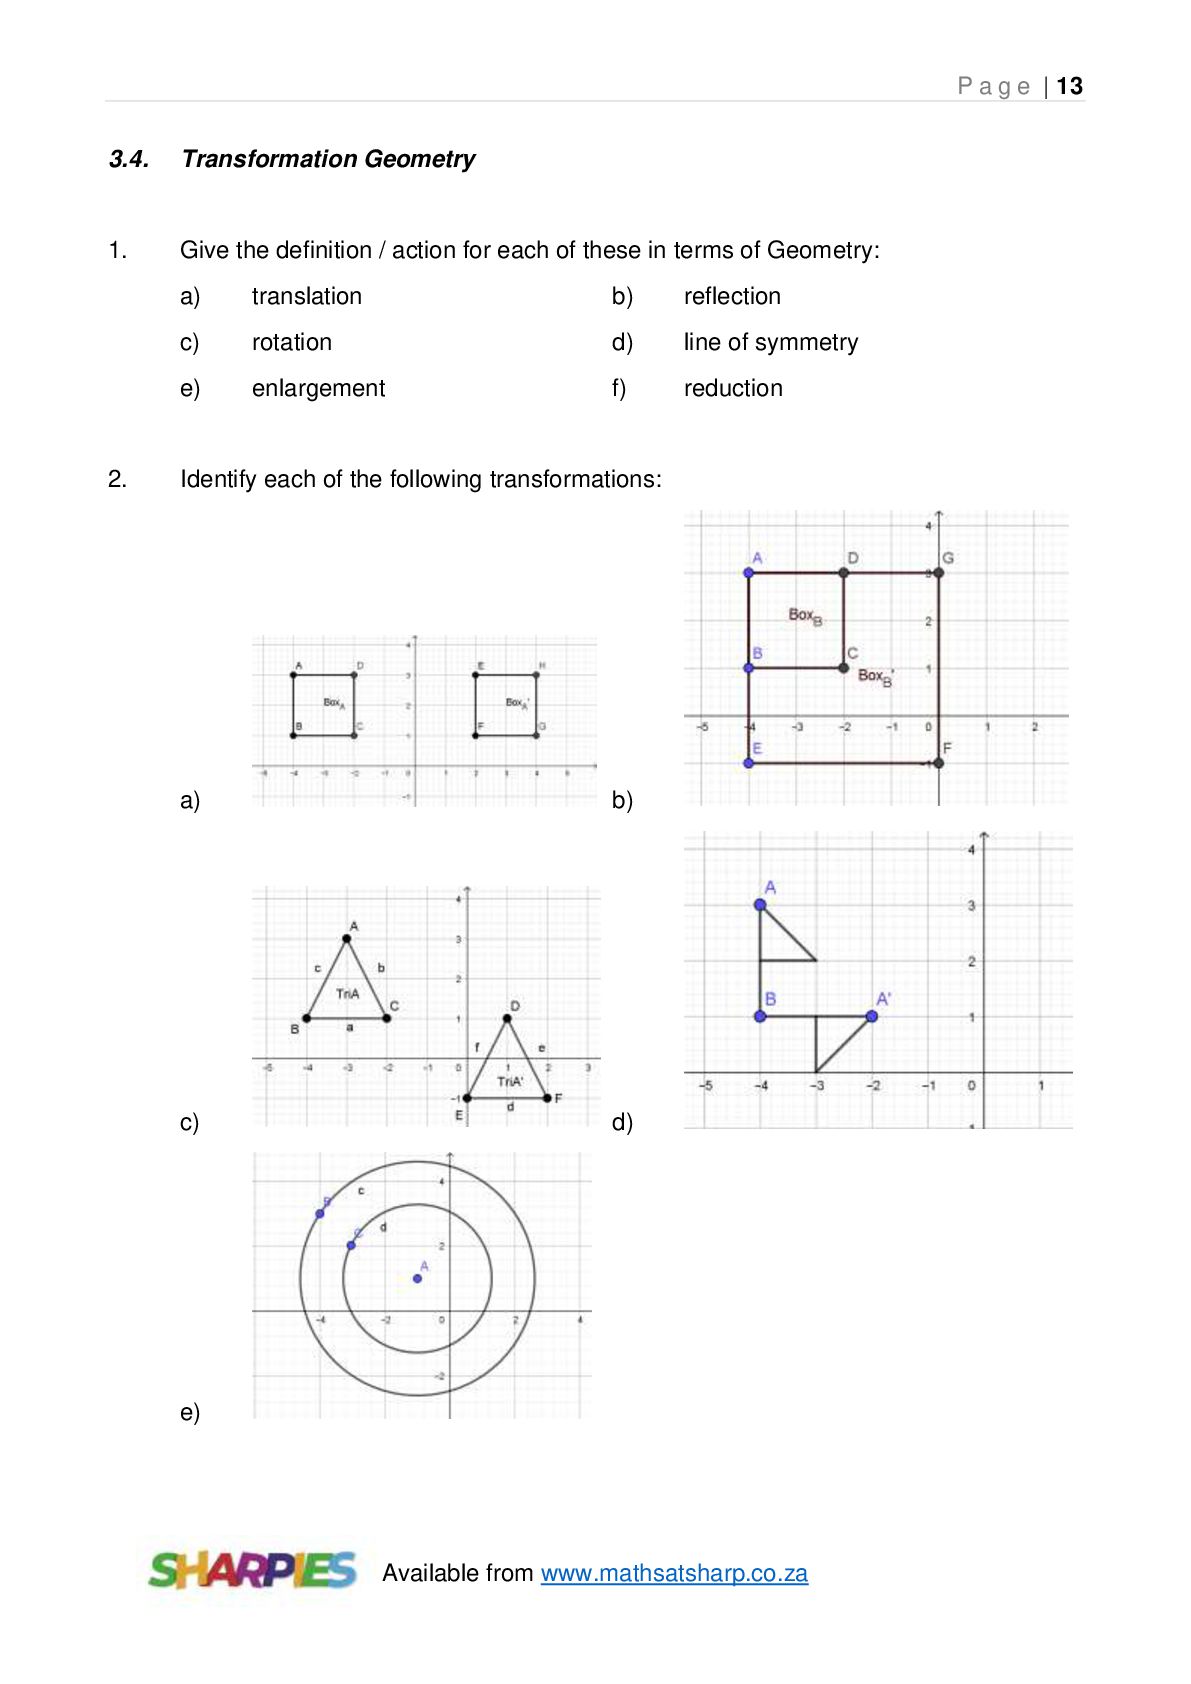
Give the definition / action for each of these in terms of Geometry: 2. a) translation b) reflection c) rotation d) line of symmetry e) enlargement f) reduction Identify each of the following transformations: a) b) c) d) e) Available from www.mathsatsharp.co.za
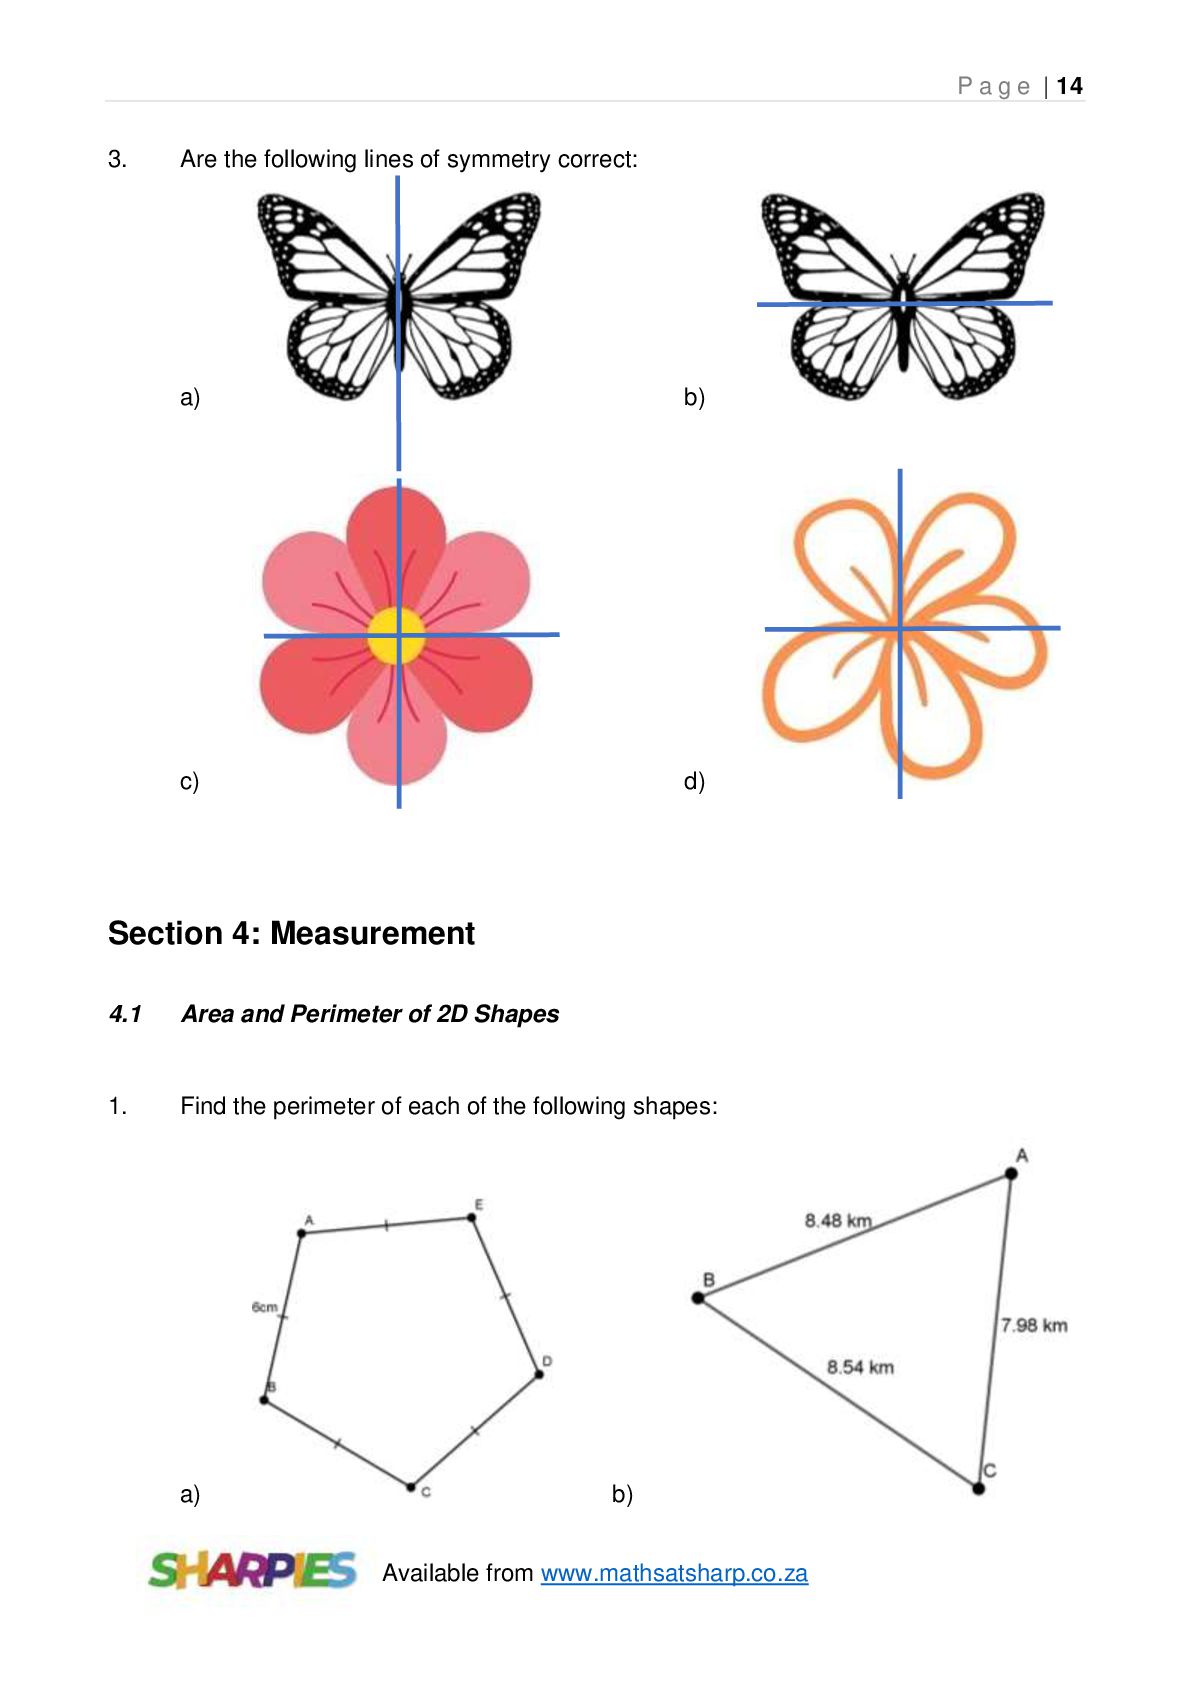
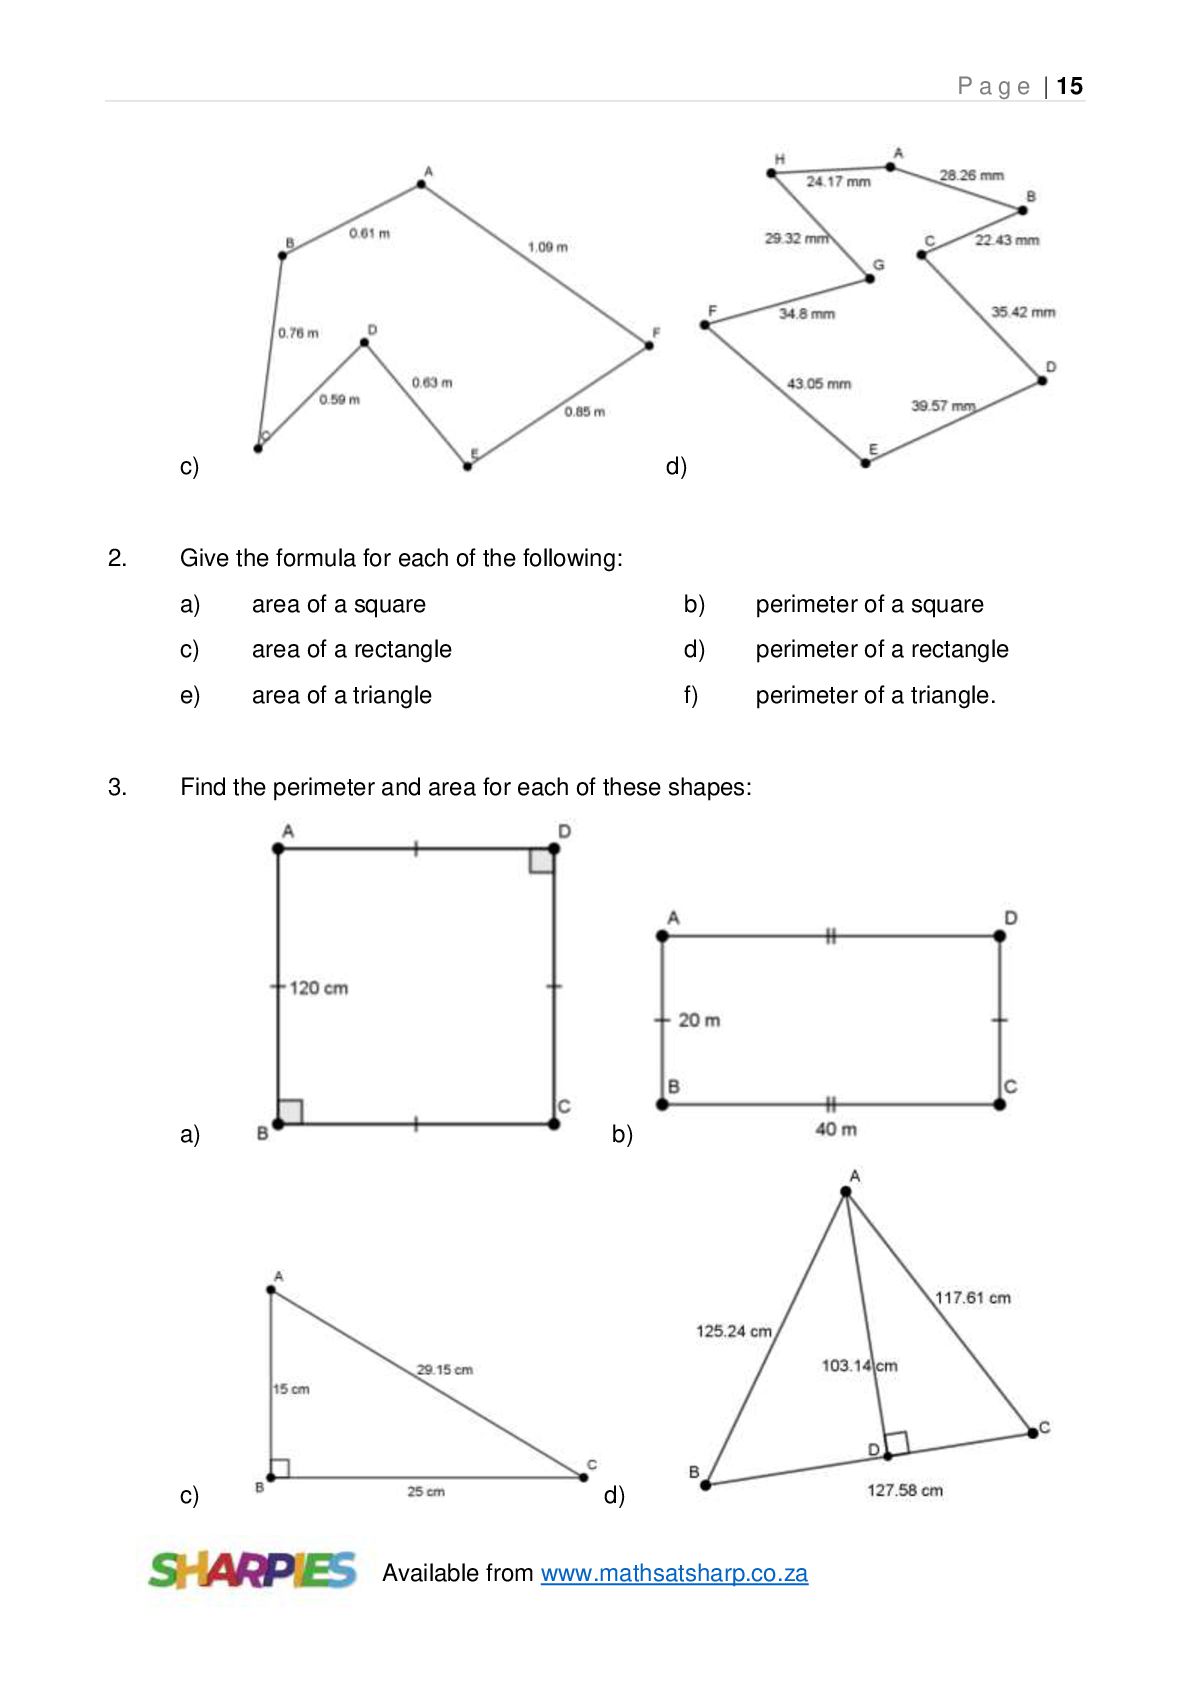
lines of symmetry correct: a) b) c) d) Section 4: Measurement 4.1 Area and Perimeter of 2D Shapes 1. Find the perimeter of each of the following shapes: a) b) Available from www.mathsatsharp.co.za
Give the formula for each of the following: a) area of a square b) perimeter of a square c) area of a rectangle d) perimeter of a rectangle e) area of a triangle f) perimeter of a triangle. Find the perimeter and area for each of these shapes: a) b) c) d) Available from www.mathsatsharp.co.za
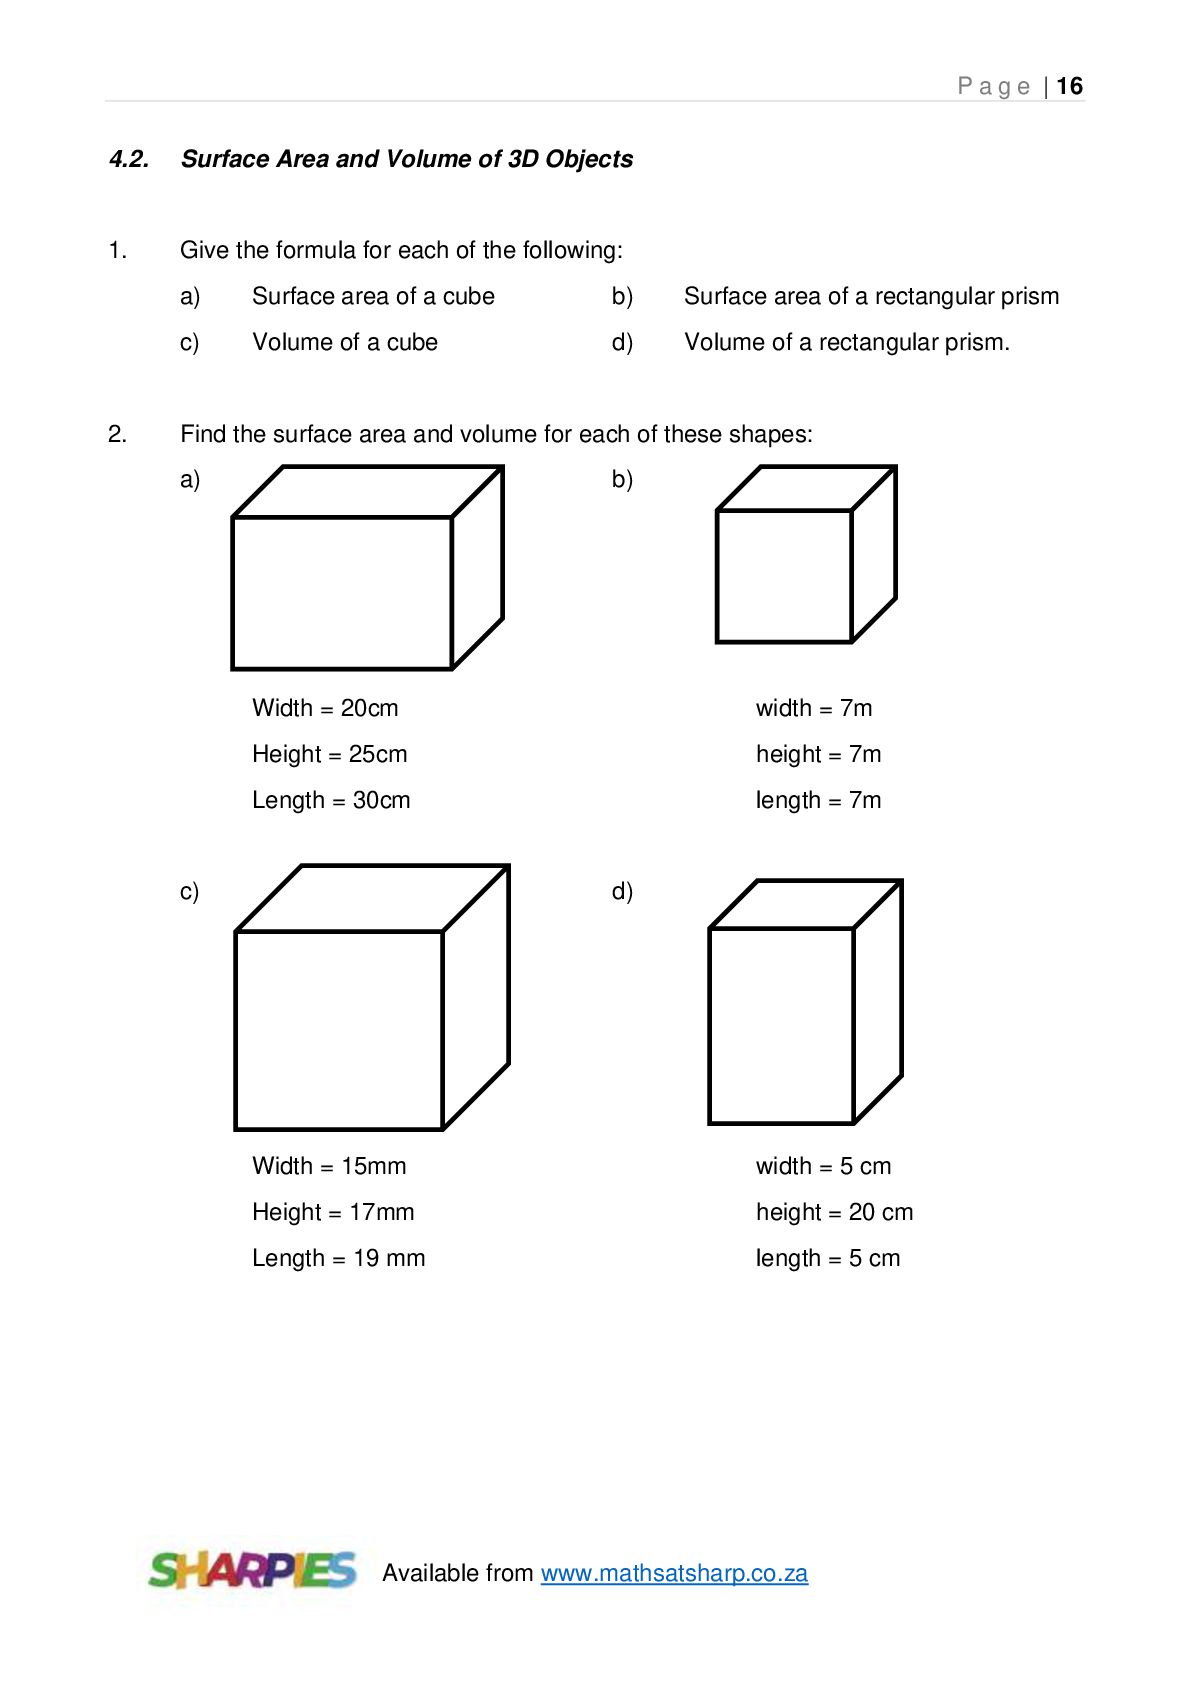
Volume of 3D Objects 1. Give the formula for each of the following: 2. a) Surface area of a cube b) Surface area of a rectangular prism c) Volume of a cube d) Volume of a rectangular prism. Find the surface area and volume for each of these shapes: a) b) Width = 20cm width = 7m Height = 25cm height = 7m Length = 30cm length = 7m c) d) w Width = 15mm width = 5 cm Height = 17mm height = 20 cm Length = 19 mm length = 5 cm Available from www.mathsatsharp.co.za
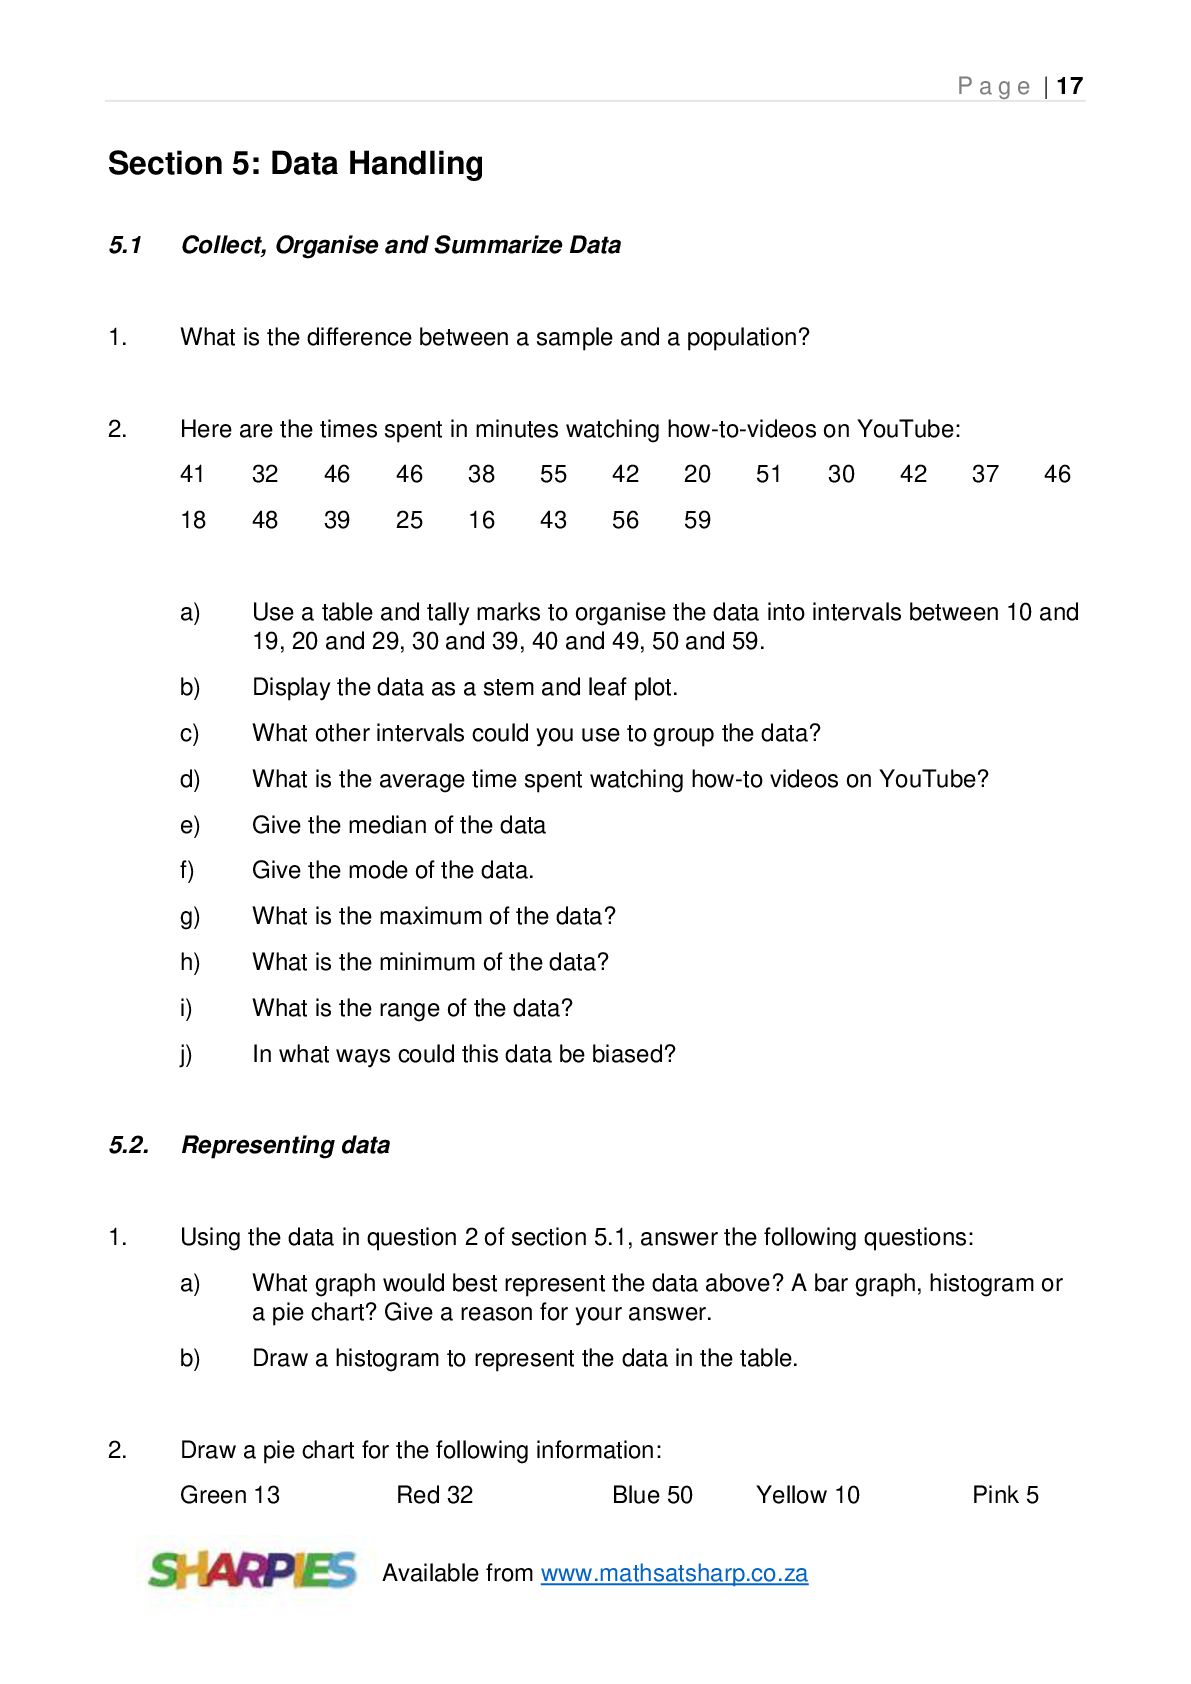
5.1 Collect, Organise and Summarize Data 1. What is the difference between a sample and a population? 2. Here are the times spent in minutes watching how-to-videos on YouTube: 41 32 46 46 38 55 42 20 51 30 42 37 18 48 39 25 16 43 56 59 a) Use a table and tally marks to organise the data into intervals between 10 and 19, 20 and 29, 30 and 39, 40 and 49, 50 and 59. b) Display the data as a stem and leaf plot. c) What other intervals could you use to group the data? d) What is the average time spent watching how-to videos on YouTube? e) Give the median of the data f) Give the mode of the data. g) What is the maximum of the data? h) What is the minimum of the data? i) What is the range of the data? j) In what ways could this data be biased? 5.2. Representing data 1. Using the data in question 2 of section 5.1, answer the following questions: 2. 46 a) What graph would best represent the data above? A bar graph, histogram or a pie chart? Give a reason for your answer. b) Draw a histogram to represent the data in the table. Draw a pie chart for the following information: Green 13 Red 32 Blue 50 Yellow 10 Available from www.mathsatsharp.co.za Pink 5
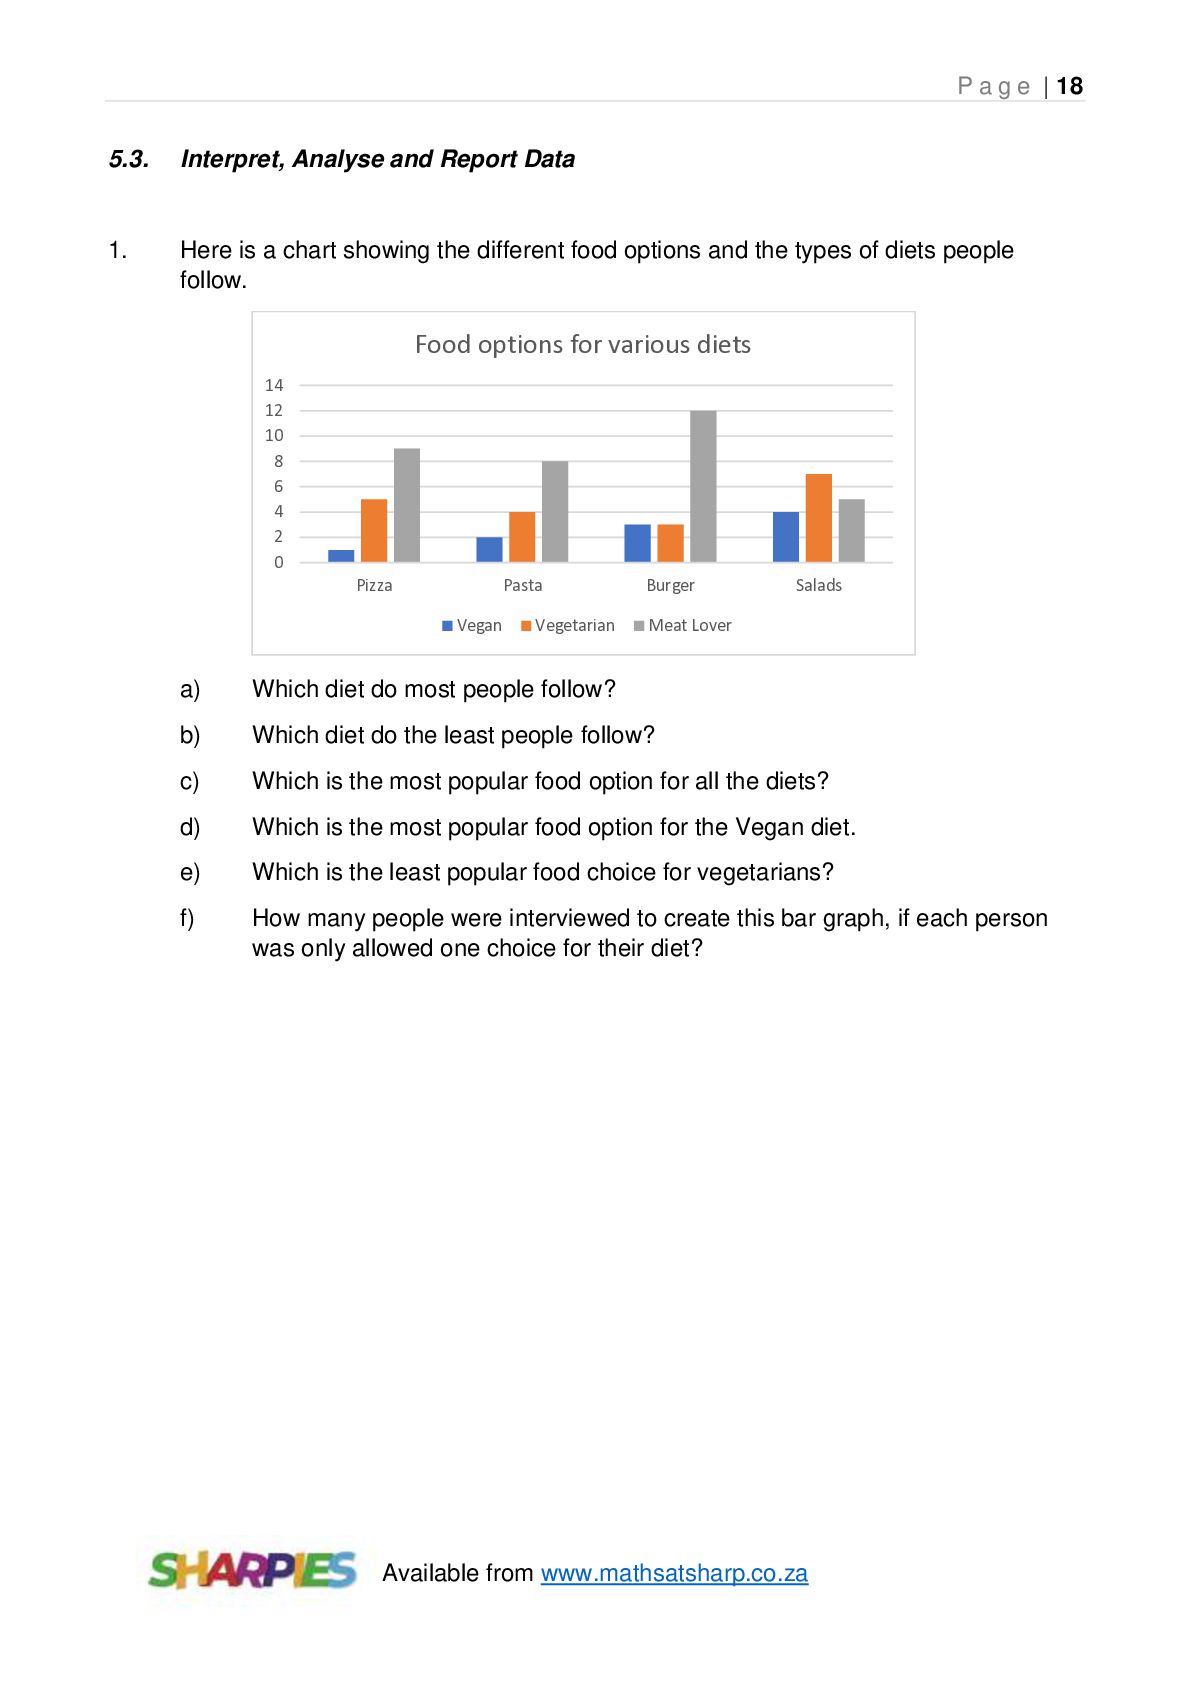
Report Data 1. Here is a chart showing the different food options and the types of diets people follow. Food options for various diets 14 12 10 8 6 4 2 0 Pizza Pasta Vegan Vegetarian Burger Salads Meat Lover a) Which diet do most people follow? b) Which diet do the least people follow? c) Which is the most popular food option for all the diets? d) Which is the most popular food option for the Vegan diet. e) Which is the least popular food choice for vegetarians? f) How many people were interviewed to create this bar graph, if each person was only allowed one choice for their diet? Available from www.mathsatsharp.co.za
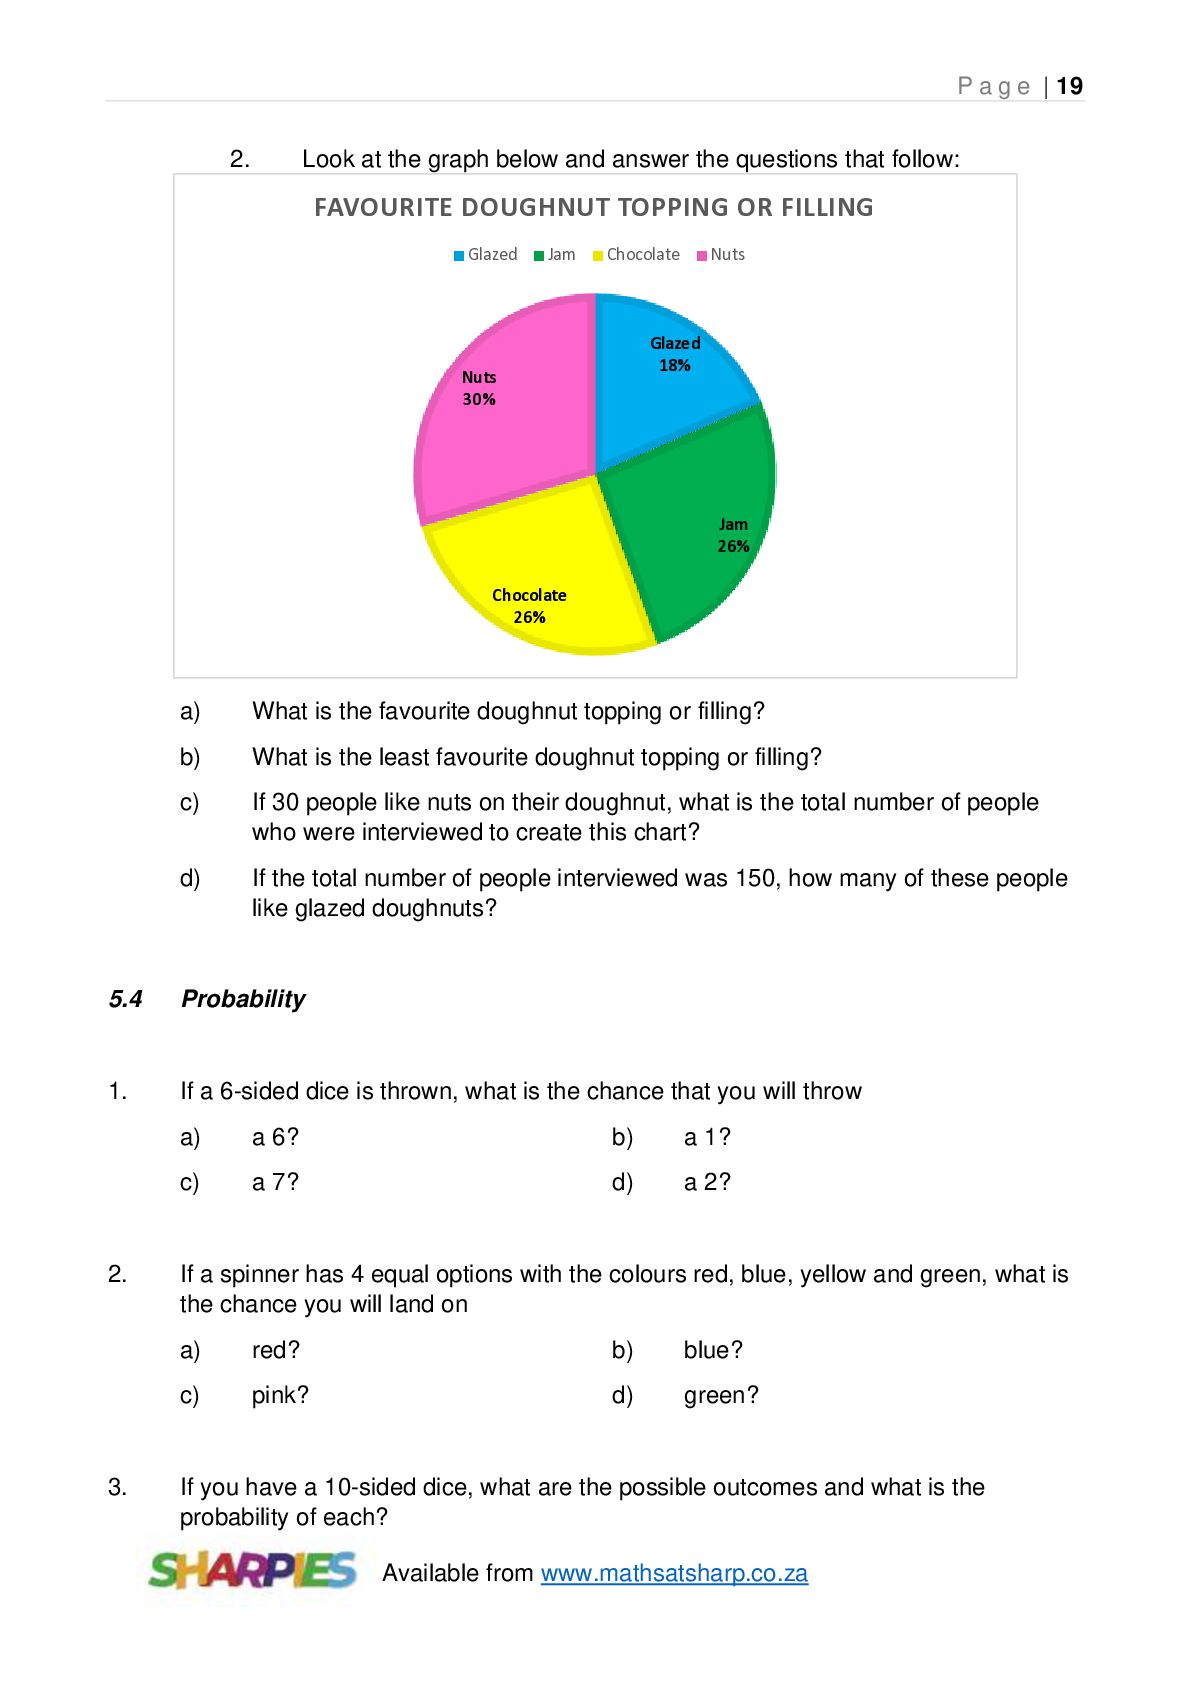
graph below and answer the questions that follow: FAVOURITE DOUGHNUT TOPPING OR FILLING Glazed Jam Chocolate Nuts Glazed 18% Nuts 30% Jam 26% Chocolate 26% a) What is the favourite doughnut topping or filling? b) What is the least favourite doughnut topping or filling? c) If 30 people like nuts on their doughnut, what is the total number of people who were interviewed to create this chart? d) If the total number of people interviewed was 150, how many of these people like glazed doughnuts? 5.4 Probability 1. If a 6-sided dice is thrown, what is the chance that you will throw 2. 3. a) a 6? b) a 1? c) a 7? d) a 2? If a spinner has 4 equal options with the colours red, blue, yellow and green, what is the chance you will land on a) red? b) blue? c) pink? d) green? If you have a 10-sided dice, what are the possible outcomes and what is the probability of each? Available from www.mathsatsharp.co.za


 alisontutors23
 aleyda
 jmmastey
 shpigford
 kevinliebholz
 morganepeng
 mayunak
 soudai
 sergeychernyshev
 lara
lara
 trishagee
 holman