Upgrade to Pro — share decks privately, control downloads, hide ads and more …

Representation of Data

Representation of Data

This is the second batch of questions on Representation of Data. It covers concepts on;
-pie charts
-bar graphs
-line graphs

Avatar for Alison Tutors

Alison Tutors PRO

September 19, 2026

More Decks by Alison Tutors

Other Decks in Education

Transcript

  1. Name: Exam Style Questions Ensure you have: Pencil, pen, ruler,

    protractor, pair of compasses and eraser You may use tracing paper if needed Guidance 1. Read each question carefully before you begin answering it. 2. Donʼt spend too long on one question. 3. Attempt every question. 4. Check your answers seem right. 5. Always show your workings Revision for this topic © CORBETTMATHS 2014
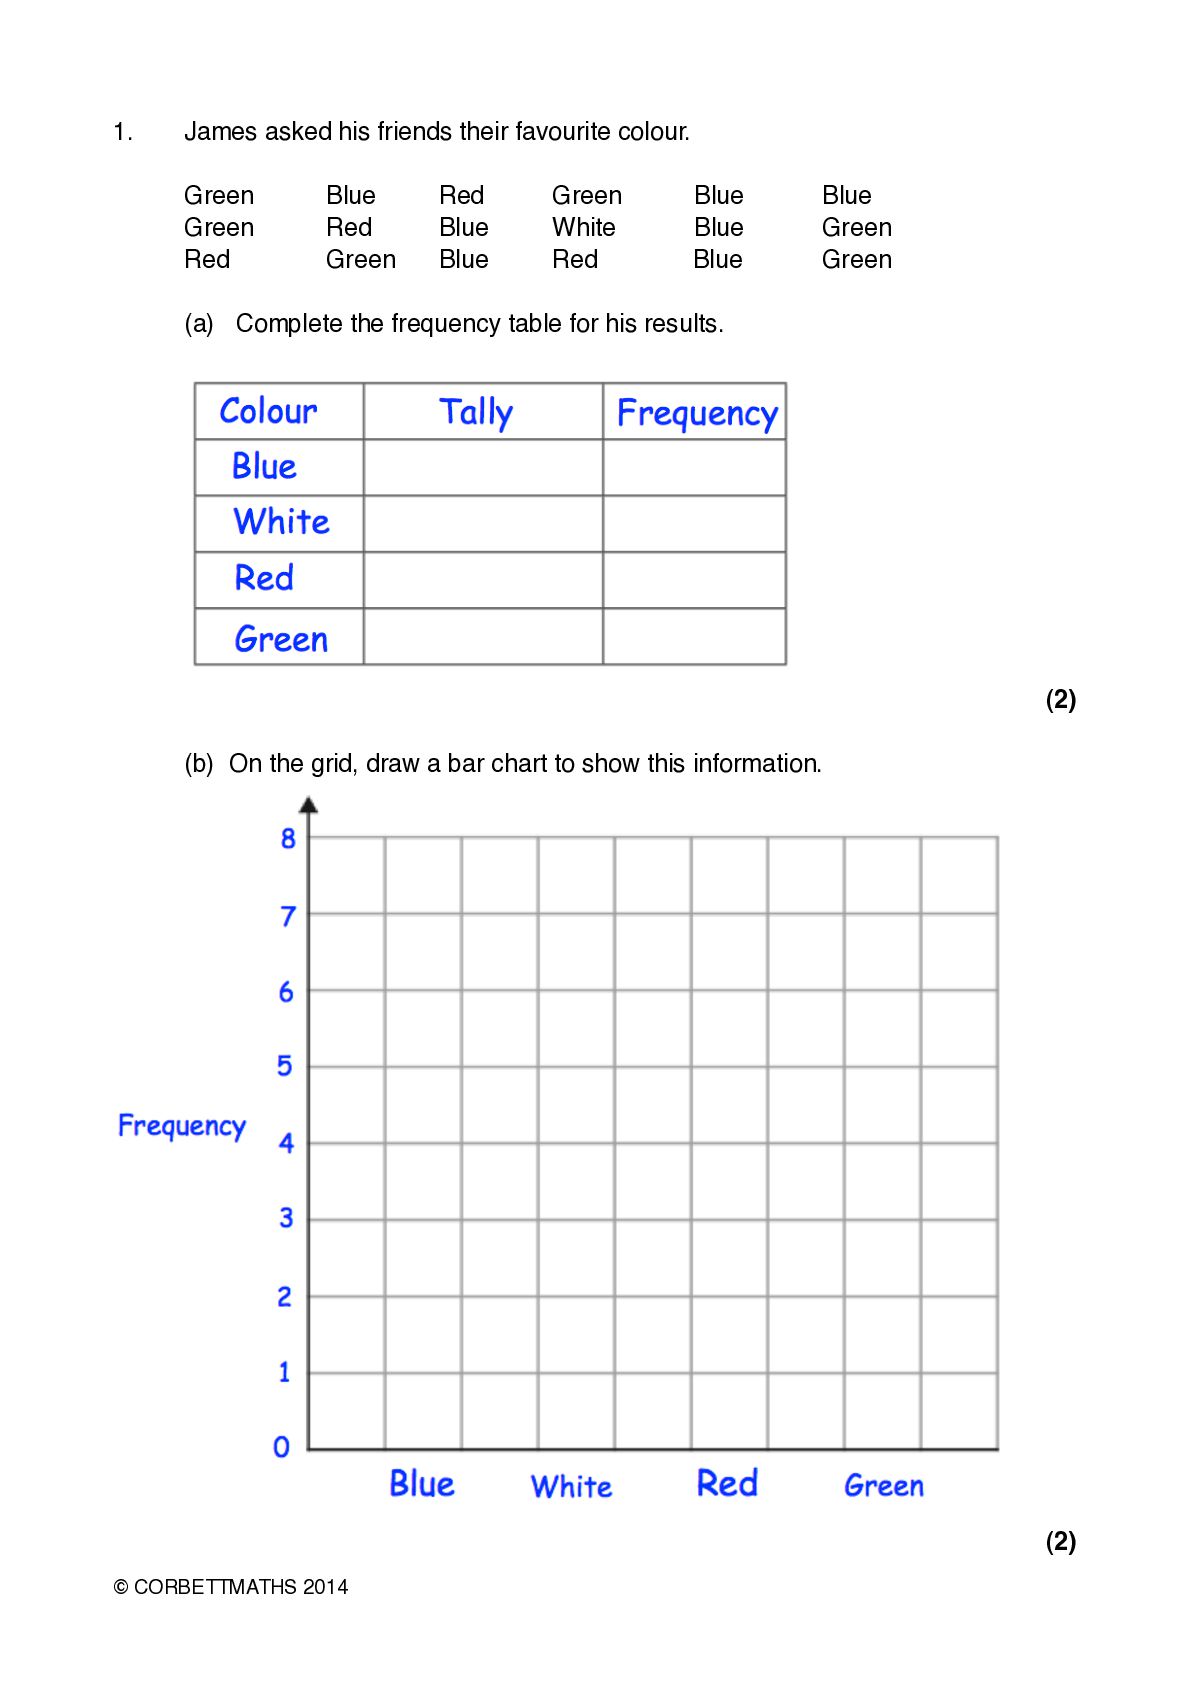
  2. 1.! James asked his friends their favourite colour. ! !

    ! Green!! Green!! Red! ! ! (a) Complete the frequency table for his results. Blue! Red! Green! Red! Blue! Blue! Green! White! Red! Blue!! Blue!! Blue ! Blue Green Green ! (2) ! (b) On the grid, draw a bar chart to show this information. (2) © CORBETTMATHS 2014
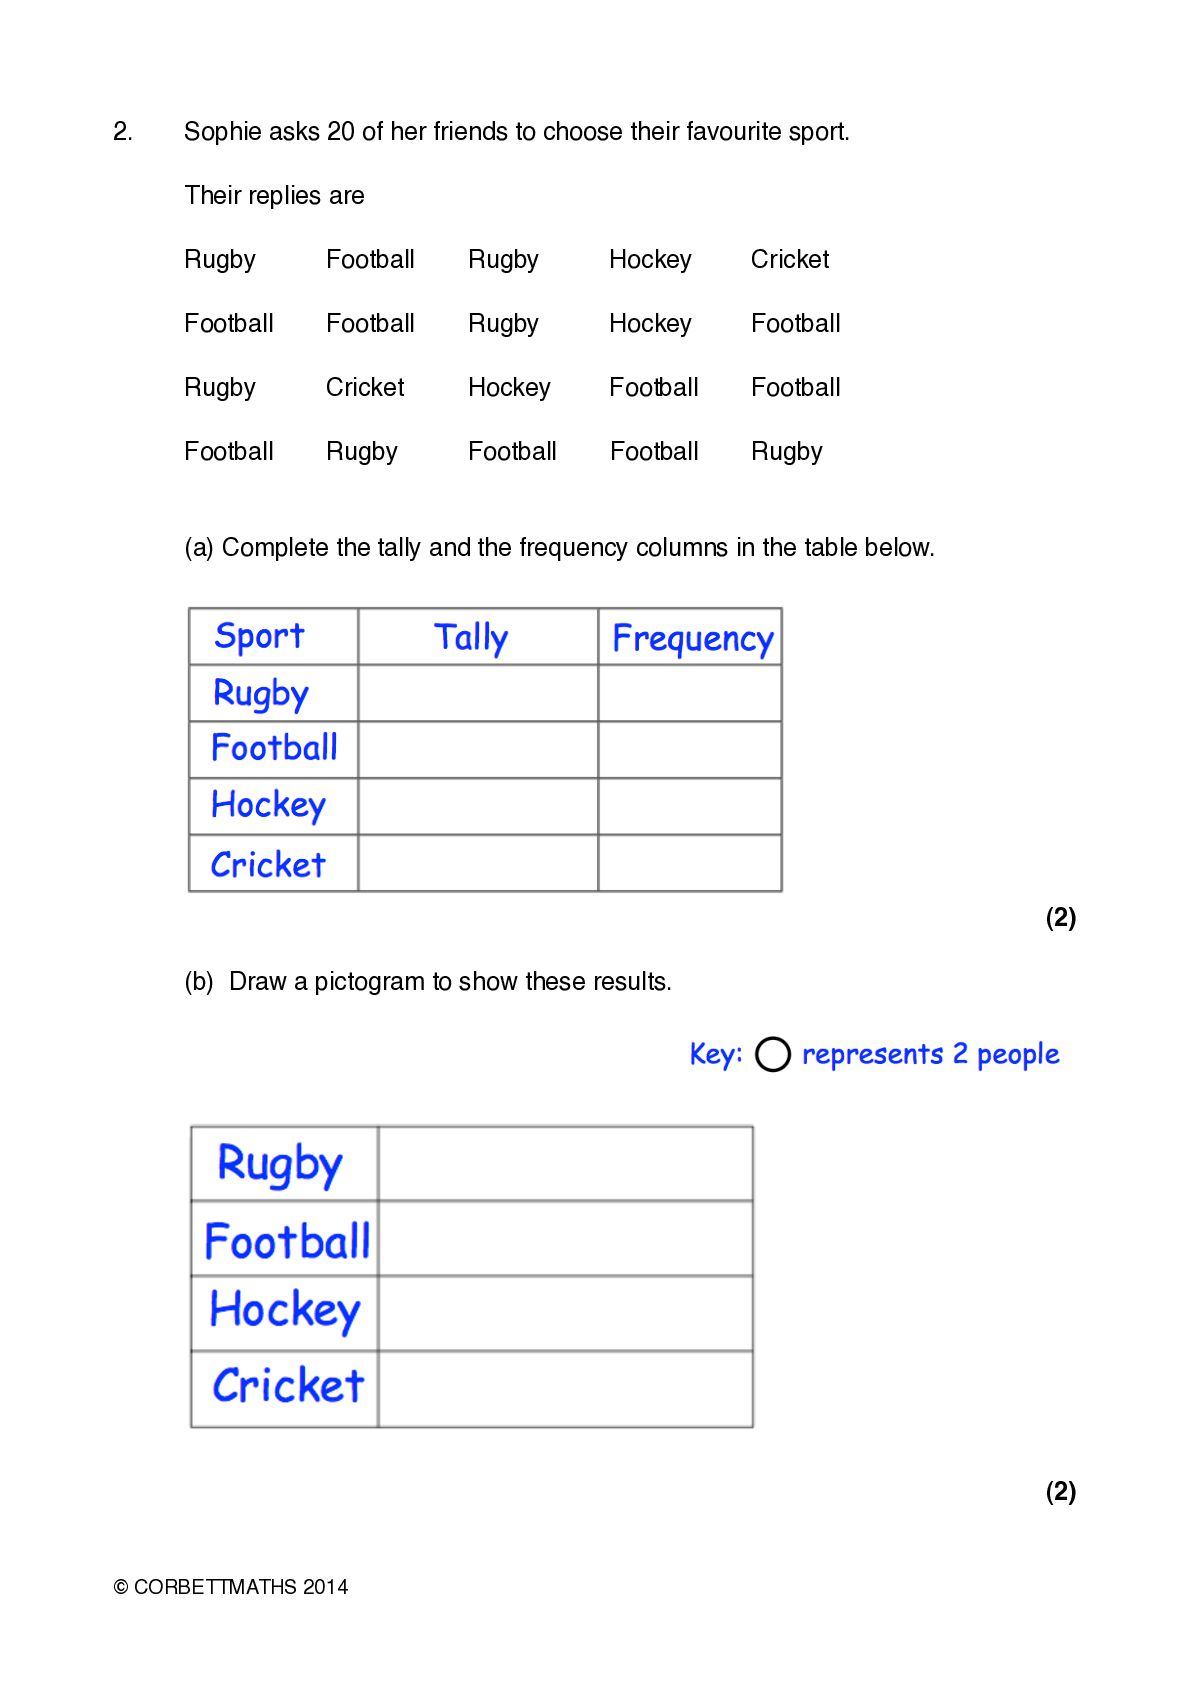
  3. 2.! Sophie asks 20 of her friends to choose their

    favourite sport. ! Their replies are ! ! ! Rugby! Football! Rugby! Hockey! Cricket Football! Football! Rugby! Hockey! Football ! Rugby! Cricket! Hockey! Football! Football ! Football! Rugby! Football! Football! Rugby ! (a) Complete the tally and the frequency columns in the table below. ! (2) ! (b) Draw a pictogram to show these results. ! ! ! ! ! ! ! ! ! (2) © CORBETTMATHS 2014
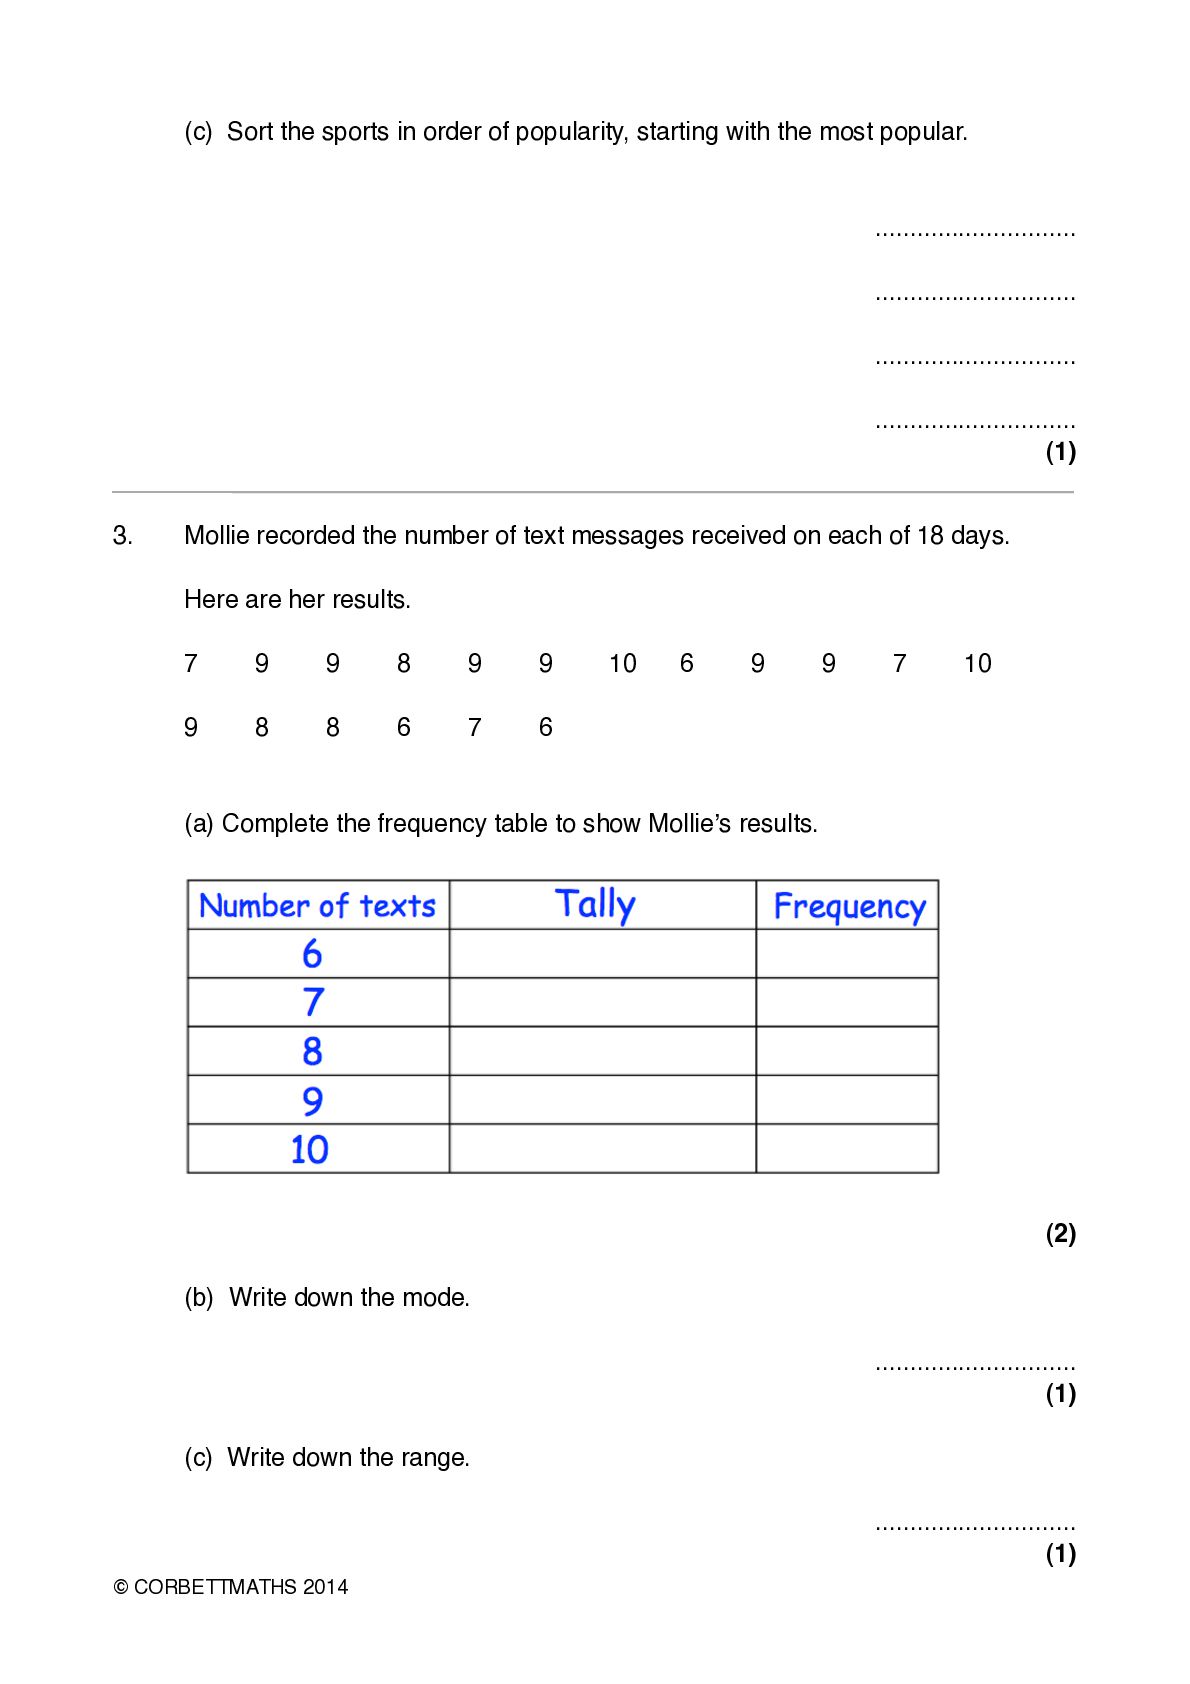
  4. ! (c) Sort the sports in order of popularity, starting

    with the most popular. ............................. ............................. ............................. ............................. (1) 3.! Mollie recorded the number of text messages received on each of 18 days. ! Here are her results. ! 7! 9! 9! 8! 9! 9! ! 9! 8! 8! 6! 7! 6 ! (a) Complete the frequency table to show Mollieʼs results. 10! 6! 9! 9! 7! 10 ! (2) ! (b) Write down the mode. ............................. (1) ! (c) Write down the range. ............................. (1) © CORBETTMATHS 2014
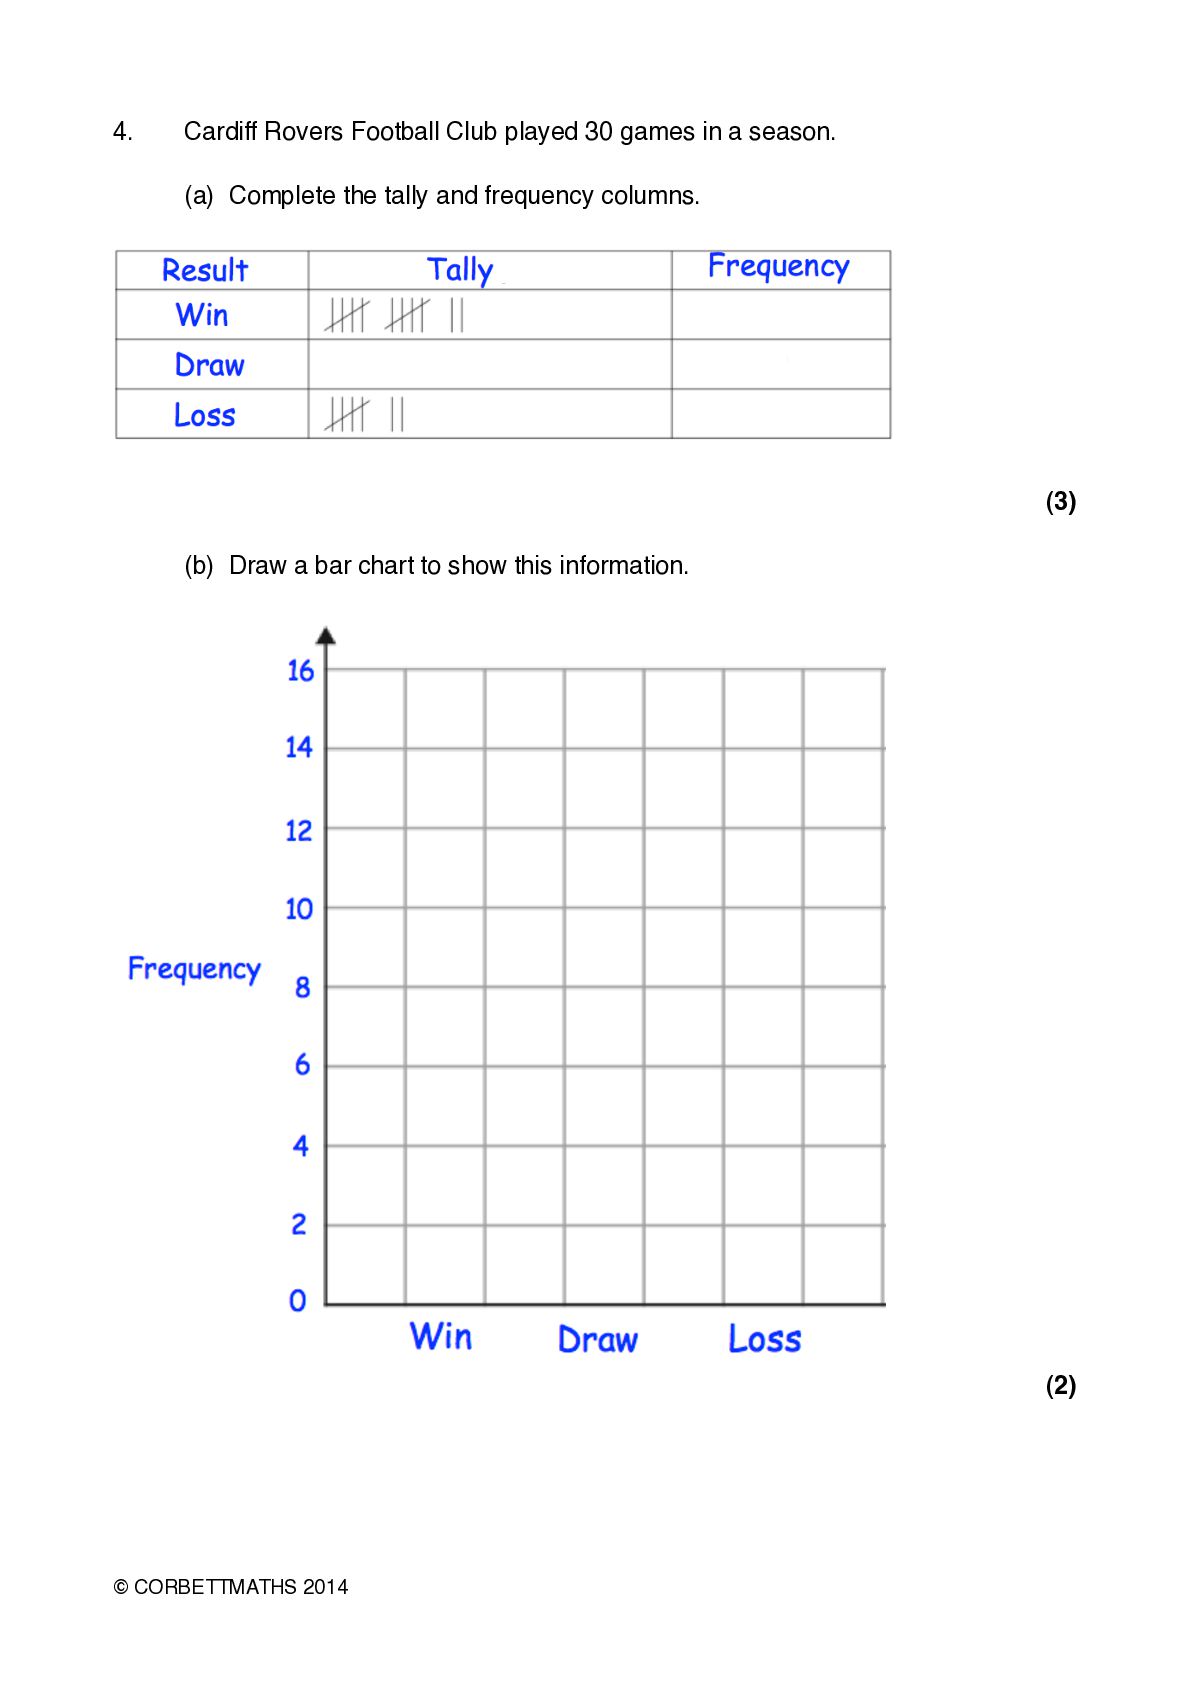
  5. 4.! Cardiff Rovers Football Club played 30 games in a

    season. ! (a) Complete the tally and frequency columns. (3) ! ! (b) Draw a bar chart to show this information. (2) ! © CORBETTMATHS 2014
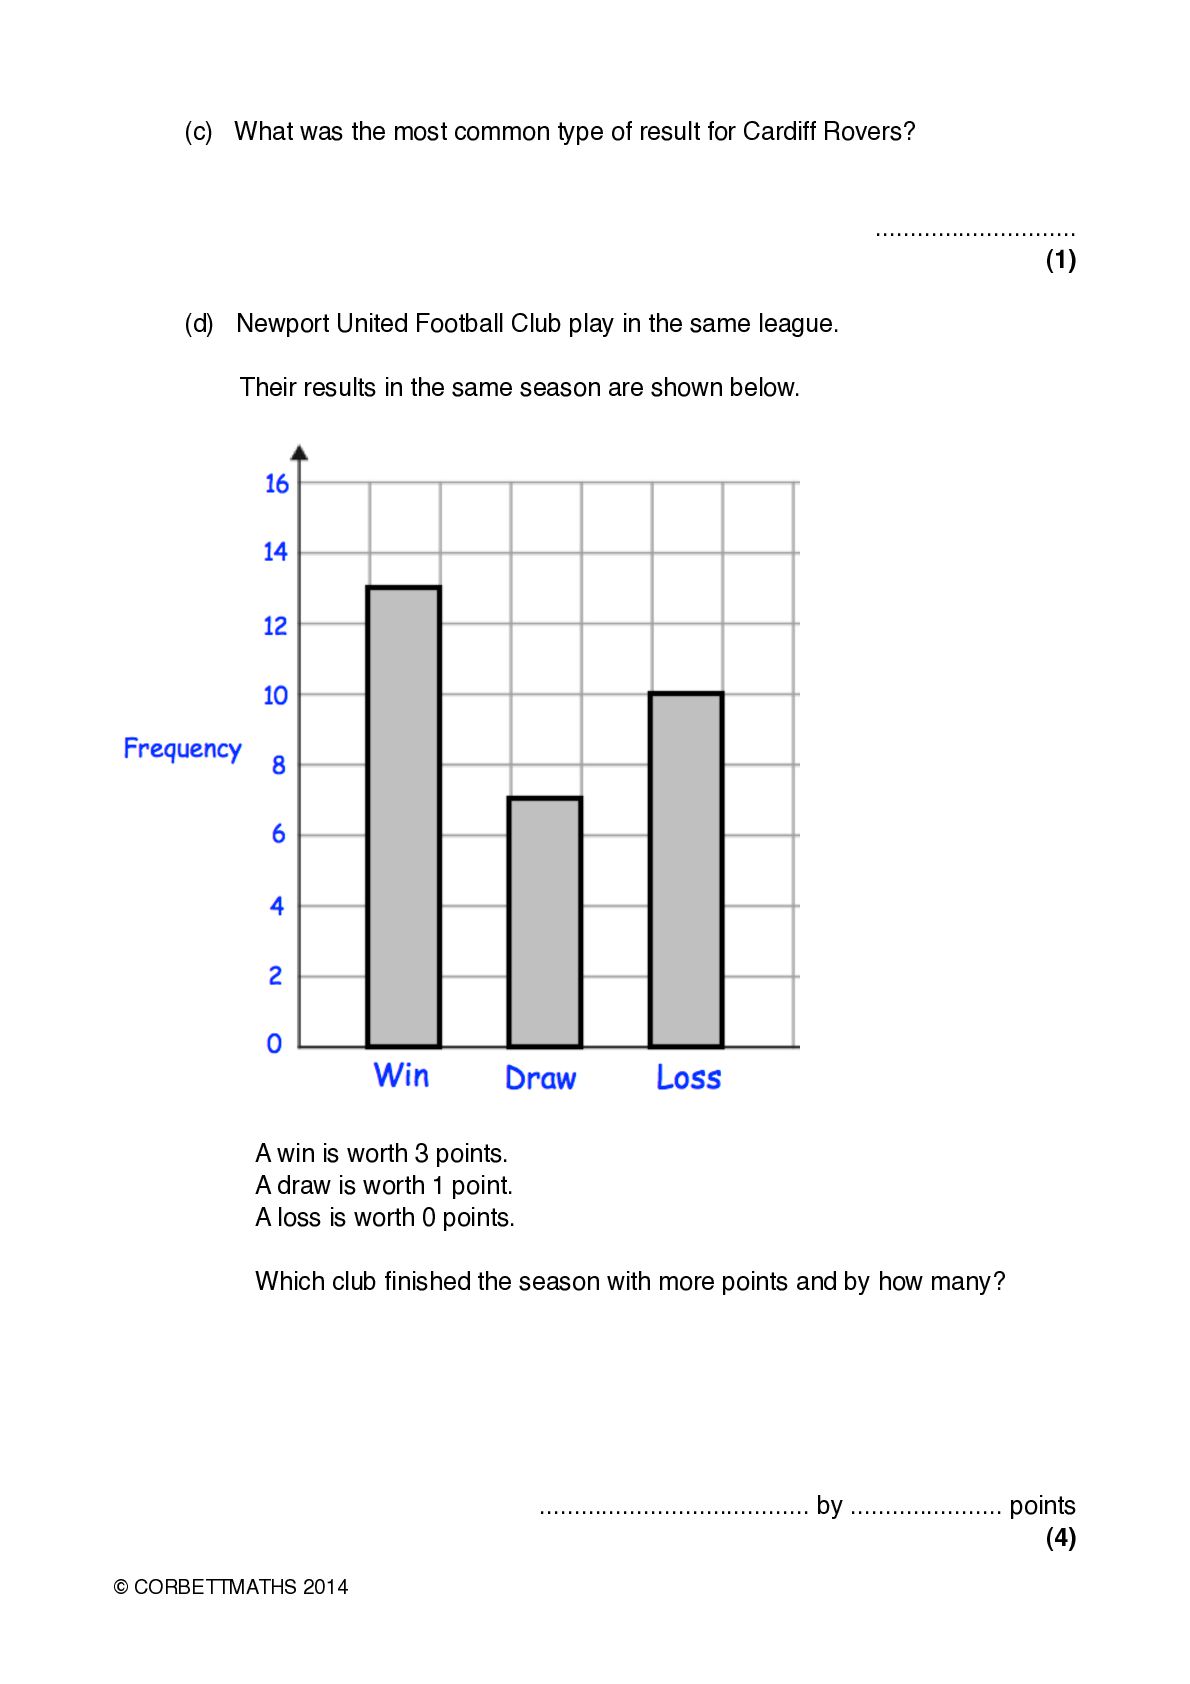
  6. ! (c) What was the most common type of result

    for Cardiff Rovers? ............................. (1) ! (d) Newport United Football Club play in the same league. ! Their results in the same season are shown below. ! ! ! ! ! ! A win is worth 3 points. A draw is worth 1 point. A loss is worth 0 points. ! ! Which club finished the season with more points and by how many? ....................................... by ...................... points (4) © CORBETTMATHS 2014
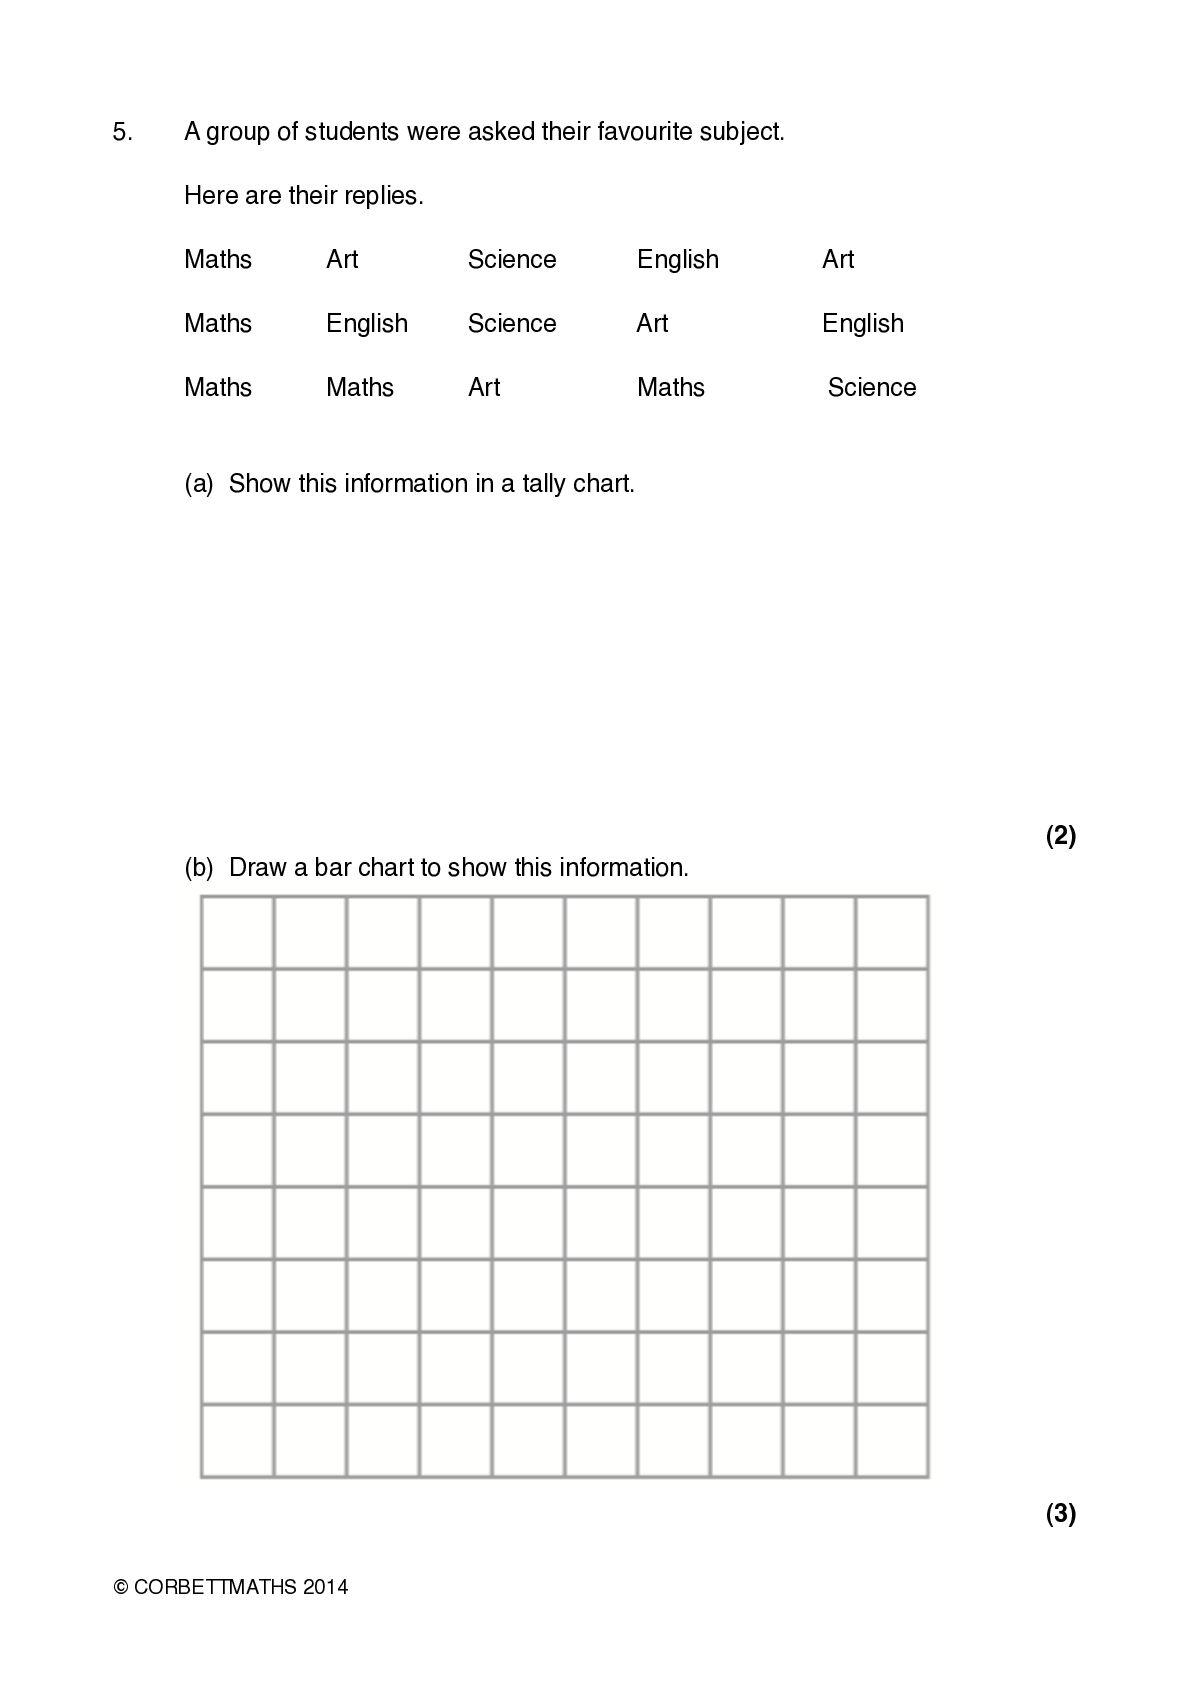
  7. 5.! A group of students were asked their favourite subject.

    ! Here are their replies. ! ! ! Maths!! Art! Maths!! ! Maths!! ! (a) Show this information in a tally chart. ! Science ! English English ! Science! Art! ! Maths!! Art! Maths! ! ! ! Art English Science (2) ! (b) Draw a bar chart to show this information. ! (3) © CORBETTMATHS 2014
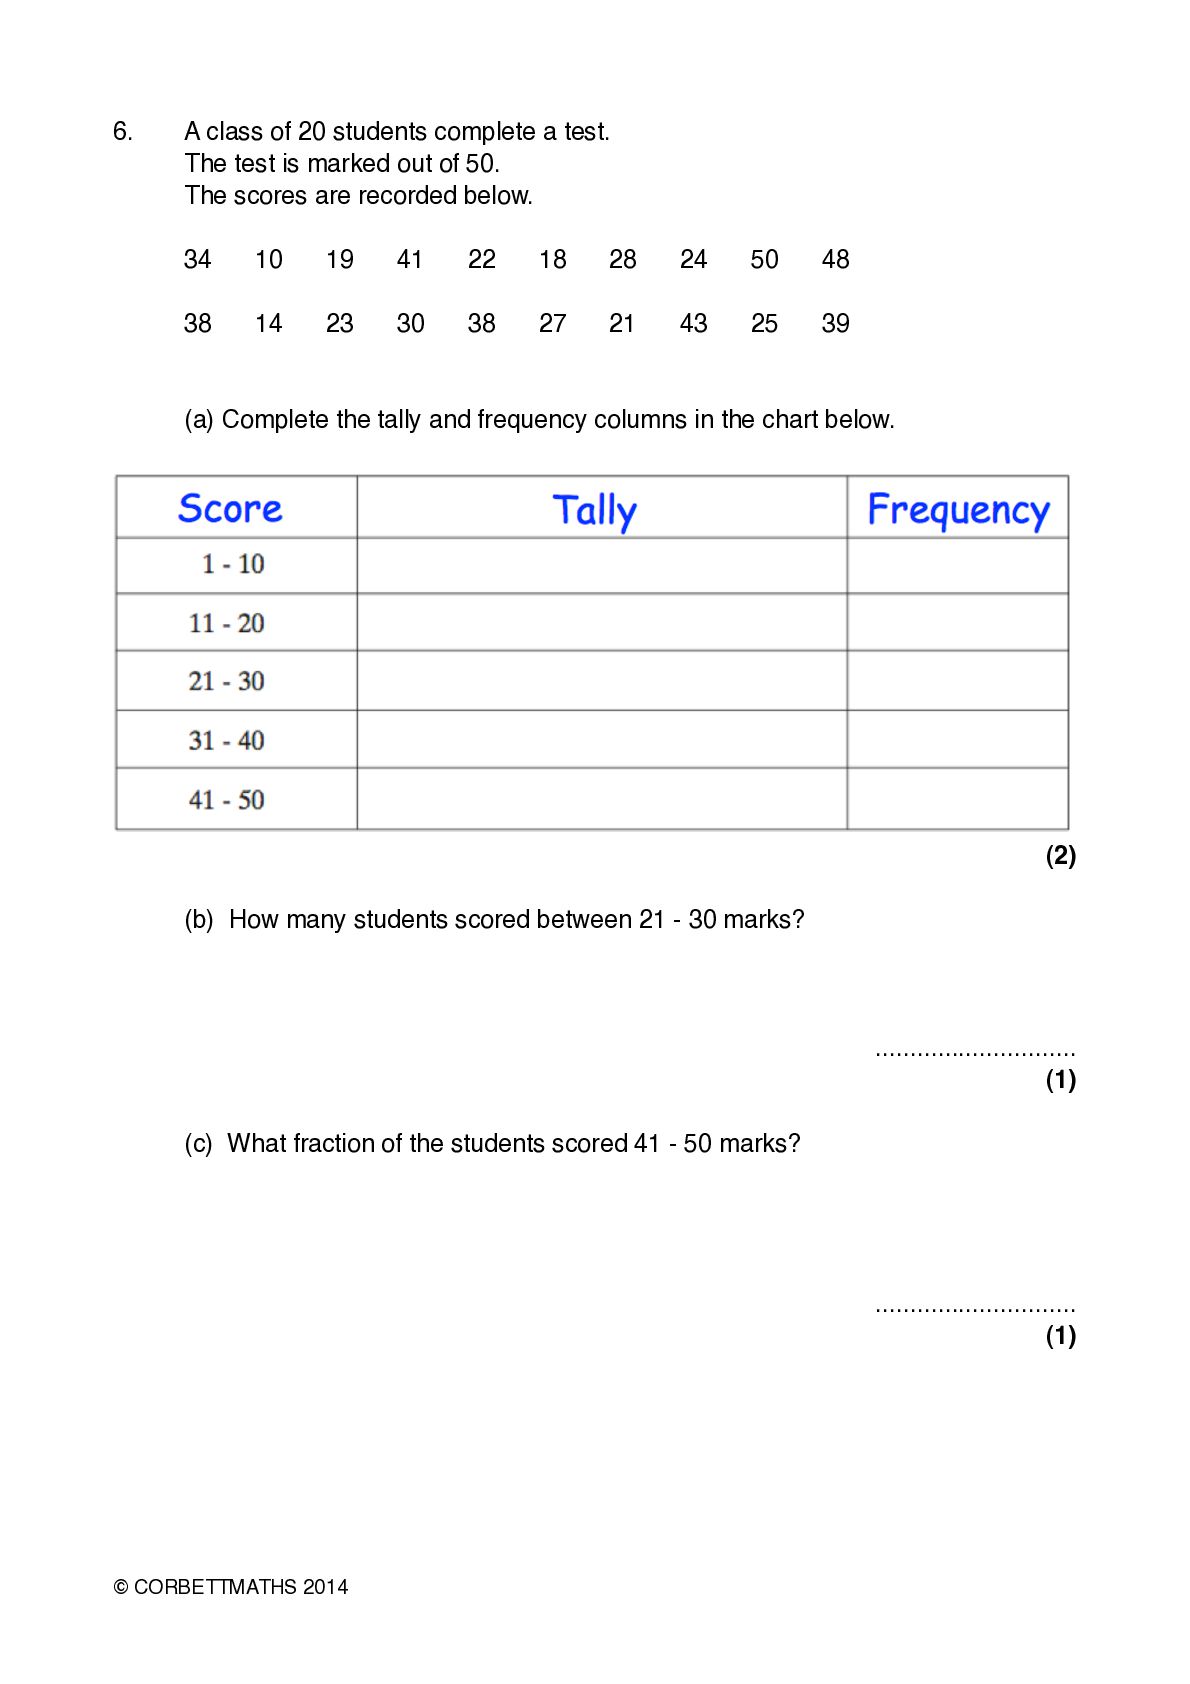
  8. 6.! ! ! A class of 20 students complete a

    test. The test is marked out of 50. The scores are recorded below. ! 34! 10! 19! 41! 22! 18! 28! 24! 50! 48 ! 38! 14! 23! 30! 38! 27! 21! 43! 25! 39 ! (a) Complete the tally and frequency columns in the chart below. (2) ! (b) How many students scored between 21 - 30 marks? ............................. (1) ! (c) What fraction of the students scored 41 - 50 marks? ............................. (1) © CORBETTMATHS 2014
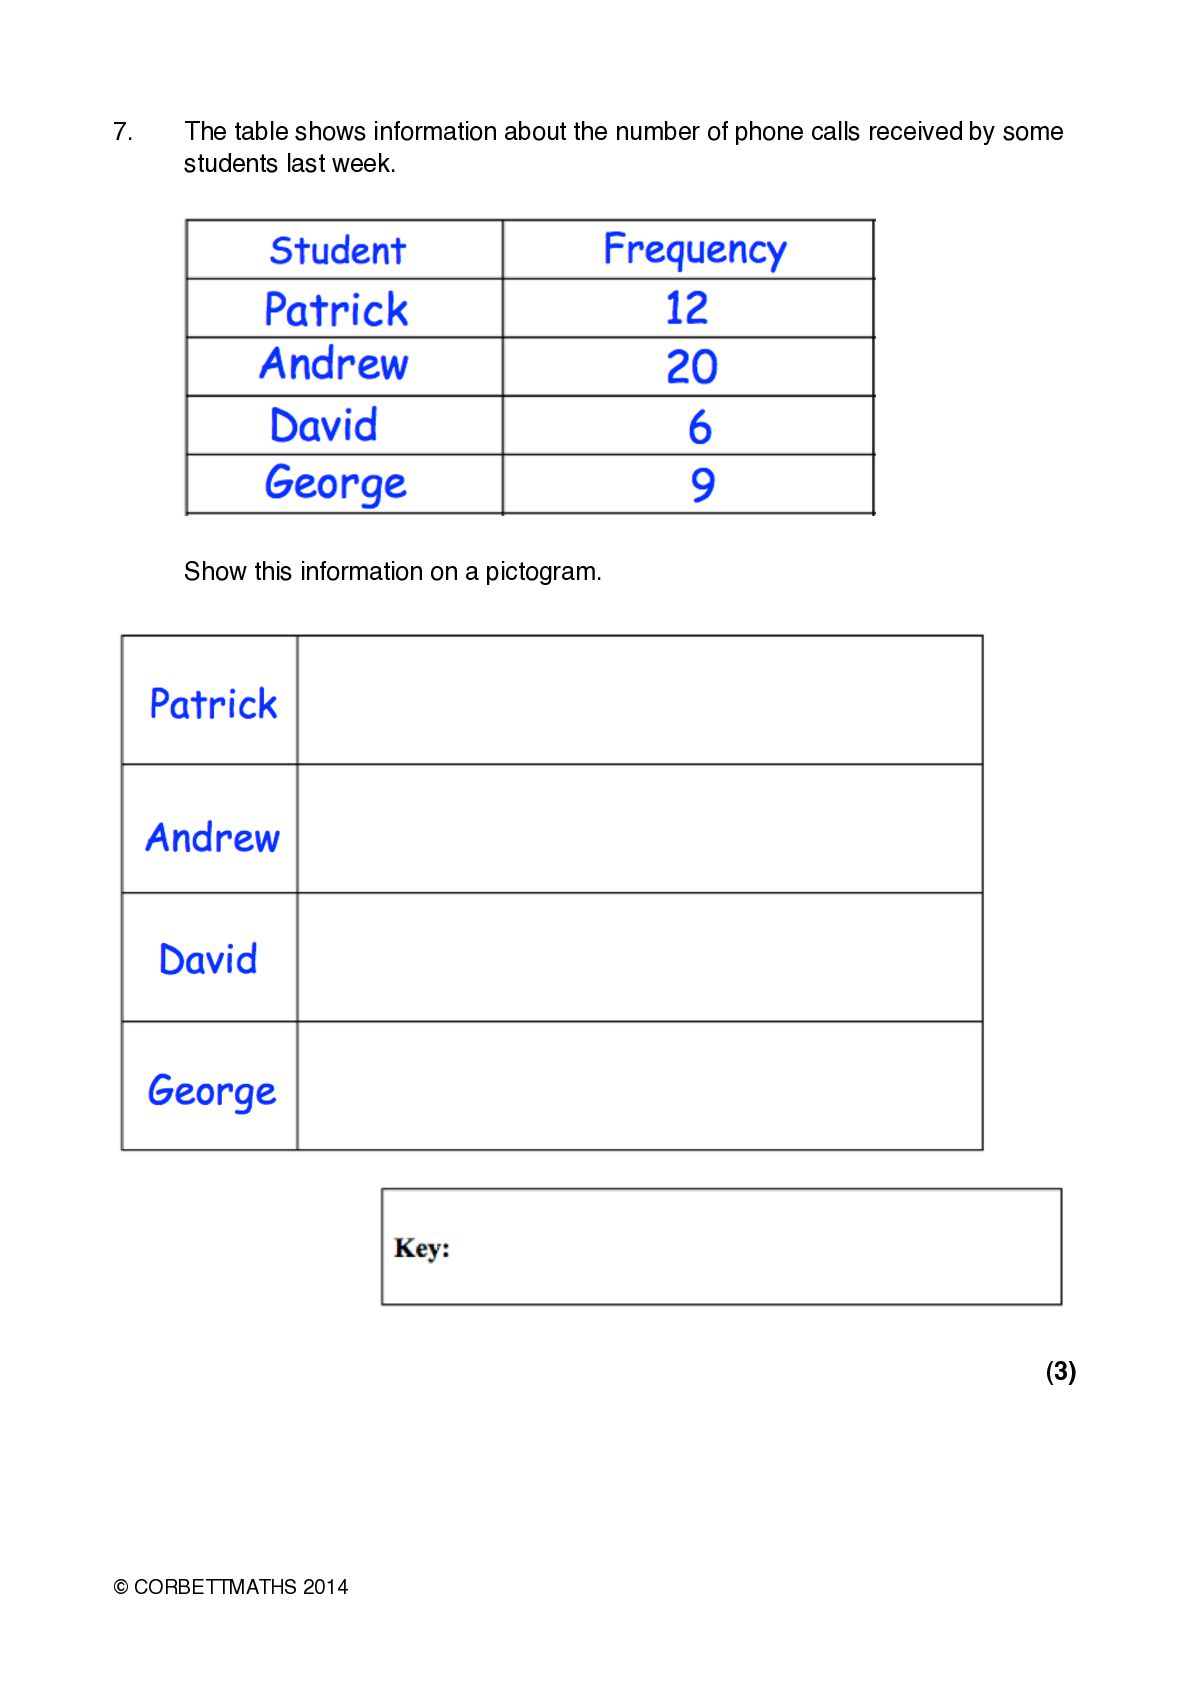
  9. 7.! ! The table shows information about the number of

    phone calls received by some students last week. ! ! Show this information on a pictogram. (3) © CORBETTMATHS 2014
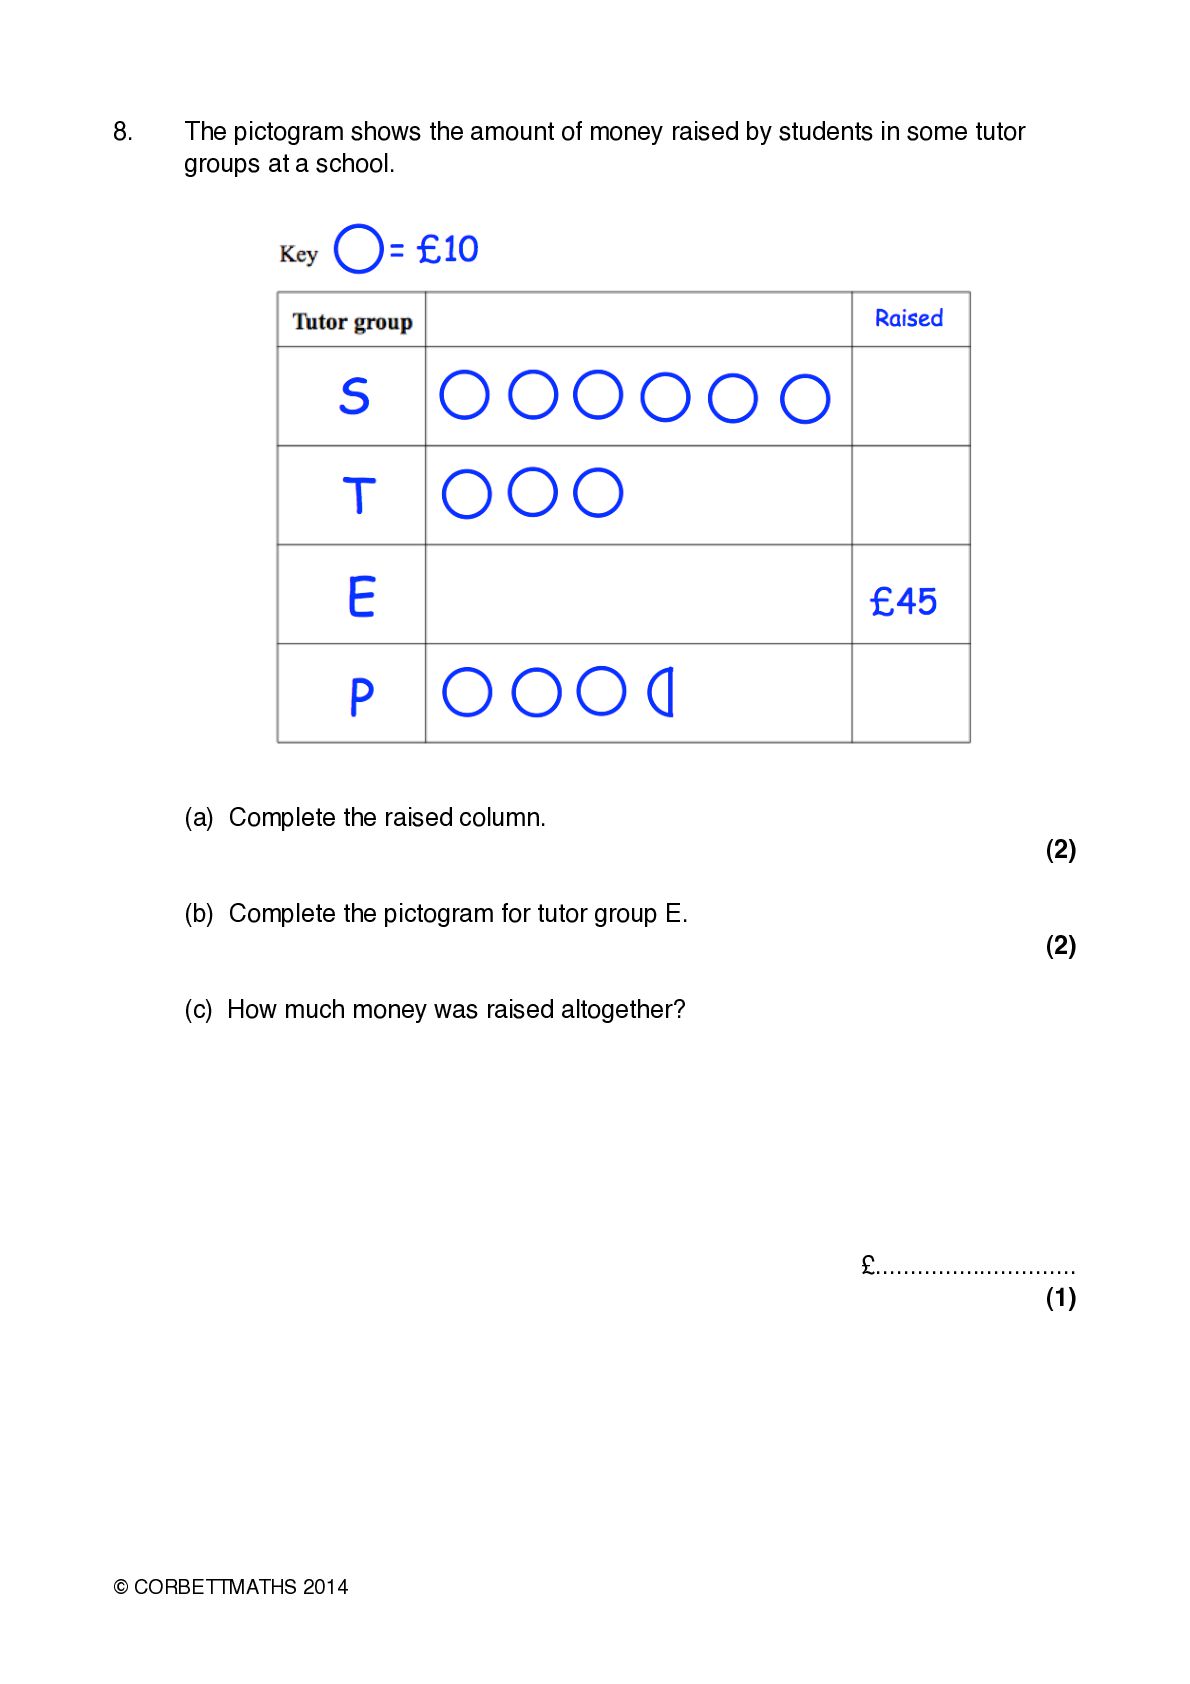
  10. 8.! ! The pictogram shows the amount of money raised

    by students in some tutor groups at a school. ! ! ! (a) Complete the raised column. (2) ! (b) Complete the pictogram for tutor group E. (2) ! (c) How much money was raised altogether? £............................. (1) ! ! © CORBETTMATHS 2014
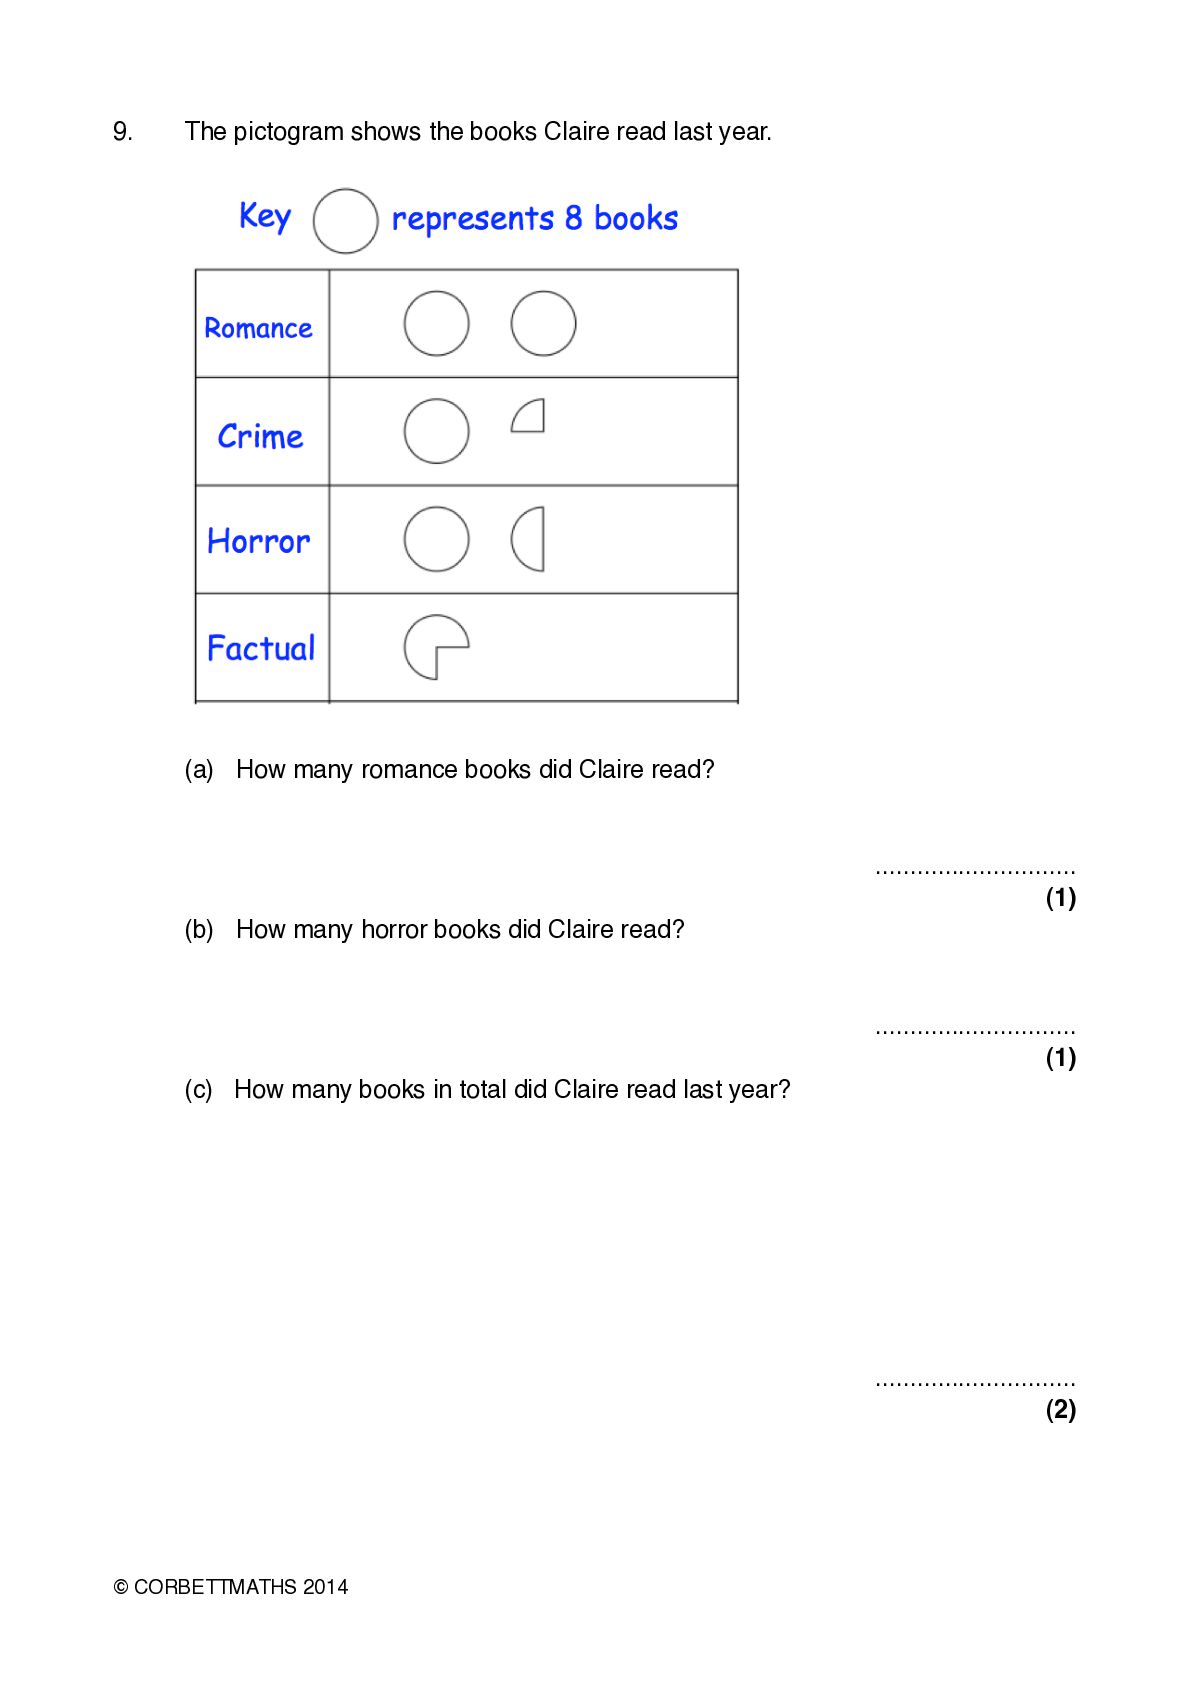
  11. 9.! The pictogram shows the books Claire read last year.

    ! ! (a) How many romance books did Claire read? ............................. (1) ! (b) How many horror books did Claire read? ............................. (1) ! (c) How many books in total did Claire read last year? ............................. (2) © CORBETTMATHS 2014
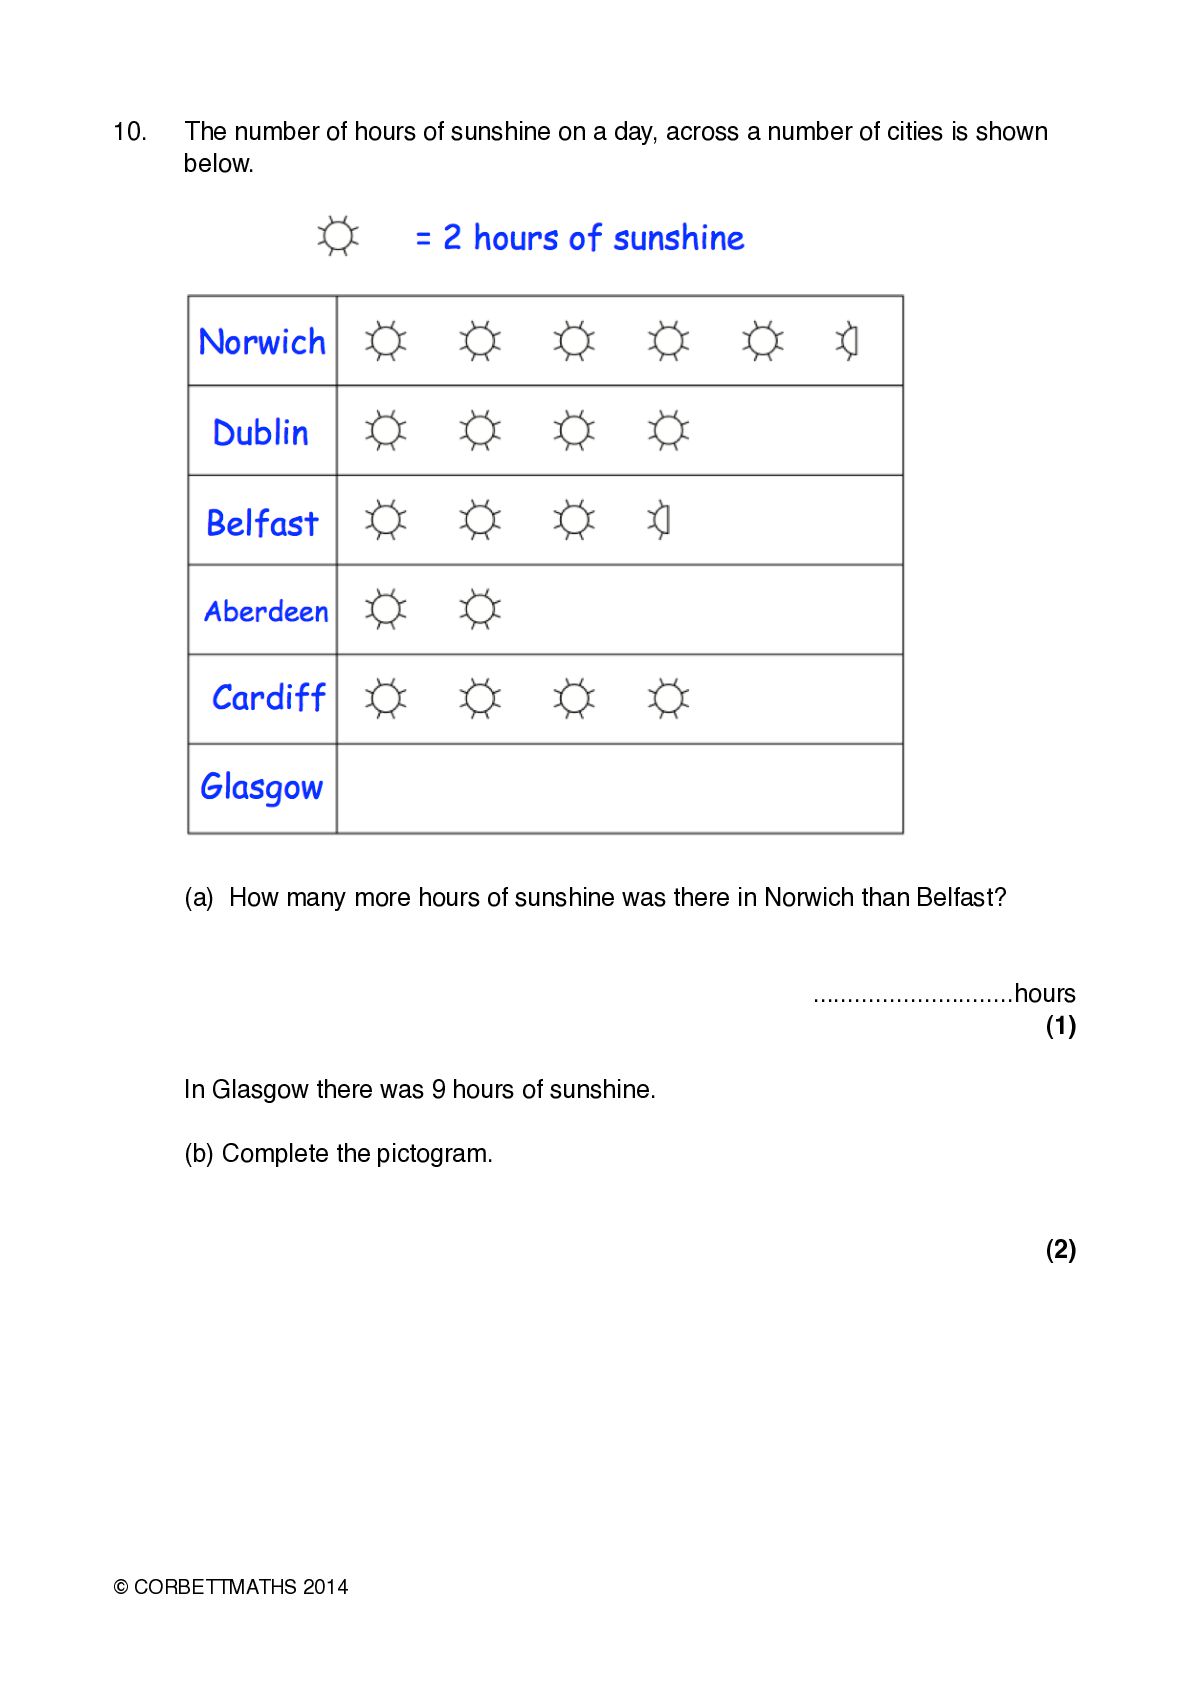
  12. 10.! ! The number of hours of sunshine on a

    day, across a number of cities is shown below. ! ! (a) How many more hours of sunshine was there in Norwich than Belfast? .............................hours (1) ! In Glasgow there was 9 hours of sunshine. ! (b) Complete the pictogram. (2) © CORBETTMATHS 2014
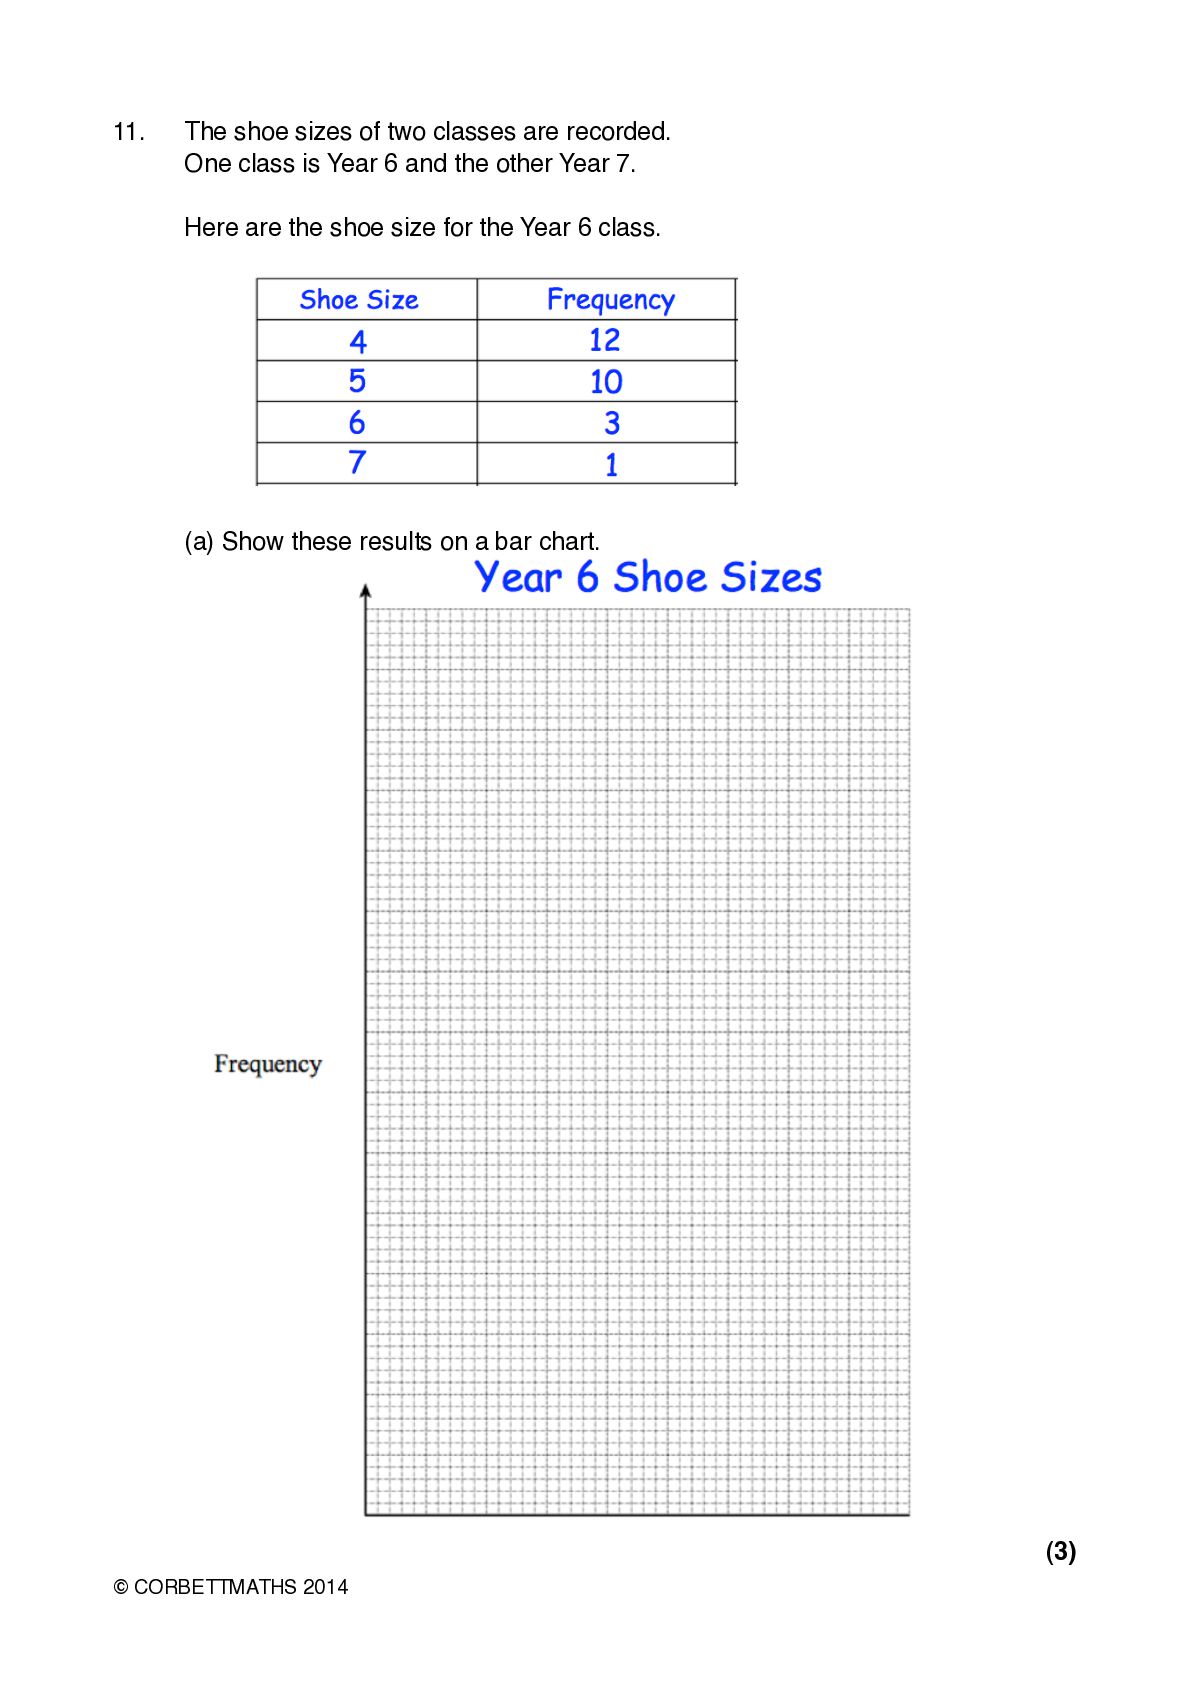
  13. 11.! ! The shoe sizes of two classes are recorded.

    One class is Year 6 and the other Year 7. ! Here are the shoe size for the Year 6 class. ! ! ! (a) Show these results on a bar chart. ! (3) © CORBETTMATHS 2014
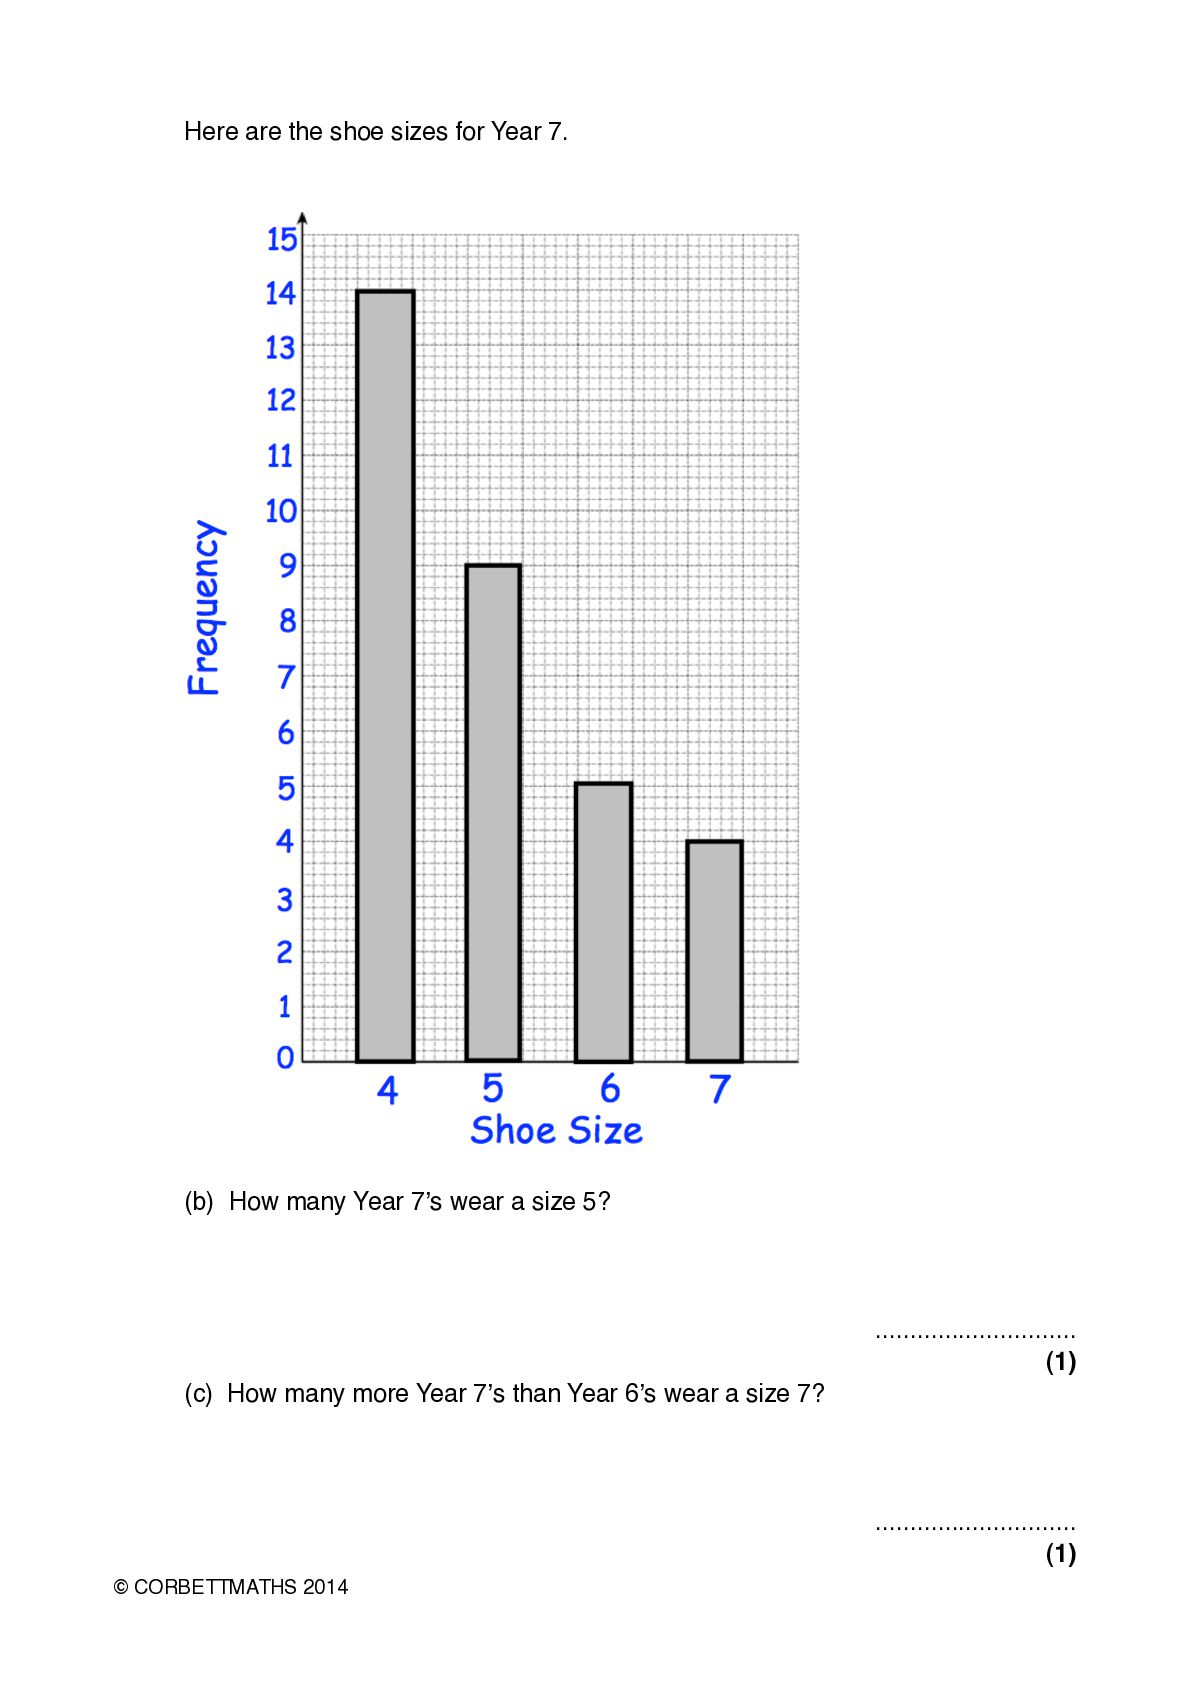
  14. ! Here are the shoe sizes for Year 7. !

    ! (b) How many Year 7ʼs wear a size 5? ............................. (1) ! (c) How many more Year 7ʼs than Year 6ʼs wear a size 7? ............................. (1) © CORBETTMATHS 2014
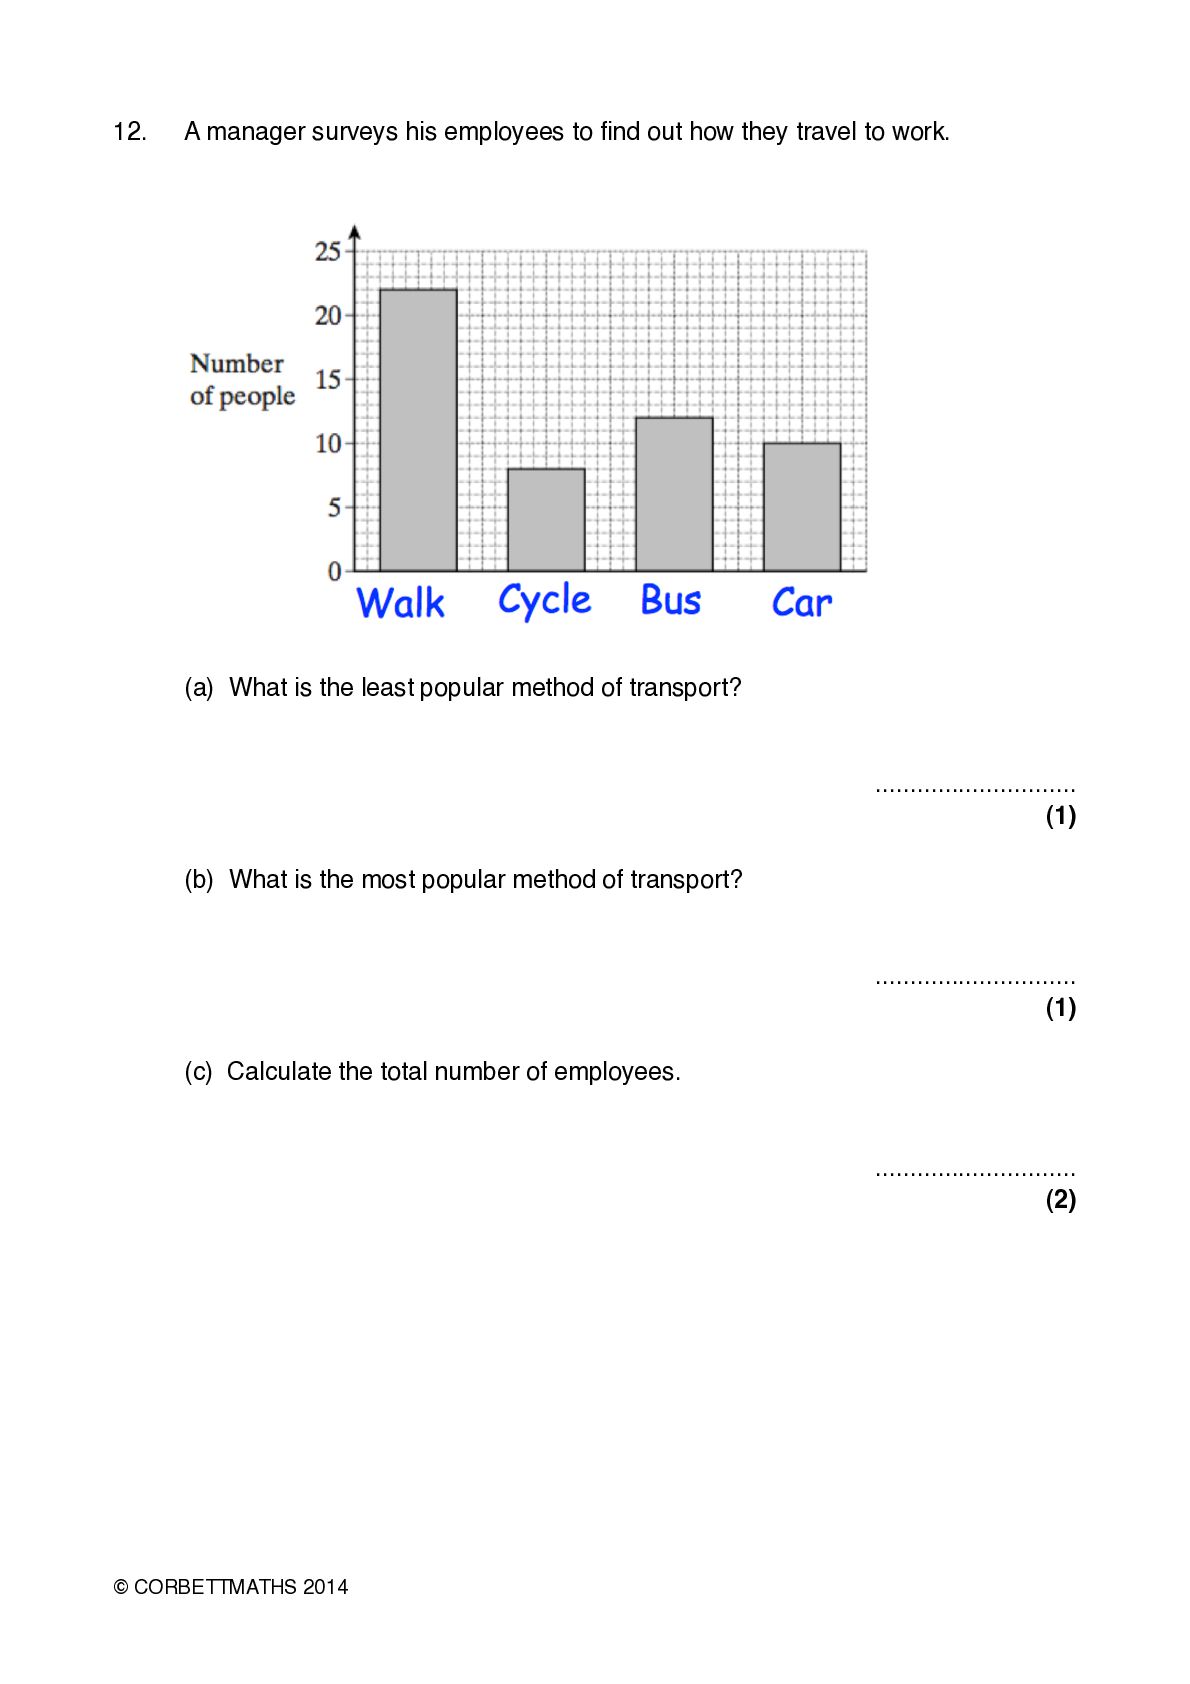
  15. 12.! A manager surveys his employees to find out how

    they travel to work. ! ! (a) What is the least popular method of transport? ............................. (1) ! (b) What is the most popular method of transport? ............................. (1) ! (c) Calculate the total number of employees. ............................. (2) © CORBETTMATHS 2014
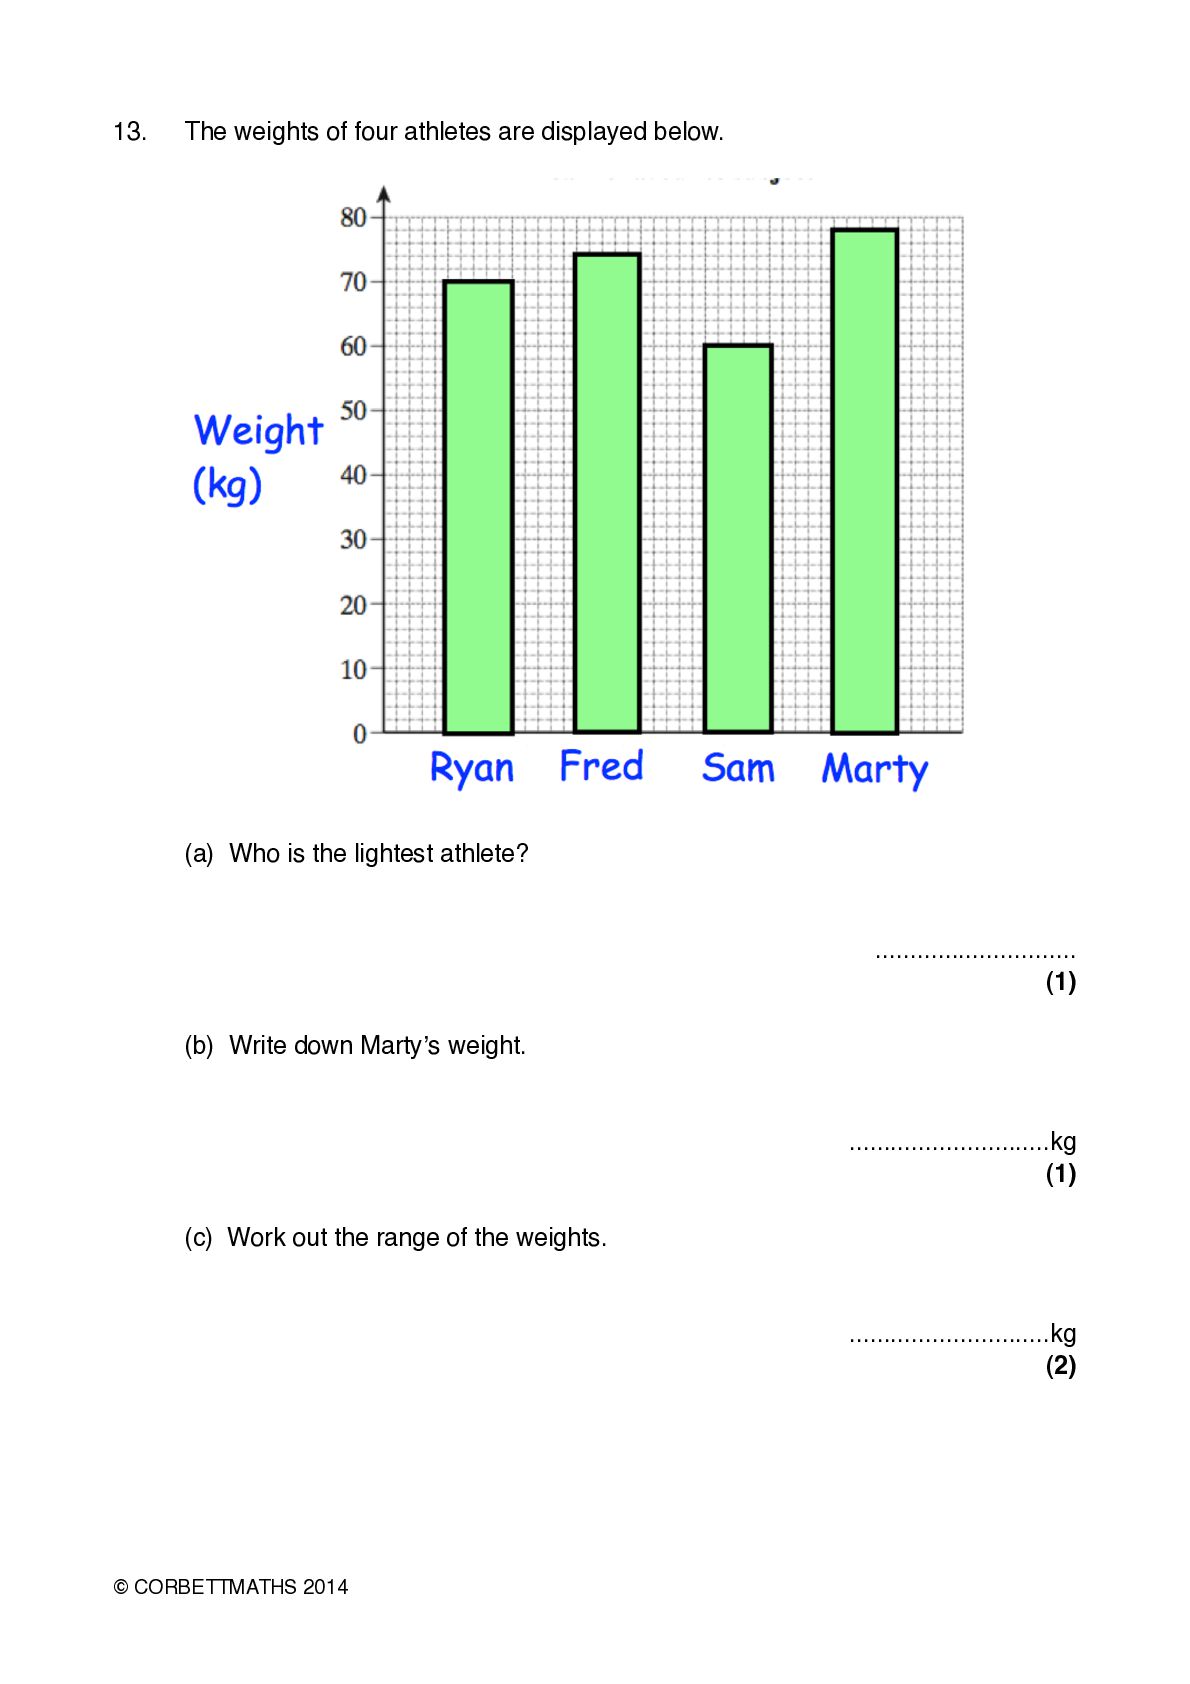
  16. 13.! The weights of four athletes are displayed below. !

    ! (a) Who is the lightest athlete? ............................. (1) ! (b) Write down Martyʼs weight. .............................kg (1) ! (c) Work out the range of the weights. .............................kg (2) © CORBETTMATHS 2014
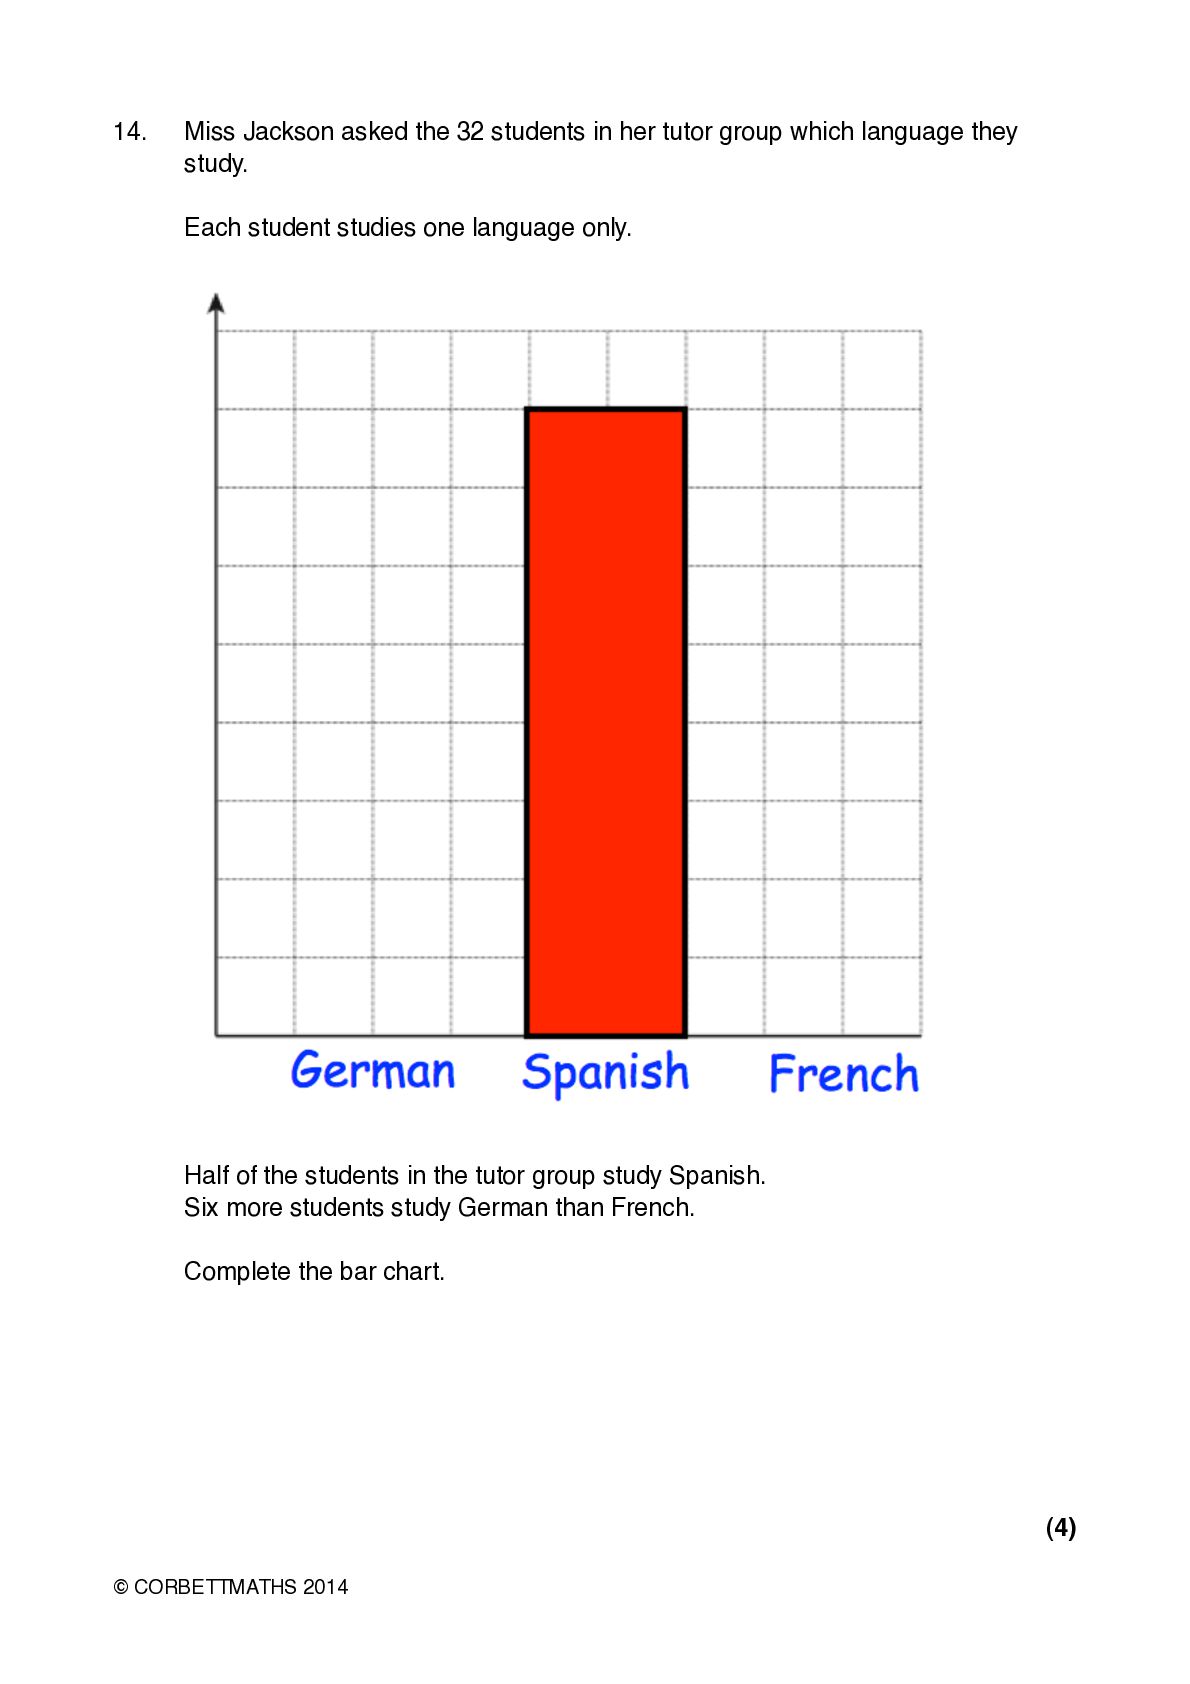
  17. 14.! ! ! ! Miss Jackson asked the 32 students

    in her tutor group which language they study. Each student studies one language only. ! ! ! Half of the students in the tutor group study Spanish. Six more students study German than French. ! ! Complete the bar chart. (4) © CORBETTMATHS 2014