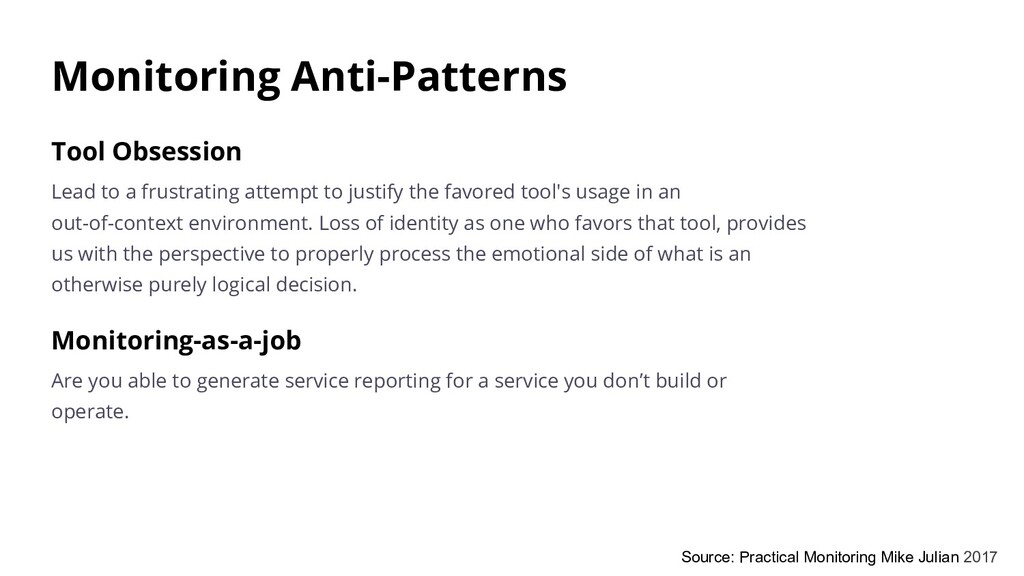
justify the favored tool's usage in an out-of-context environment. Loss of identity as one who favors that tool, provides us with the perspective to properly process the emotional side of what is an otherwise purely logical decision. Monitoring-as-a-job Are you able to generate service reporting for a service you don’t build or operate. Source: Practical Monitoring Mike Julian 2017
something will break during the release! We’ll add monitoring after that the fact. Manual Configuration I’m sure we all can agree that automation is awesome. That’s why it’s surprising to me how often monitoring configuration is manual. The question I never want to hear is “Can you add this to monitoring?” Your monitoring should be 100% automated. Services should self-register instead of someone having to add them. Source: Practical Monitoring Mike Julian 2017
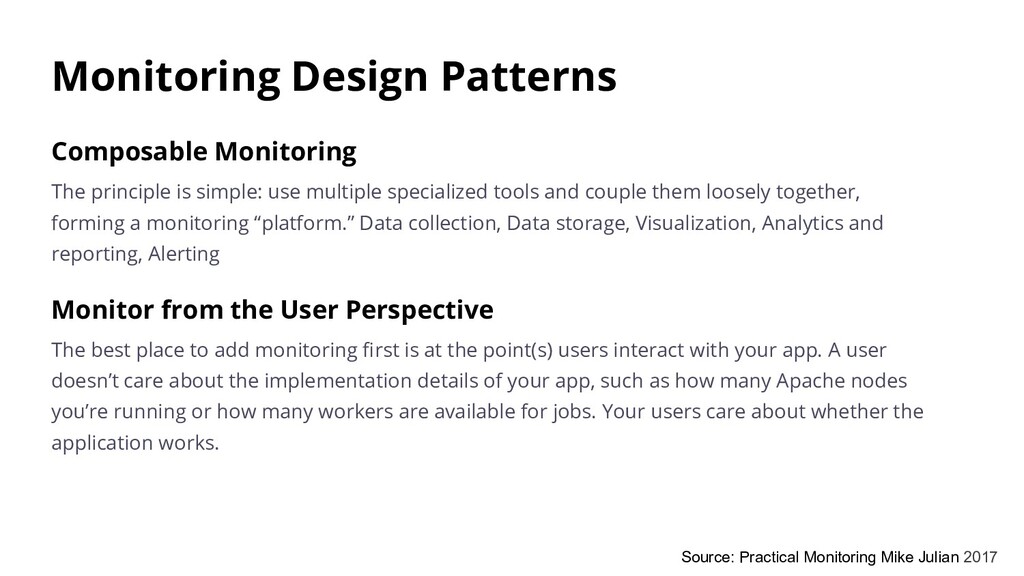
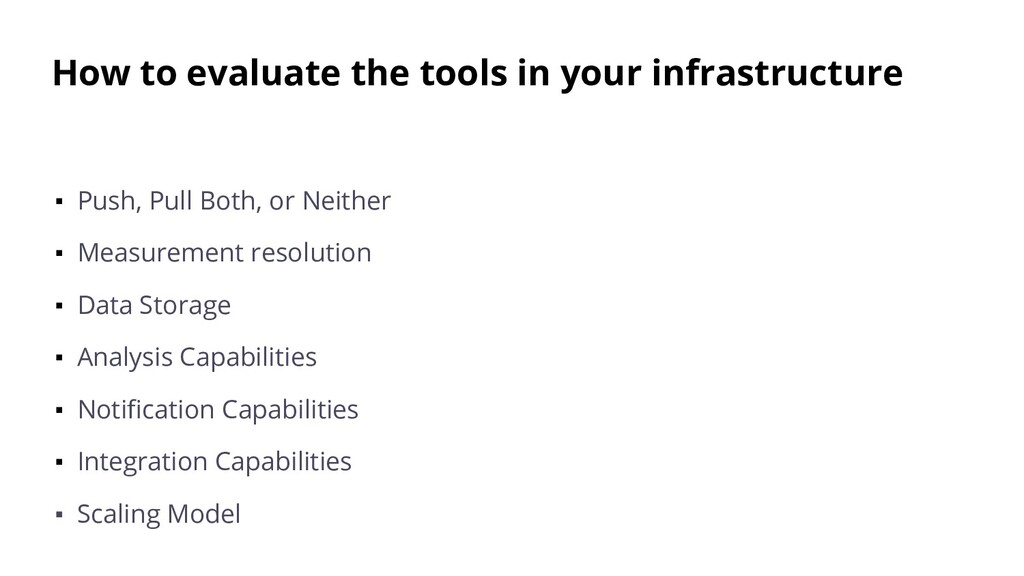
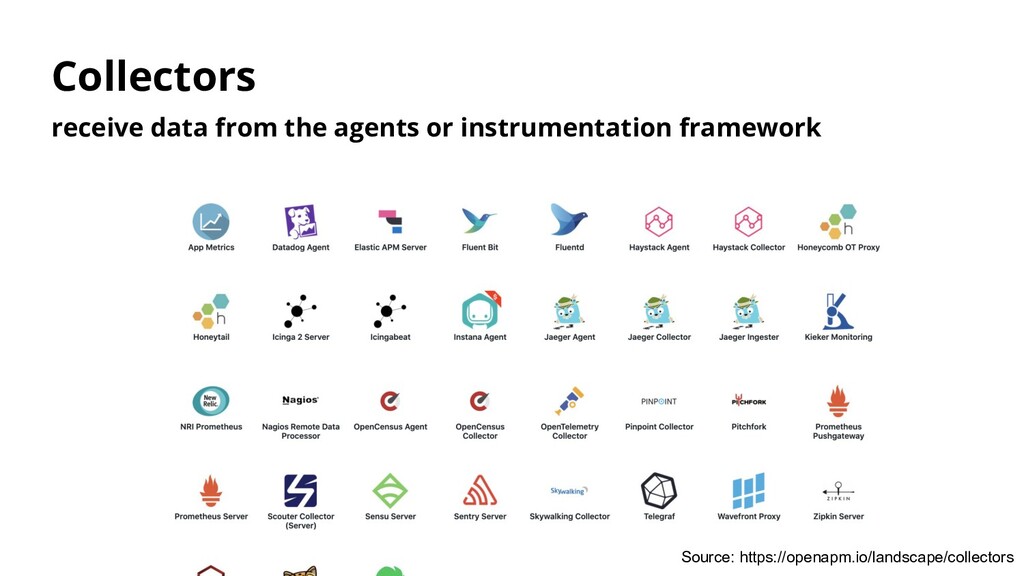
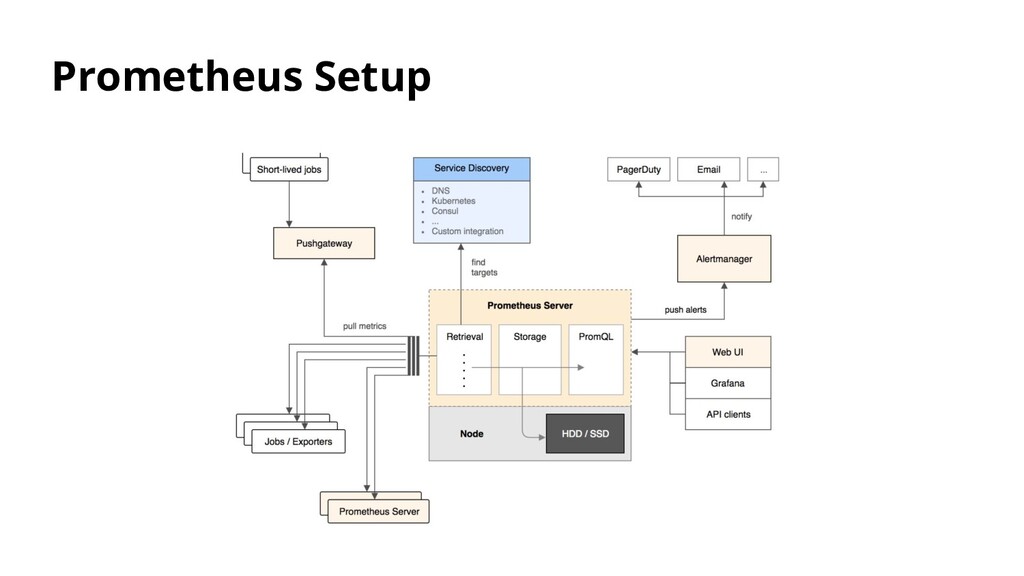
multiple specialized tools and couple them loosely together, forming a monitoring “platform.” Data collection, Data storage, Visualization, Analytics and reporting, Alerting Monitor from the User Perspective The best place to add monitoring first is at the point(s) users interact with your app. A user doesn’t care about the implementation details of your app, such as how many Apache nodes you’re running or how many workers are available for jobs. Your users care about whether the application works. Source: Practical Monitoring Mike Julian 2017
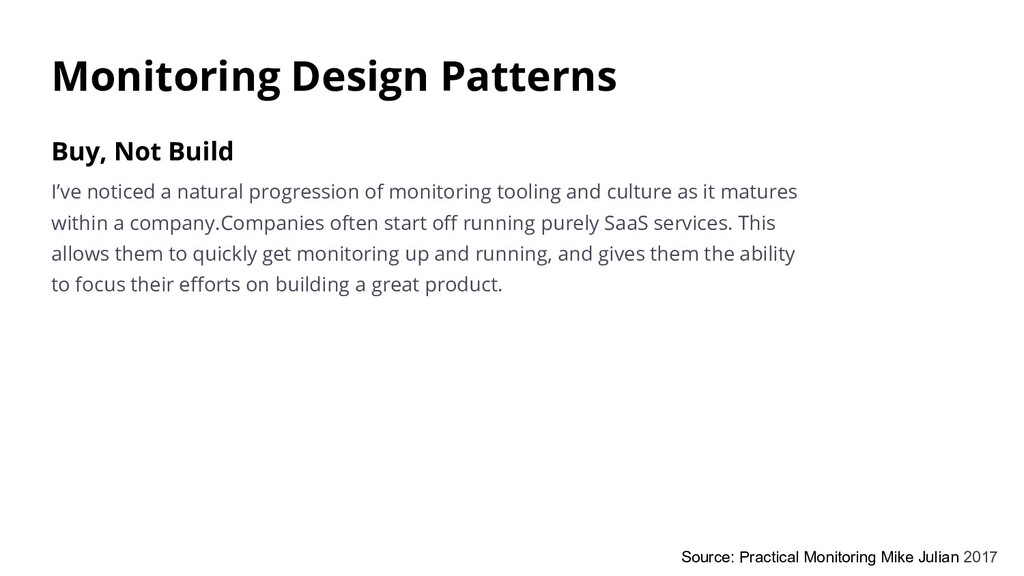
progression of monitoring tooling and culture as it matures within a company.Companies often start off running purely SaaS services. This allows them to quickly get monitoring up and running, and gives them the ability to focus their efforts on building a great product. Source: Practical Monitoring Mike Julian 2017
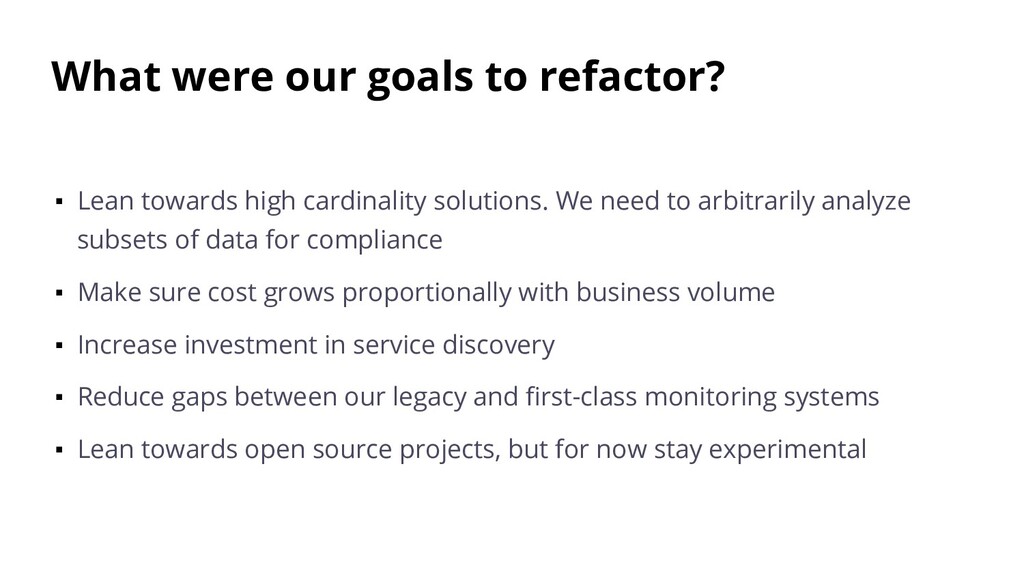
cardinality solutions. We need to arbitrarily analyze subsets of data for compliance ▪ Make sure cost grows proportionally with business volume ▪ Increase investment in service discovery ▪ Reduce gaps between our legacy and first-class monitoring systems ▪ Lean towards open source projects, but for now stay experimental
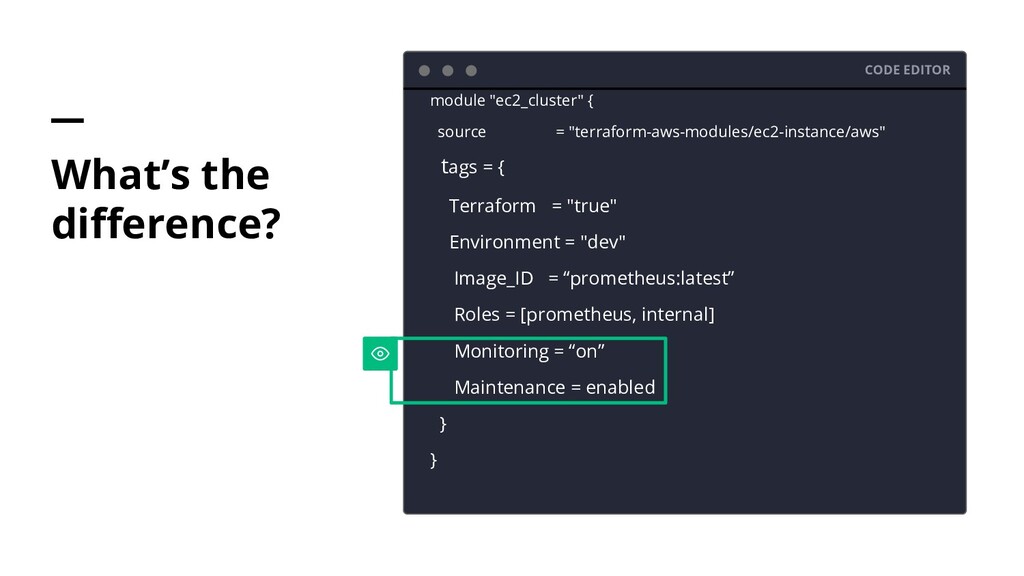
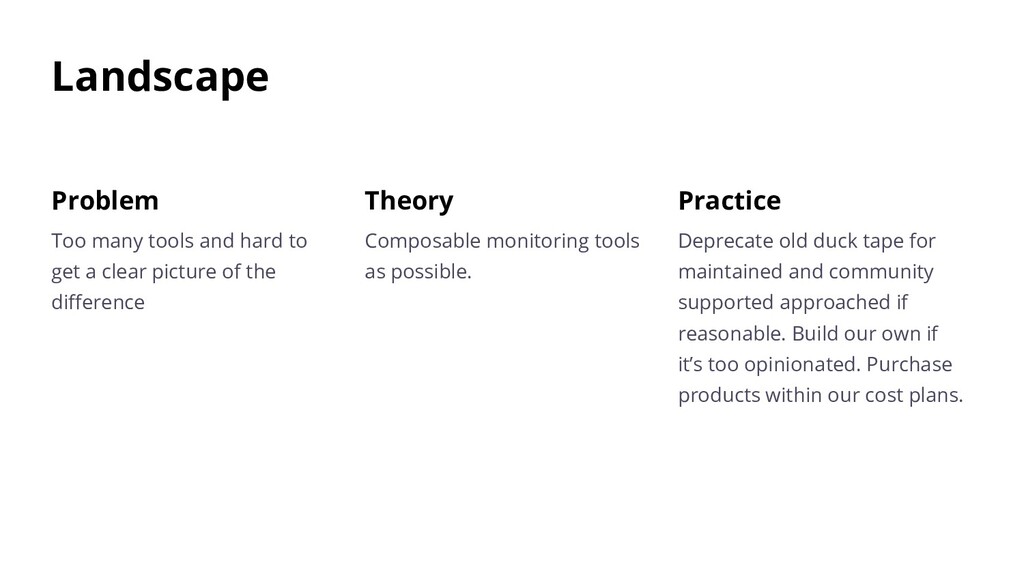
tools and hard to get a clear picture of the difference Practice Deprecate old duck tape for maintained and community supported approached if reasonable. Build our own if it’s too opinionated. Purchase products within our cost plans.
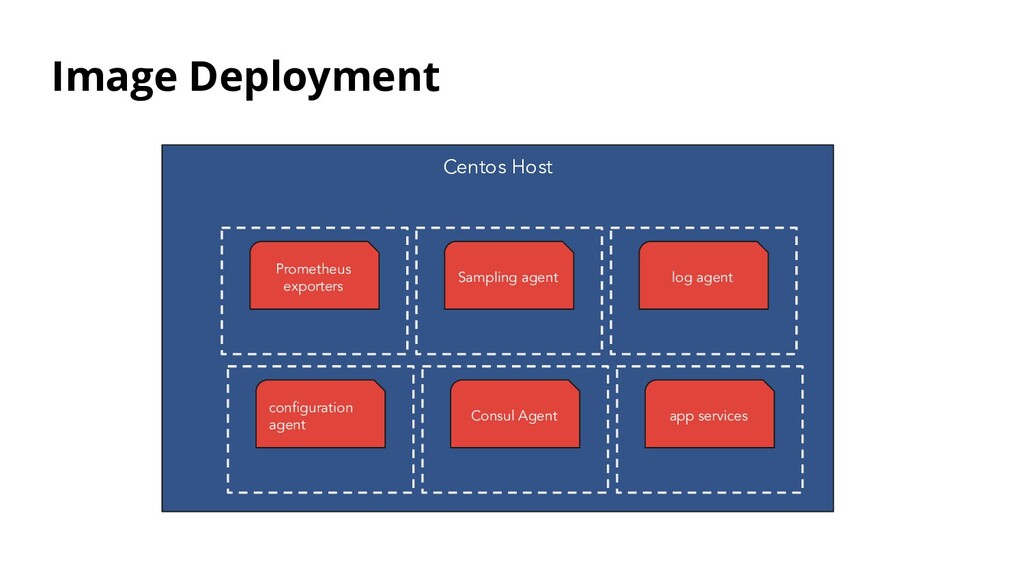
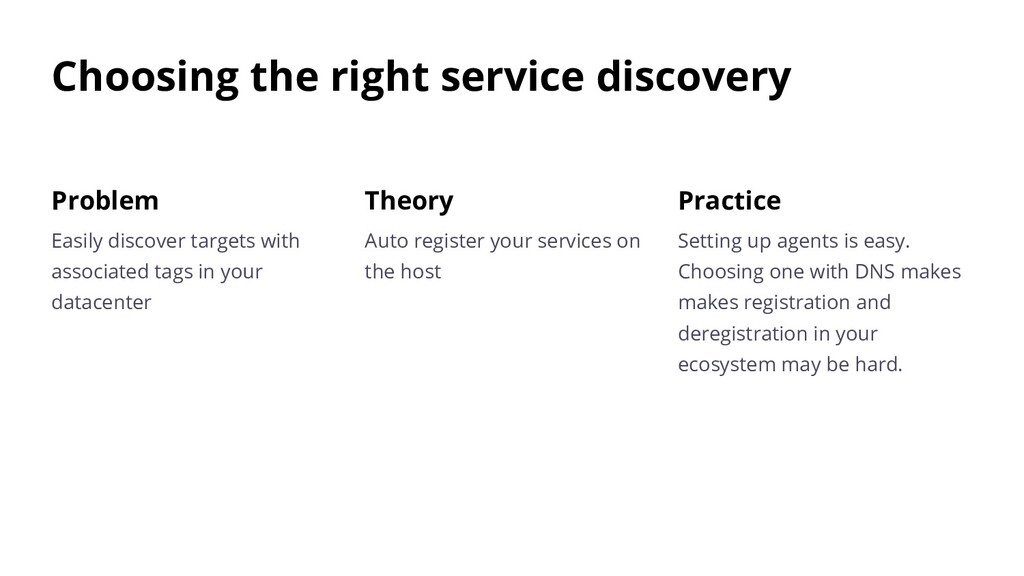
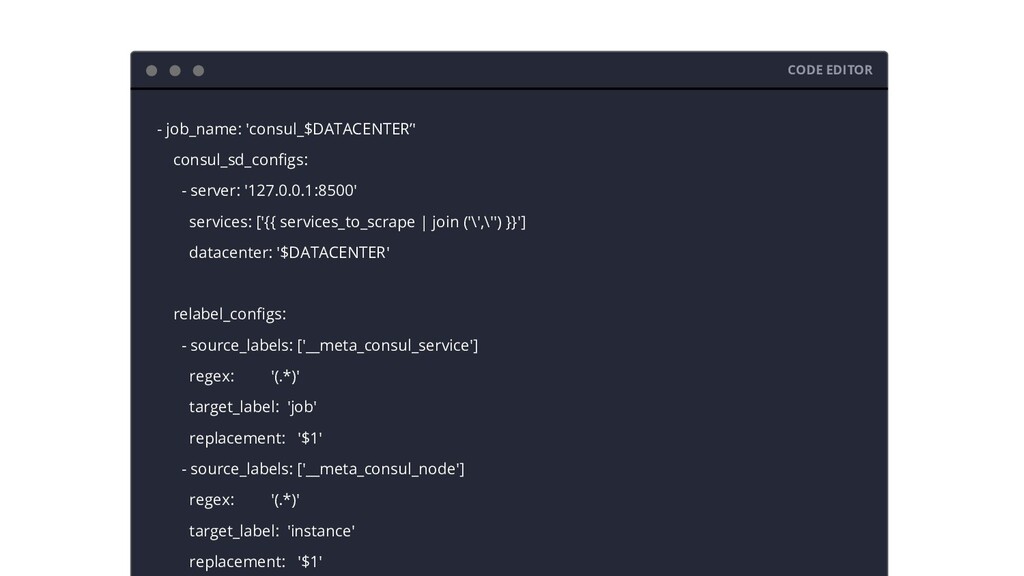
on the host Problem Easily discover targets with associated tags in your datacenter Practice Setting up agents is easy. Choosing one with DNS makes makes registration and deregistration in your ecosystem may be hard.
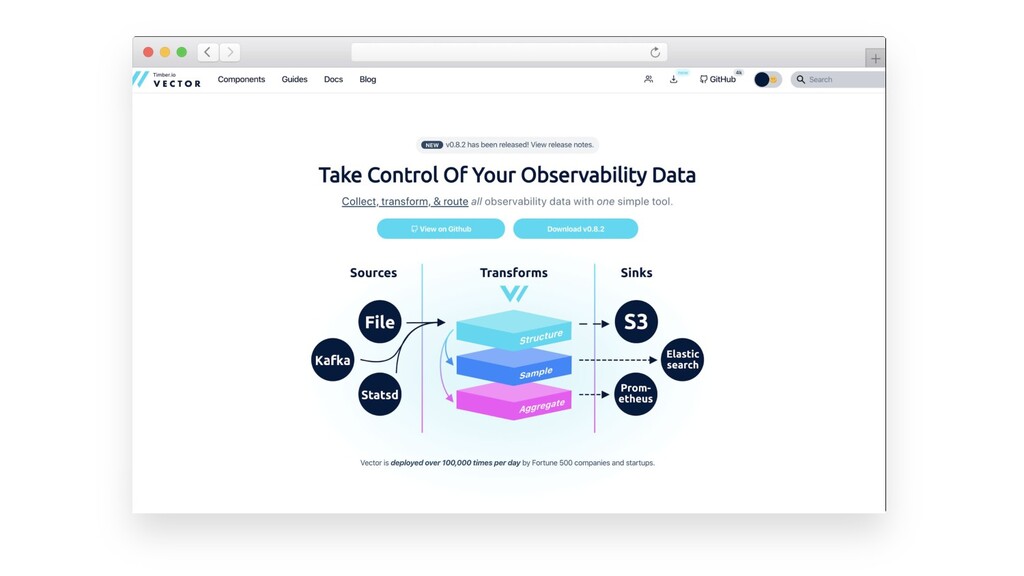
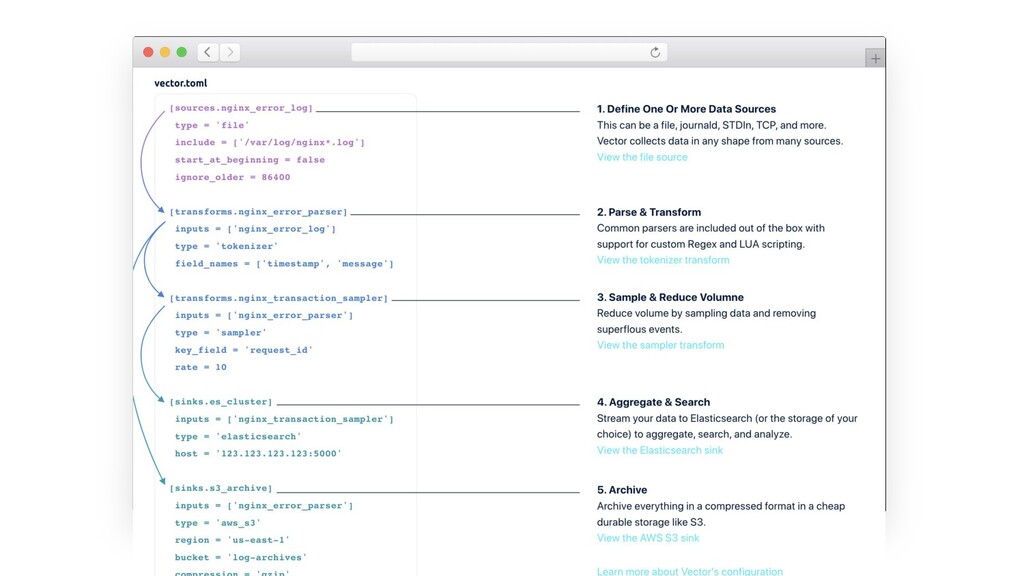
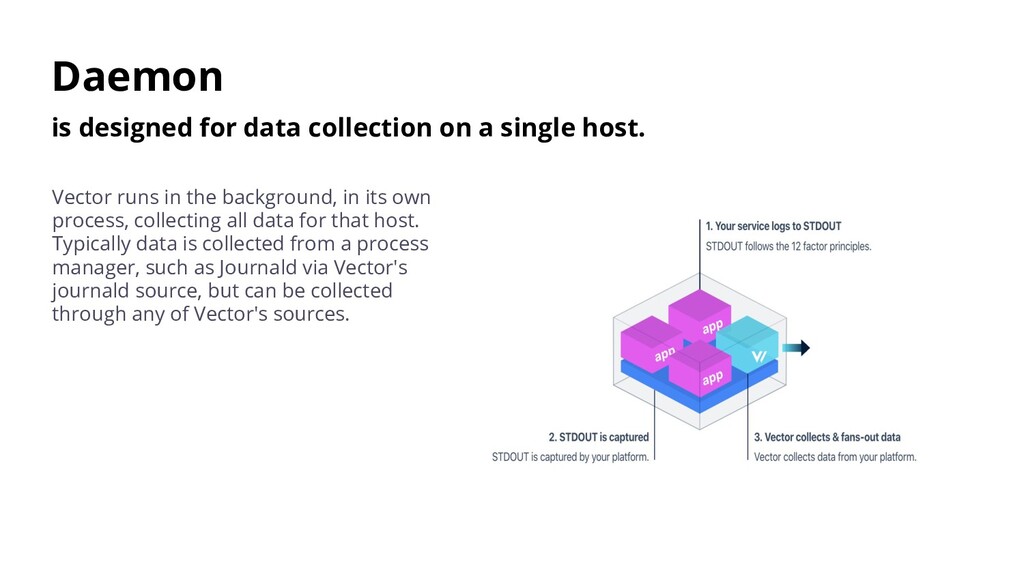
Vector runs in the background, in its own process, collecting all data for that host. Typically data is collected from a process manager, such as Journald via Vector's journald source, but can be collected through any of Vector's sources.
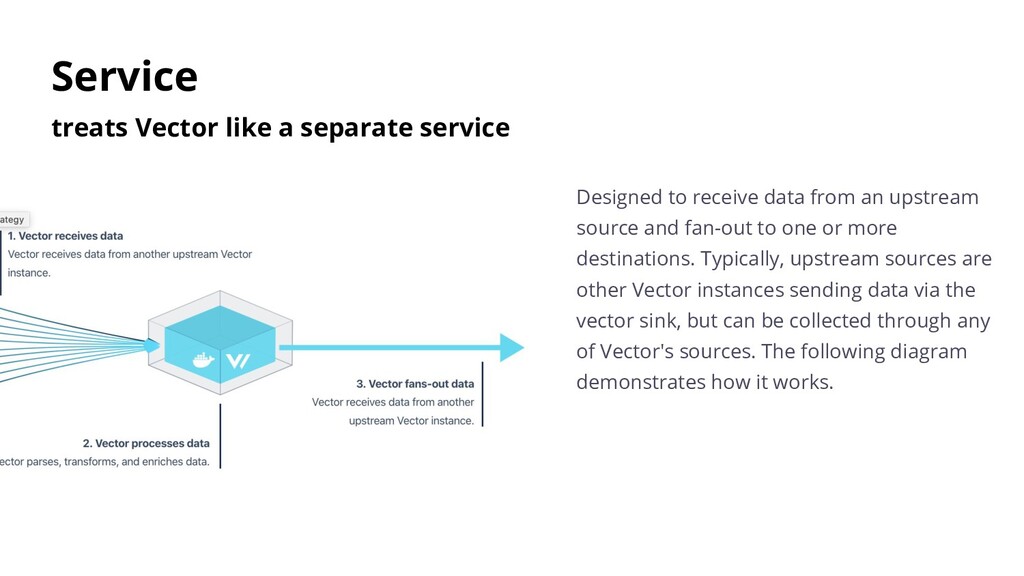
data from an upstream source and fan-out to one or more destinations. Typically, upstream sources are other Vector instances sending data via the vector sink, but can be collected through any of Vector's sources. The following diagram demonstrates how it works.
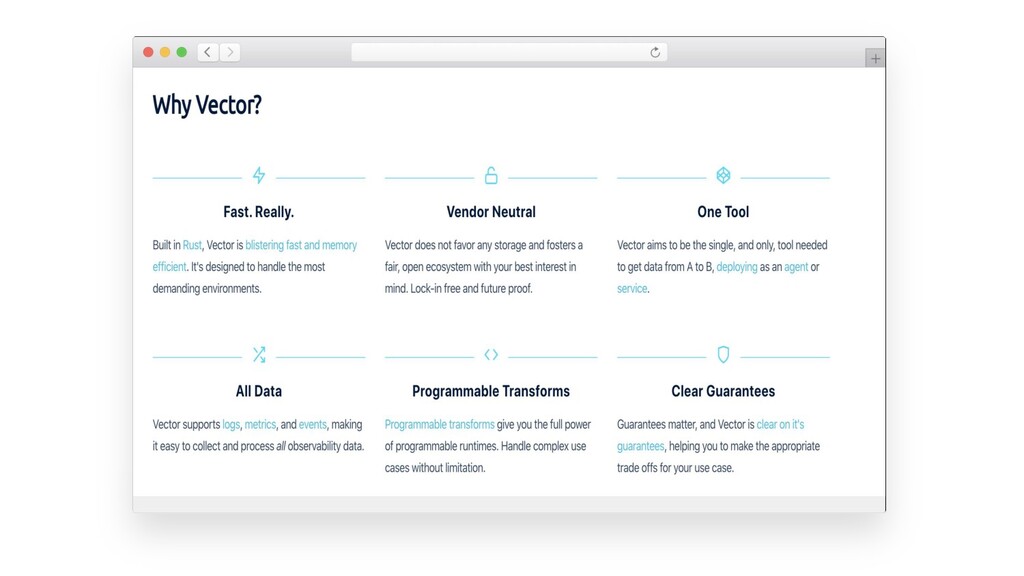
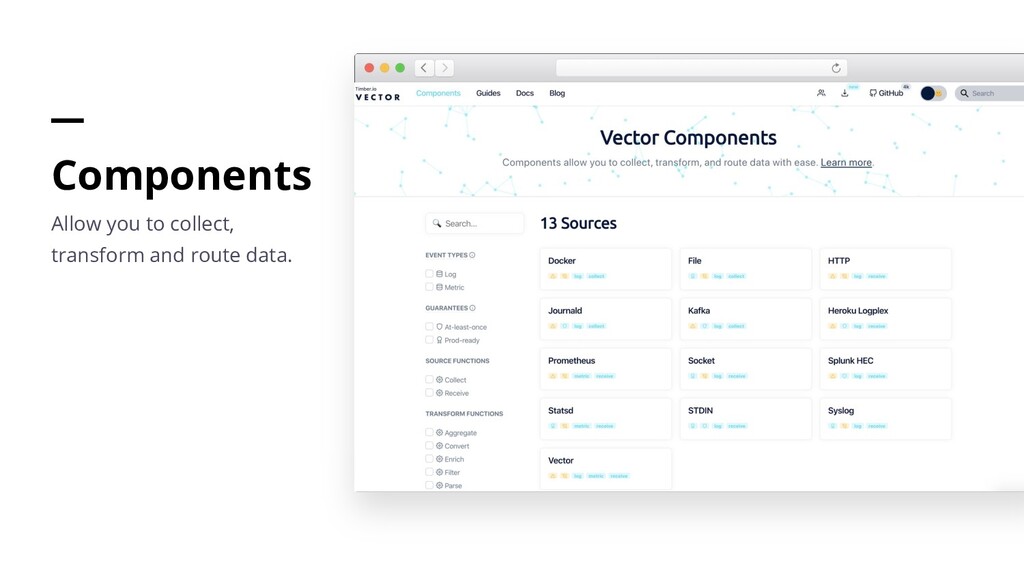
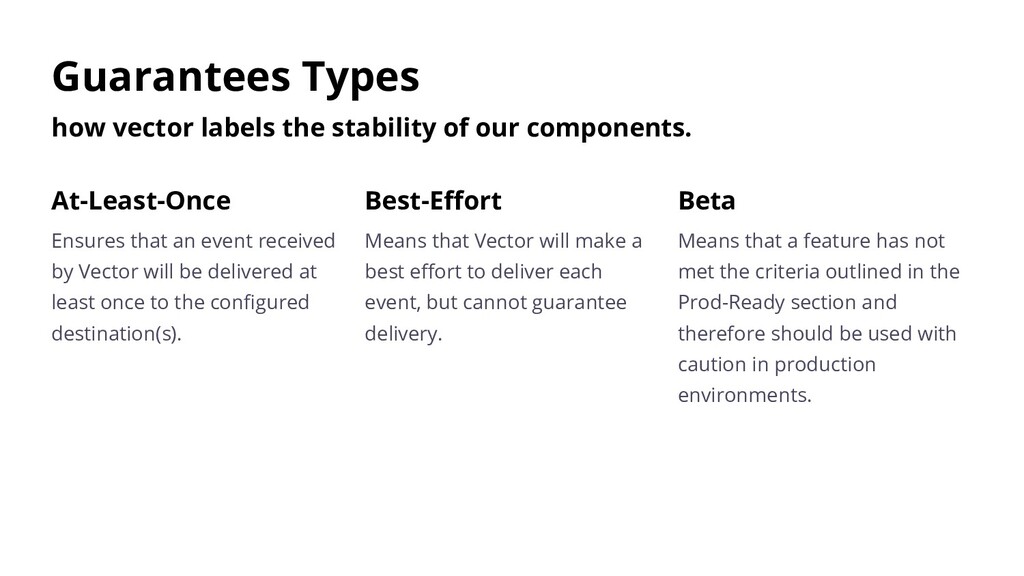
can expect from it. All components are categorized by their targeted delivery guarantee and also by their general stability. This helps you make the appropriate tradeoffs for your usecase.
Best-Effort Means that Vector will make a best effort to deliver each event, but cannot guarantee delivery. At-Least-Once Ensures that an event received by Vector will be delivered at least once to the configured destination(s). Beta Means that a feature has not met the criteria outlined in the Prod-Ready section and therefore should be used with caution in production environments.
![CODE EDITOR - source_labels: [__meta_consul_tags] regex: '.*(on|of).*' target_label: 'monitoring' replacement:](https://files.speakerdeck.com/presentations/4462995865b64a85bbeec4afe3d0faae/slide_36.jpg)
![CODE EDITOR [sinks.my_sink_id] # General type = "splunk_hec" # required](https://files.speakerdeck.com/presentations/4462995865b64a85bbeec4afe3d0faae/slide_48.jpg)
![Thank You! [email protected] @alleeclark allee.xyz](https://files.speakerdeck.com/presentations/4462995865b64a85bbeec4afe3d0faae/slide_50.jpg)